

















Car Showrooms

Car showroom analytics turns a dealership floor into numbers you can act on: how many people came through the doors, which vehicles they walked up to, how long they stayed beside each model, and how many of those visits became test drives and signed orders. V-Count sensors sit above the showroom entrances, over the forecourt and across every display zone, counting anonymously and excluding staff so the figures describe real prospects.

In BoostBI a manager sees the visit-to-test-drive-to-sale funnel, dwell per model display, visitors per sales consultant per hour and live occupancy in the service reception. Quiet Tuesdays and packed launch weekends stop being anecdotes and start being staffing, layout and marketing decisions.

Car Showroom people counters
Join the Ranks of Our Prestigious Clients

Explore the gallery showcasing our diverse range of customers. We’re proud to work with these leading brands, providing visitor analytics solutions that drive their success.

Benefits of Visitor Analytics for Car Showrooms

Car Showrooms People Counting 01

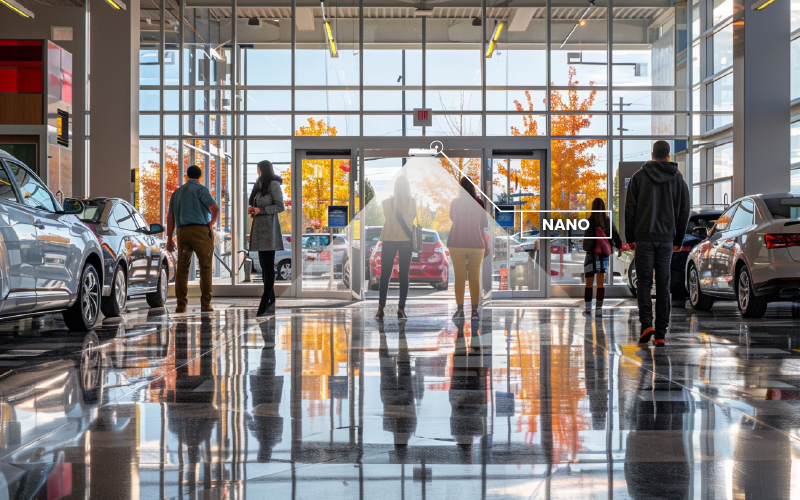
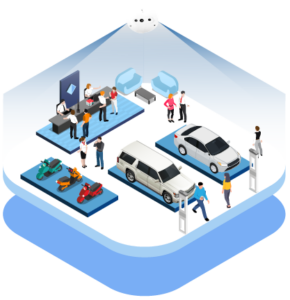
People counting solutions is a game-changing technology for car showrooms, offering a wealth of benefits to improve operations and elevate customer engagement. Real-time footfall traffic data and insights into visitor behavior empower showroom managers to make informed decisions. For example, when specific days or time periods draw more visitors, dealerships can strategically allocate resources and staff, ultimately enhancing customer satisfaction and potentially boosting sales.

By accurately monitoring foot traffic fluctuations before and after implementing new campaigns, dealerships can precisely assess the impact of their marketing campaigns and promotions. This data-driven approach facilitates the continuous refinement of marketing strategies, directing resources towards proven methods and enhancing the overall return on investment.

Additionally, conducting trend analysis tailored to each showroom location provides valuable insights. Understanding prevalent trends and benchmarking performance against other car showrooms, both locally and nationwide, enables dealerships to adapt effectively to changing market dynamics.

The implementation of people counting in car showrooms not only optimizes layouts, campaigns, and operations but also contributes to increased conversion rates and revenue growth as a result of all.
Car Showrooms Heatmap Zone Analytics 01

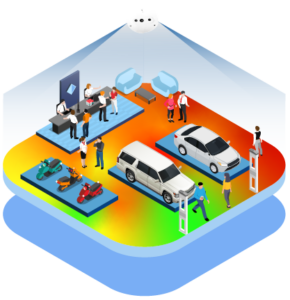
The integration of Nano Prime’s heatmap and Pick and Sense’s product engagement solutions introduces magical benefits to car showrooms, contributing to a more engaging and efficient environment.

Using the power of heatmap analytics enables the analysis of traffic patterns within the showroom. This invaluable data based on dwell times of showroom visitors guides dealerships in strategically optimizing the layout, allowing for the rearrangement of vehicles and promotional displays based on visitor hotspots. By aligning key offerings with areas of high visitor engagement, showrooms can significantly boost the visibility and appeal of specific cars and promotions, enhancing the chances of successful conversions.

Vehicle Engagement Tracking: With Pick and Sense technology, real-time monitoring of customer interactions with vehicles becomes a reality. Dealerships can track how frequently customers engage with cars and pinpoint which specific car features draw the most attention. By understanding which car doors are most frequently opened by showroom visitors, dealerships can tailor their strategies to highlight popular features and further enhance the overall showroom experience. This data-driven approach leads to more informed decision-making and a heightened level of customer engagement which results in boosted sales conversion.
The Importance of People Counting in Car Showrooms

Überblick

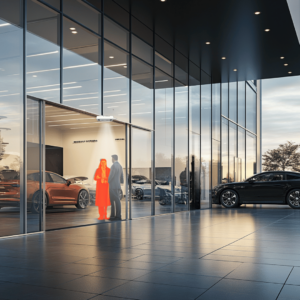
Untitled Design 13We install Nano at car showroom entrances to count visitors, ensuring you have accurate data on customer foot traffic so you can measure your store conversion. Our market-leading staff exclusion feature guarantees that the data reflects pure customer numbers by excluding employees from the count, allowing for precise analysis of customer visits.

Untitled Design 14By placing Nano on top of vehicles, we can accurately count the number of times a car’s trunk is opened.
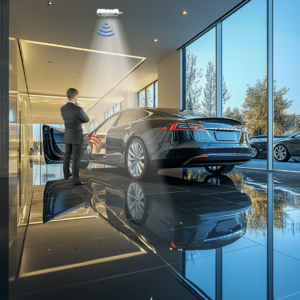
This data allows you to compare customer interactions with vehicles to the daily customer arrival count, offering deeper insights into which models attract the most interest and engagement, and helping you measure car visit conversion.

Untitled Design 15Our Pick and Sense technology provides detailed information on how often vehicle doors are opened.

This data is invaluable for understanding customer engagement with different car models, helping you measure car interaction conversions, identify popular features, and focus on potential areas for sales.

Car showroom analytics: what to measure

Car showroom analytics is the practice of measuring everything that happens between the front door and the signed order form. A dealership sells a handful of cars from hundreds of visits, so the most valuable numbers in a showroom are not the sales totals — they are the steps that lead to them. These are the metrics worth instrumenting in a showroom, a forecourt and a service department:

  • Showroom visitors, with staff excluded. A car showroom people counter above each entrance gives a clean count of prospects. Sales consultants, valets, service advisors and delivery drivers cross the door line dozens of times a day, and staff exclusion is what separates a usable footfall figure from noise.
  • The showroom funnel: visits → test drives → sales. Counted entries give you the top of the funnel that a CRM never sees, because nobody logs the visitor who browsed for ten minutes and left. Put the door count next to test-drive bookings and delivered units and you finally have two real conversion rates instead of one guess: visit-to-test-drive and test-drive-to-sale.
  • Dwell time per vehicle and per model display. Zone counting around each display bay shows which cars people actually walk up to and linger beside — the flagship in the window, the used stock at the back, the EV bay you invested a launch budget in. Attention is the earliest sales signal you can measure, and it arrives weeks before the order book moves.
  • Visitors per sales consultant per hour. Divide hourly showroom traffic by the consultants on shift and you get a coverage ratio. When that ratio spikes on Saturday afternoon, prospects are walking the floor unattended; when it collapses on Tuesday morning, you are paying for coverage nobody is using.
  • Service reception and waiting-lounge occupancy. Service is a second, separate flow with its own morning drop-off surge. Counting the reception desk and the customer lounge tells you when advisors are overwhelmed, how long people sit waiting, and whether the lounge is sized for the traffic it actually receives.
  • Peak patterns: weekends, evenings and launch events. Showroom demand is spiky. A model launch, a weekend finance offer or a local motor event can multiply a normal day’s traffic for a few hours. Hour-by-hour history turns those spikes into a staffing roster instead of a surprise.
  • Site-by-site benchmarking across the dealer group. Once every site counts the same way, a group can compare showrooms fairly: traffic per site, conversion per site, dwell per model per site. Differences that looked like “a better market” often turn out to be a difference in coverage or layout you can copy.

Where the sensors go in a car showroom

A showroom is a large, bright, glass-walled room with very few doors and a lot of open floor, so sensor placement is different from a high-street shop. A typical V-Count layout looks like this:

  • Main entrance and customer doors. A Nano AI sensor mounted overhead works as the car showroom footfall counter: it counts people in and out bidirectionally, ignores the same person loitering in the doorway, and excludes staff so the entry figure is prospects only.
  • Display zones around each vehicle. The same indoor sensors, configured as zones, report presence and dwell around individual cars and model groups. Combined with heatmap and zone analytics this is what tells you which stand draws a crowd and which corner of the floor people never reach.
  • Atriums, mezzanines and dark glass frontages. Showrooms often have five- or six-metre ceilings and strong backlight from the glazing. Nano AI, a 3D active stereo vision sensor, is designed for exactly those high-mount (up to 7 m) and difficult-light conditions.
  • Forecourt, used-car lot and outdoor display. A large share of dealership browsing happens outside, often after hours. Nano Outdoor is built for weather-exposed positions and brings the lot into the same count as the showroom floor.
  • Service reception, waiting lounge and handover bay. VCare shows live occupancy on a screen or feeds a threshold alert, so a full lounge or a queue at the service desk is visible the moment it forms rather than in next month’s report. Where people wait in line at a service desk or finance office, queue management adds waiting-time measurement on top of the count.
  • Everything reports into BoostBI. Counts, zone dwell, occupancy and conversion land in one cloud dashboard with per-site and group-level views, scheduled reports and alerts, so a dealer principal and a single-site manager look at the same numbers.

All of it is anonymous counting. The sensors process images on the device and output numbers — entries, exits, dwell, occupancy — not identities. No faces are stored, nobody is recognised or followed between visits, and the data a showroom manager sees is a count, which keeps the deployment straightforward under GDPR-style privacy rules. If you want the fundamentals first, start with people counting.

How dealerships use car showroom customer analytics

Numbers only matter when they change a decision. These are the decisions car showroom customer analytics actually drives:

  • Rostering the sales floor. Hourly traffic curves, not habit, decide how many consultants are on shift on a Saturday, during Thursday late-night opening, and in the dead first hour of a Monday. Coverage ratios show where an extra body earns its cost.
  • Placing the metal. If the new model sits in a bay people walk past on the way to the coffee machine, dwell will say so. Showrooms rearrange display order, turn cars towards the natural entry path, and move slow stock into high-traffic zones based on where feet and attention actually go.
  • Judging campaigns and events honestly. A radio campaign, a finance offer or a weekend launch event can be measured as incremental visitors against a normal-week baseline, then followed down the funnel into test drives. Attribution stops being a debate about which lead source ticked a box and becomes a traffic comparison.
  • Sizing the service department. Reception occupancy by hour tells you when to add an advisor to the drop-off rush and whether the waiting lounge needs more seats or a faster loaner process.
  • Setting fair targets across a dealer group. A site with half the traffic should not carry the same unit target. Traffic-adjusted targets, and conversion league tables between sites, replace volume-only comparisons.
  • Proving the quiet wins. Longer dwell, better coverage and higher visit-to-test-drive conversion show up in the data long before they show up in registrations, which gives a general manager something to manage weekly instead of monthly.

Want to see the funnel against your own showroom layout? Request a demo and we will walk through a sample dealership dashboard.

Car showroom people counting FAQ

What is car showroom analytics, and what does it measure?

Car showroom analytics is the measurement of visitor behaviour inside a dealership: how many people enter the showroom, which vehicles and zones they stop at, how long they stay, how busy each hour is, and how many of those visits turn into test drives and sales. It is collected by overhead sensors at the doors and around display areas rather than by staff tallies or CRM entries.

V-Count sensors feed counts, dwell and occupancy into BoostBI, where a showroom manager sees traffic, zone dwell and conversion for one site or for a whole dealer group.

How do I connect showroom visitors, test drives and sales into one funnel?

Start with an accurate door count, because that is the only number a dealership normally does not have. Once every entry is counted with staff excluded, you can divide test-drive bookings by showroom visits to get a visit-to-test-drive rate, and delivered units by test drives to get the closing rate.

V-Count supplies the traffic side of that funnel per hour, day and site; you pair it with the test-drive and sales figures you already record. Suddenly a fall in sales is traceable: fewer people came in, or the same number came in and fewer were converted.

How do I find out which cars on the display floor draw the most attention?

Configure each display bay as a counting zone. The sensors report how many people entered that zone and how long they stayed, so every vehicle or model group gets its own traffic and dwell figure.

Compare bays over a week and the pattern is unambiguous: the cars that hold people, the cars people glance at, and the corners of the floor nobody reaches. Dealerships use this to re-order the display, reposition slow stock into high-traffic zones, and prove to a manufacturer that a launch car is or is not getting attention.

How many visitors should one sales consultant cover?

There is no universal number — it depends on your sales process and how long a typical conversation takes — but you can measure it. Divide counted showroom visitors in each hour by the consultants rostered for that hour to get a coverage ratio, then look at what happens to conversion as the ratio rises.

Most showrooms find a threshold above which visit-to-test-drive conversion falls because prospects are waiting or leaving unattended. BoostBI charts traffic by hour so you can set the roster against the ratio instead of against tradition.

Can I measure occupancy in the service reception and waiting lounge too?

Yes, and it is usually the fastest win in a dealership. The service side has its own rhythm, with a heavy drop-off surge early in the morning and a collection peak late in the day.

A sensor over the reception area and the customer lounge gives live occupancy, and VCare can display it or trigger an alert when the lounge fills. Over time you get hour-by-hour occupancy that shows when to add an advisor, whether the lounge is sized correctly, and how long customers are actually sitting there.

How do I count visitors on an outdoor forecourt or used-car lot?

Use weather-rated sensors. Nano Outdoor is designed for exposed positions and covers forecourt entrances, lot walkways and outdoor display rows, including out-of-hours browsing when the showroom itself is closed. Those counts join the indoor data in BoostBI, so a dealership can see total site traffic rather than only the people who pushed the showroom door.

That matters for used-car operations especially, where a large share of looking happens outside and never registers as a showroom visit at all.

What is the difference between a car showroom people counter and a car showroom footfall counter?

In practice they describe the same hardware: an overhead sensor at the entrance that counts people in and out. “Footfall counter” is the retail term for total entries, while “people counter” is used more broadly and often implies the extra capabilities — staff exclusion, occupancy, zone dwell and group counting. A car showroom needs all of it, because entries alone will not tell you which vehicles held attention or how many prospects a consultant was covering.

V-Count sensors do both jobs from the same device.

Slide template not exist

Häufig gestellte Fragen

Alles, was Sie über mehr Besucher, Umsatz und Effizienz mit V-Count wissen müssen.

Was ist Autohaus-Analytik und was misst sie?
Autohaus-Analytik misst das Besucherverhalten in einem Autohaus: wie viele Personen den Showroom betreten, an welchen Fahrzeugen und Zonen sie stehen bleiben, wie lange sie bleiben, wie stark jede Stunde frequentiert ist und wie viele Besuche zu Probefahrten und Verkäufen führen. Erfasst wird dies mit Deckensensoren an den Türen und über den Ausstellungsflächen statt mit Strichlisten oder CRM-Einträgen. V-Count-Sensoren liefern Zählungen, Verweildauer und Belegung an BoostBI, wo die Showroom-Leitung Frequenz, Zonenverweildauer und Conversion für einen Standort oder eine ganze Händlergruppe sieht.
Wie verbinde ich Showroom-Besucher, Probefahrten und Verkäufe zu einem Trichter?
Beginnen Sie mit einer genauen Türzählung, denn diese Zahl fehlt einem Autohaus normalerweise als einzige. Sobald jeder Eintritt ohne Mitarbeitende gezählt wird, teilen Sie gebuchte Probefahrten durch Showroom-Besuche und erhalten die Quote von Besuch zu Probefahrt, ausgelieferte Fahrzeuge durch Probefahrten ergeben die Abschlussquote. V-Count liefert die Frequenzseite dieses Trichters pro Stunde, Tag und Standort; Sie kombinieren sie mit den bereits erfassten Probefahrt- und Verkaufszahlen. Ein Umsatzrückgang wird so nachvollziehbar: Es kamen weniger Menschen, oder es kamen gleich viele und weniger wurden überzeugt.
Wie finde ich heraus, welche Fahrzeuge auf der Ausstellungsfläche die meiste Aufmerksamkeit erhalten?
Richten Sie jede Ausstellungsbucht als Zählzone ein. Die Sensoren melden, wie viele Personen die Zone betreten und wie lange sie geblieben sind, sodass jedes Fahrzeug oder jede Modellgruppe eigene Frequenz- und Verweilwerte erhält. Vergleichen Sie die Buchten über eine Woche, und das Muster ist eindeutig: Fahrzeuge, die Menschen festhalten, Fahrzeuge, die nur flüchtig betrachtet werden, und Ecken, die niemand erreicht. Autohäuser nutzen dies, um die Ausstellung umzustellen, Langsamdreher in stark frequentierte Zonen zu verschieben und dem Hersteller zu belegen, ob ein Neuwagen Aufmerksamkeit bekommt. V-Count Nano Prime meldet jede Ausstellungsbucht als Zone.
Wie viele Besucher sollte ein Verkaufsberater betreuen?
Eine allgemeingültige Zahl gibt es nicht – sie hängt von Ihrem Verkaufsprozess und der Dauer eines typischen Gesprächs ab –, aber sie lässt sich messen. Teilen Sie die gezählten Showroom-Besucher jeder Stunde durch die in dieser Stunde eingeteilten Berater und erhalten Sie ein Betreuungsverhältnis; beobachten Sie dann, wie sich die Conversion bei steigendem Verhältnis verändert. Die meisten Showrooms finden eine Schwelle, ab der die Quote von Besuch zu Probefahrt sinkt, weil Interessenten warten oder unbetreut gehen. BoostBI stellt die Frequenz pro Stunde dar, sodass Sie den Dienstplan am Verhältnis statt an Gewohnheiten ausrichten.
Kann ich auch die Belegung der Serviceannahme und der Kundenlounge messen?
Ja, und das ist in einem Autohaus meist der schnellste Erfolg. Der Service hat einen eigenen Rhythmus mit einem starken Abgabeansturm am frühen Morgen und einer Abholspitze am späten Nachmittag. Ein Sensor über Annahme und Kundenlounge liefert die Live-Belegung, und VCare kann sie anzeigen oder einen Alarm auslösen, wenn die Lounge voll wird. Mit der Zeit entsteht eine stündliche Belegung, die zeigt, wann ein weiterer Serviceberater nötig ist, ob die Lounge richtig dimensioniert ist und wie lange Kunden tatsächlich warten.
Wie zähle ich Besucher auf einem Außenausstellungsplatz oder Gebrauchtwagenhof?
Verwenden Sie wetterfeste Sensoren. Nano Outdoor ist für exponierte Positionen ausgelegt und deckt Platzeinfahrten, Wege auf dem Hof und Außenausstellungsreihen ab, einschließlich Besuchen außerhalb der Öffnungszeiten, wenn der Showroom geschlossen ist. Diese Zählungen fließen in BoostBI mit den Innendaten zusammen, sodass ein Autohaus die gesamte Standortfrequenz sieht und nicht nur die Menschen, die die Showroom-Tür geöffnet haben. Das ist besonders für das Gebrauchtwagengeschäft wichtig, wo ein großer Teil des Umschauens draußen stattfindet und nie als Showroom-Besuch erfasst wird.
Was ist der Unterschied zwischen einem Personenzähler und einem Besucherfrequenzzähler im Autohaus?
In der Praxis beschreiben beide dieselbe Hardware: einen Deckensensor am Eingang, der Personen hinein und hinaus zählt. „Frequenzzähler“ ist der Handelsbegriff für die Gesamteintritte, während „Personenzähler“ breiter verwendet wird und oft die zusätzlichen Funktionen meint – Mitarbeiterausschluss, Belegung, Zonenverweildauer und Gruppenzählung. Ein Autohaus braucht all das, denn Eintritte allein verraten nicht, welche Fahrzeuge Aufmerksamkeit hielten oder wie viele Interessenten ein Berater betreute. V-Count-Sensoren erfüllen beide Aufgaben mit demselben Gerät.