Häufig gestellte Fragen
Alles, was Sie über mehr Besucher, Umsatz und Effizienz mit V-Count wissen müssen.
Welche Tools eignen sich am besten für eine Heatmap im Einzelhandel?
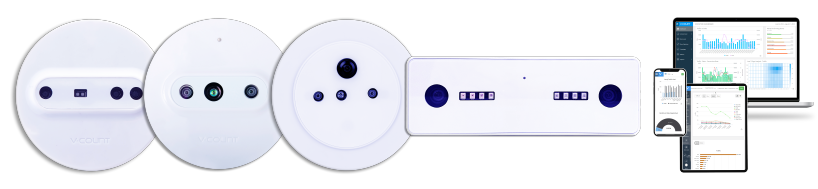
Es gibt drei Gruppen. WLAN- und Mobilfunk-Tools sind günstig, erfassen aber nur Kunden mit erkennbarem Gerät – die Zonenwerte sind eine Stichprobe, keine Zählung. Reine Software-Lösungen auf Basis vorhandener Videokameras sind schnell getestet, doch die Genauigkeit hängt von Kamerawinkeln ab, die für Sicherheit statt Analyse gewählt wurden. Speziell montierte Deckensensoren mit Zonenanalyse liefern die verlässlichsten Verweil- und Zonenzählungen. V-Count gehört zur dritten Gruppe: Nano AI oder Nano Prime speisen Heatmap- und Zonenansichten in BoostBI. Fragen Sie Anbieter, wie Zonen definiert werden und ob Rohdaten exportierbar sind.
Was ist der Unterschied zwischen einer Laden-Heatmap und einer Retail-Heatmap?
Inhaltlich keiner – beide beschreiben dasselbe in unterschiedlichem Umfang. „Laden-Heatmap“ meint meist einen Standort und seinen Grundriss, „Retail-Heatmapping“ die breitere Praxis inklusive Filialvergleich, Mall-Gängen und mehrgeschossigen Flächen. Gemessen wird jeweils anonyme Bewegung und Verweildauer auf einem Grundriss. V-Count Nano Prime liefert beide Ansichten.
Benötigen Heatmaps Kameras, die einzelne Kunden identifizieren?
Nein. V-Count-Sensoren messen anonym. Sie erkennen, dass eine Person eine Zone für eine bestimmte Zeit belegt hat, speichern aber keine Gesichter, bilden keine Identitäten und verfolgen niemanden über mehrere Besuche. In BoostBI kommt nur eine Zählung und Dauer, verknüpft mit Zone und Zeitstempel. Das macht Heatmap- und Zonenanalyse auch in streng regulierten Märkten einsetzbar.
Wie lange dauert es, bis genug Daten für eine verlässliche Heatmap vorliegen?
Ein erstes Muster sehen Sie nach wenigen Tagen, handeln sollten Sie aber noch nicht. Der Handel folgt einem starken Wochenrhythmus, daher sind zwei bis vier volle Wochen das Minimum, um Werktage und Wochenenden abzubilden und Ausreißer zu glätten. Bei Aktionen oder Umbauten sollten Sie gleich lange Zeiträume davor und danach vergleichen, bei saisonalen Sortimenten dieselben Wochen des Vorjahres. V-Count Nano Prime erfasst diese Daten kontinuierlich.
Funktioniert Heatmap- und Zonenanalyse in einem Einkaufszentrum mit vielen Mietern?
Ja, Malls gehören zu den stärksten Anwendungsfällen. Zonen werden auf Gänge, Eingänge, Rolltreppen, Food Courts und einzelne Ladenfronten gelegt, sodass Sie Ströme zwischen Ankermietern und die Capture Rate je Einheit sehen. Nano Outdoor deckt Außeneingänge und Parkplatzzugänge ab. Vermieter nutzen die Daten für Mietermix, Mietverhandlungen und Flächenmanagement.
Was ist Verweildaueranalyse und warum ist sie wichtiger als Besucherfrequenz?
Die Verweildaueranalyse misst, wie lange Besucher in einer definierten Zone bleiben. Frequenz allein unterscheidet nicht zwischen jemandem, der stehen bleibt und ein Produkt betrachtet, und jemandem, der auf dem Weg zur Kasse vorbeigeht. Eine Zone mit vielen Besuchen und sehr kurzer Verweildauer ist ein Durchgang, kein Ziel. Verweildauer plus Zonenzählung ergibt die Capture Rate und mit Kassendaten die Konversion je Zone. V-Count Nano Prime misst die Verweildauer pro Zone.
Wie viele Zonen sollte ein Geschäft definieren?
Weniger, als man zunächst denkt. Beginnen Sie mit Bereichen, in denen Sie handeln können: Eingang und Schaufenster, jede Hauptkategorie, Umkleiden oder Service-Theke und die Kassenschlange. Für ein typisches Fachgeschäft sind das fünf bis zehn Zonen. Zu viele kleine Zonen erzeugen unruhige Zahlen. Zonen werden in BoostBI per Software definiert, lassen sich also später teilen oder für eine Aktion temporär anlegen.