建物内のあらゆる共用スペースの管理をもっと簡単に
Every building has busy moments. The lobby fills up, the café line grows, lunch service peaks and restrooms need attention. V-Count helps your teams see these moments early, respond with confidence and keep the experience smooth throughout the day.
なぜ重要なのか
Better visibility creates better experiences for visitors and for the teams who run the building. Building teams are asked to keep service quality high, manage traffic, support cleaning teams, plan staffing and use energy more intelligently. That is difficult when decisions are based on yesterday’s reports or fixed routines. Live occupancy data gives teams a clearer way to act today.
What your teams can do better:
- どの入口・フロア・共用エリアが、いつ最も混雑するかを把握できます。
- 警備・受付・清掃・保守の各チームを、適切な場所に適切なタイミングで配置できます。
- より明確な根拠に基づいて、人員配置・空調(HVAC)・施設運営を計画できます。
- 建物全体で、より落ち着いた一貫性のある体験を生み出せます。
入口からあらゆる共用スペースまで
Entrance counting is only the starting point. The real value comes from understanding where traffic builds, which levels are under pressure and where service teams should step in before visitors feel the problem.
Respond faster when spaces get busy — Spot peak periods in lobbies, meeting zones and corridors so teams can respond before small issues become visible.
Plan staffing with confidence — Schedule reception, security and operations teams around real demand rather than fixed routines.
Manage each floor more intelligently — Compare floors, identify bottlenecks and see which areas need more support, better signage or more service coverage.
Use energy more intelligently — Use real occupancy patterns to align HVAC and building operations with actual activity during the day.
企業のカフェテリア、カフェ、自販機エリア
In smart buildings, cafeterias, cafés and vending areas are high-traffic spaces that shape the employee and visitor experience every day. V-Count helps teams understand exactly when demand rises, when it slows down and how to align staff, food production, queue management and replenishment with real usage.
Free corporate cafeterias: When lunch is free, the goal is not conversion — it is service quality, food availability and waste control. People counting data helps teams predict busy and quiet periods, prepare the right amount of food and schedule serving staff around real demand.
Paid cafés and branded coffee bars: For paid cafeterias and coffee shops, queue length directly affects sales. V-Count helps operators open the right number of service points, reduce abandonment, optimize staff shifts and increase throughput during peak hours.
Vending and micro markets: Traffic data can also guide vending-machine and micro-market strategy. Place machines where demand is strongest, replenish based on actual usage patterns and identify which areas need more capacity or better positioning.
スマートトイレ
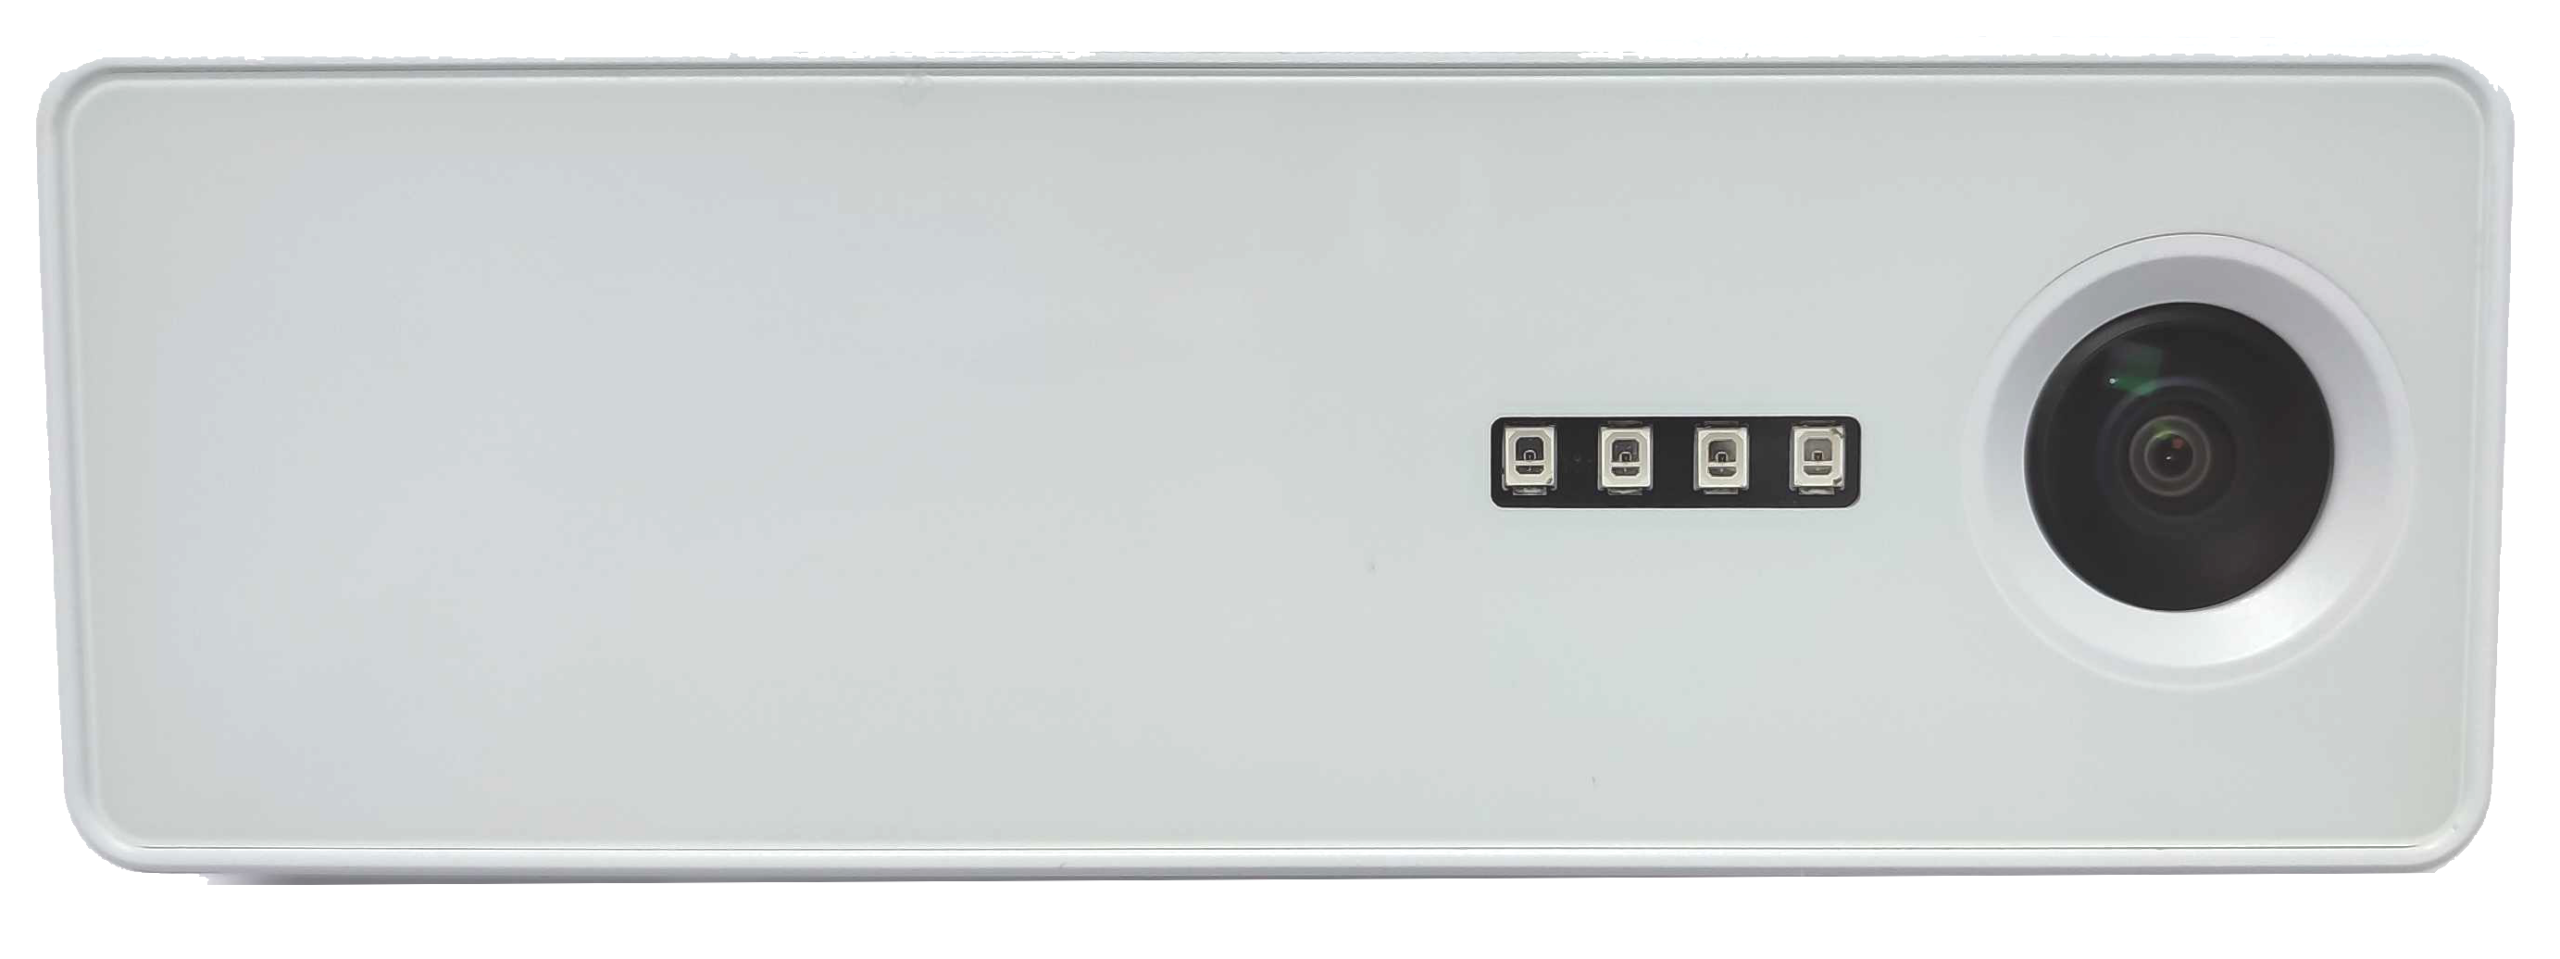
In airports, malls, offices and other high-traffic buildings, restrooms need attention at different moments during the day. A Nano AI sensor at the restroom entrance helps teams understand real usage, so cleaners can be sent when demand is high and supplies can be prepared before problems appear.
How this helps cleaning teams:
- 固定スケジュールに従うだけでなく、利用者数が適切なしきい値に達したときに清掃員を派遣できます。
- 混雑する時間帯を早期に察知し、クレームになる前に待ち時間を減らせます。
- 実際のトイレ利用状況に基づいて、ペーパー・石けん・その他の消耗品を補充できます。
- 出張者・従業員・来訪者に、より清潔で信頼できるトイレ体験を提供できます。
すべてのチームに、ひとつの明確なビュー
Executives need the big picture. Facility managers need clear signals. Frontline teams need fast action. With BoostBI, everyone works from the same live view on desktop and mobile — bringing occupancy, flow, café and restroom insights together in one dashboard.
単なる在館人数を超えて
Smart-building analytics should not stop at total traffic. With V-Count, teams can separate employees from visitors, understand demographic patterns anonymously, and make better decisions about staffing, service quality, campaigns and space planning.
Staff Exclusion — Remove staff movements from visitor counts so occupancy, conversion and staffing reports reflect real customer or visitor traffic.
Gender Recognition — See anonymous gender split trends across entrances, floors, zones or locations to evaluate campaign fit, service approach and experience design.
Age Recognition — Understand which age groups visit at different times and locations. Align offers, layouts, communication and staffing style with the people actually using the space.
なぜチームがこのアプローチを選ぶのか
- 来訪者体験の向上 — 来訪者が最も気にする空間で、待ち時間・混雑・サービスの取りこぼしを減らします。
- より無駄のない日々の運営 — 清掃・フードサービス・人員配置・保守の労力を、本当に重要な場所に、適切なタイミングで集中させます。
- 自信を持った意思決定 — 拠点を比較し、パフォーマンスを評価し、運営上の変更を実際の根拠で裏づけられます。
- プライバシーの保護 — 個人を特定できる画像を取得することなく、匿名のトラフィックインサイトでデリケートな空間を把握します。
- 拠点を超えた拡張 — 国際的な運営のために構築されたプラットフォームで、複数のサイト・ポートフォリオ・地域にわたって単一の分析レイヤーを活用します。
- チームを行動につなげる — シグナルをより速くタスクに変え、運営チームがサービス品質の低下前に対応できるようにします。
あなたの施設に合わせてカスタマイズしませんか?
From offices and corporate cafeterias to malls, airports, hospitals and education sites, this approach adapts to your operation. We can help map the right sensor setup, analytics scope and dashboard structure for your building or portfolio. Request a demo to get started.