
الخرائط الحرارية وتحليلات داخل المتجر
حسّن مسار عملائك نحو الشراء

تقنية خرائط حرارية تعزّز الإيرادات
ربحية أعلى مع توزيع أمثل للمنتجات
- حسّن تصميم المتجر باستخدام رؤى سلوك العملاء ل زيادة مدة البقاء.
- حدّد المنتجات التي تحصد أكبر قدر من الاهتمام، ثم حسّن توزيع المنتجات استراتيجياً لتعزيز المبيعات.
- حدّد المناطق ذات الحركة العالية وضع فيها المواد الدعائية والإعلانات التفاعلية استراتيجياً ل تعزيز جهودك التسويقية.
احجز عرضاً توضيحياً الآن لتحقيق أقصى إمكانات أعمالك:
ما هي تحليلات المناطق داخل المتجر؟
تتيح البيانات المستمدة من حل تحليلات التجزئة داخل المتجر للشركات فهم مدة بقاء الزوار وتعزيز تفاعل العملاء وتحديد أسباب نجاح أداء بعض المناطق، وتطبيق هذه المعرفة على مناطق أخرى لتحقيق أفضل النتائج.
والاستفادة من هذه البيانات تمكّن تجّار التجزئة من اتخاذ قرارات مدروسة تحسّن تصميم المتجر وتوزيع المنتجات وتوزيع الموظفين، بما يؤدي في النهاية إلى زيادة المبيعات ورضا العملاء.
فوائد تحليلات المناطق
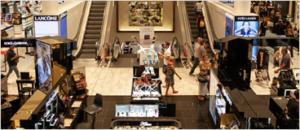
حسّن تصميم المتجر

حسّن توزيع المنتجات
عزّز فعالية التسويق

ارفع رضا العملاء
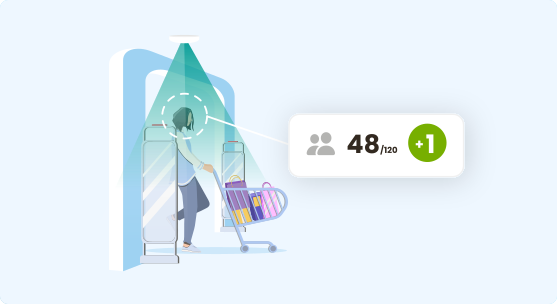
VCARE للإشغال في الوقت الفعلي
أدر الإشغال لديك في الوقت الفعلي
تابع وأدر حركة الزوار الواردة بشكل مجهول الهوية عبر الفحص الرقمي. وراقب مستويات الإشغال عن كثب لتحسين تجربة العميل ومتابعة أداء فريقك.
القطاعات التي نخدمها







اشترك في نشرتنا الإخبارية
في ظل مشهد أعمال سريع التغيّر، لم يعد الاطلاع أمراً مفيداً فحسب بل ضرورة. اشترك لتبقى في طليعة المعرفة بقطاع تحليلات الزوار.
الأسئلة الشائعة
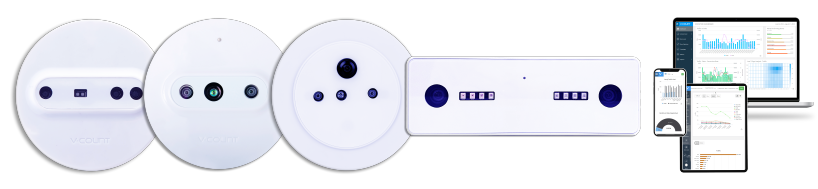
V-Count sensor is installed in specific zones to measure visitor interest by providing traffic, dwell-time, heatmap and visitor flow metrics per zone. The data is then sent to the V-Count BoostBI platform as easy-to-understand reports.
Our team of experts can provide you with personalized assistance depending on your needs. We will advise you on the suitable solutions, the right number of sensors, the suitable sensor locations or zones, and the installation and setup of the sensors and analytics platform.
Zone counting, zone dwell time, heatmap and visitor flow can be seen in detail on the dashboard screen with graph and table options.
Yes, you can import your sales data into our BoostBI dashboard manually or automatically with an API. V-Count analyzes the correlation between the sales and zone data. You can also export the data through an API and use it in your management systems.
Zone Analytics can work together with the below solutions: Zone Counting, Zone Dwell Time, Visitor Flow and Heatmap.
The number of sensors required depends on the height of the ceiling and the zones you’d like to monitor. Our team of experts will review your floor plan and the desired counting area and advise you on the estimated number of sensors required.
The number of sensors you need depends on the size of your physical store and the solutions you are looking for. You’ll be recommended by our expert teams on the number of sensors you need for premium accuracy.
Our configuration and updates are managed remotely. But in case you need on-field support, we provide a professional service to all our customers with International Technical Support Team.
We are globally available all around the world. We provide a professional service to our customers with the International Technical Support Team.
Our 3D active stereo vision technology allows counting people in complete darkness.