دورات المياه
V-Count turns a public restroom into a measured facility. Entrance-mounted sensors count everyone who walks into the washroom corridor, so cleaning teams stop working to a fixed clock and start working to real usage. A restroom occupancy counter tells you how many visits a block has taken since it was last serviced, how many people are inside right now, and when the next peak is due. Men’s and women’s facilities are counted as separate zones, sensors sit at the entrance only — never inside cubicles — and no images or personal data are stored. Shopping malls, airports, offices, stadiums and motorway services use the numbers to route janitors, size consumables orders and prove service levels to the client who signed the facility contract.
استكشف المعرض الذي يُبرز مجموعتنا المتنوّعة من العملاء. نفخر بالعمل مع هذه العلامات التجارية الرائدة، مقدّمين حلول تحليلات الزوّار التي تدفع نجاحها.


















فوائد تحليلات الزوّار لإدارة دورات المياه
Counting restroom visits changes cleaning from a timetable into a response. Every entrance is counted in and out, so each block reports its own visits since the last service, its live occupancy and its hourly usage curve. Cleaning is triggered when a block crosses a usage threshold, not when the clock says so, which means quiet blocks are left alone and busy ones are serviced before anyone complains. The same visit counts forecast paper, soap and liner consumption per block, and the hourly curve sets shift patterns around the peaks that matter in your venue — departure banks at an airport, lunch in an office, half-time in a stadium.
Restroom queues form quietly and are rarely reported. Live occupancy from the entrance count makes them visible: sustained high occupancy with slow entry flow means people are waiting outside the door. Capacity and wait-time displays can hold entry when a block is full and point visitors to a quieter facility on the same floor or in the next terminal pier, which spreads demand instead of letting one block absorb it. Over a season the same data shows which blocks queue every single peak — the evidence needed to justify extra cubicles, a second entrance or a refurbishment rather than more cleaning hours.
People counting for restrooms: what to measure
A restroom is not judged by how many people it served, it is judged by whether it was clean when the last person walked in. That makes the useful metrics different from a shop floor, and it is why a restroom occupancy counter is read by cleaning supervisors rather than by marketers. These are the numbers facility and janitorial teams actually act on.
- Visits since last service. The single most useful figure in restroom management. Count entries, reset when a cleaner signs the block off, and you have a usage-based cleaning trigger instead of a fixed two-hourly round.
- Live occupancy. How many people are inside the block right now, derived from entries minus exits. This drives capacity screens at the door, queue displays in a terminal and hold-back messaging at motorway services on a bank holiday.
- Peak-hour pattern. Public toilet footfall by hour and by weekday. Airports peak around departure banks, offices around lunch and the end of the day, stadiums at half-time, motorway services on Friday afternoons. The pattern tells you when to staff, not only how much.
- Consumables usage. Paper, soap and liners track visit counts far more closely than they track elapsed time. Visit totals per block turn into a replenishment schedule and a purchasing forecast instead of a guess.
- Queue pressure. Sustained high occupancy combined with a slow entry rate means people are waiting outside. Once it is measured it becomes a design argument for more cubicles or a second block, not an anecdote.
- Service-level evidence. Visits per cleaning cycle, time between a threshold alert and the clean that answered it, and cleans completed per shift, exported per site. This is what a facility management contract is audited against.
Men’s, women’s, accessible and baby-change facilities are counted as separate zones, because they fill at different rates and almost never need servicing at the same moment. Averaging them into one site figure hides the one block that is actually in trouble.
Where the sensors go
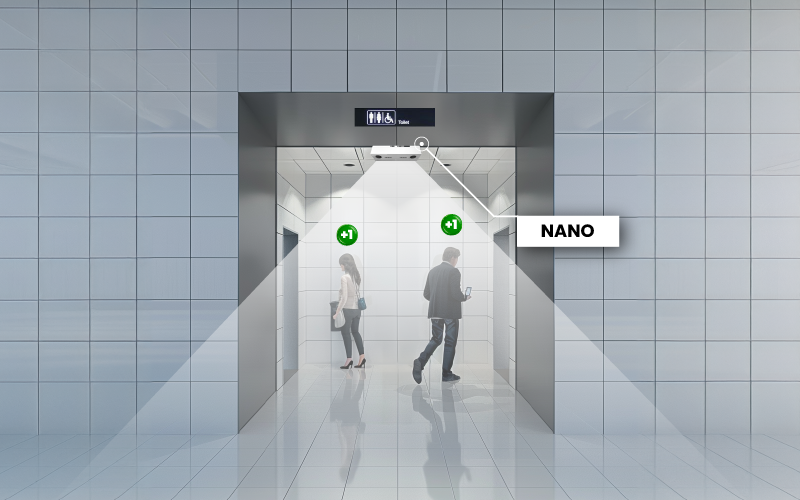
Restroom sensors are mounted overhead in the entrance corridor, facing the doorway or the lobby threshold. They are never installed inside a cubicle, never inside the washroom area itself, and never anywhere a person would reasonably expect privacy. The entrance line is the only place a washroom people counter needs to be: everybody who uses the facility crosses it twice, once in and once out, and that is all the arithmetic requires.
- Nano AI is the default indoor choice — an AI camera sensor above the entrance of each block, counting in and out on a bidirectional line. It copes with the short, narrow approach corridors typical of mall and office washrooms.
- Nano Prime uses 3D stereo vision and suits high-ceilinged or poorly lit entrances — airport concourse washrooms, stadium undercrofts, transport interchanges — where light levels change through the day.
- Nano Outdoor covers standalone toilet blocks at motorway services, parks, beaches and transport forecourts, where the entrance is open to the weather.
- VCare turns the live in-and-out count into real-time restroom occupancy for a capacity screen at the door or a queue display further down the concourse, with its own limit set per block.
- BoostBI collects every block across every site, holds the usage thresholds that raise cleaning alerts, and reports visits per cleaning cycle by site, block and shift.
One sensor per restroom entrance is the normal design. A block with two ways in gets a sensor on each, netted into a single occupancy figure. Where washrooms sit behind a secured lobby, counting the lobby door as well gives you the floor traffic that feeds the rest of your people counting deployment, so restroom usage can be read against the visitors who were in the building to begin with.
How restroom operators use the data
Restroom occupancy monitoring only pays for itself when it changes a decision. In malls, airports, office towers, venues and motorway services these are the six decisions it changes first.
- Usage-based cleaning triggers. Set a visit threshold per block. When the count crosses it, BoostBI raises the task. Quiet blocks are not cleaned to satisfy a timetable, and busy ones are cleaned before they turn into complaints or a social media photo.
- Janitorial routing. When every block reports its own count, a supervisor orders the round by need rather than by floor plan, and sends the next free cleaner to whichever block is closest to its threshold rather than to the next one on the list.
- Staffing to the pattern. The hourly curve sets shift start times, break cover and the size of the mid-shift team. A stadium needs almost everyone in the forty minutes around half-time; an office tower needs a steady two-person round and a lunchtime surge.
- Consumables replenishment. Order and restock against measured usage per block instead of refilling every dispenser on every round. Trolleys get loaded for the blocks that will actually consume, and stock-outs in the busiest facility stop being routine.
- Capacity and queue control. VCare holds a live count against a limit and drives a screen at the entrance, while queue management displays point people to the quieter block on the next level or the next pier before they join a line at all.
- Contract and compliance evidence. A facility management provider can show the client visits served, thresholds hit and cleans completed per shift for every block on site. A landlord or airport operator can verify it against the same data. Service-level arguments stop being a matter of opinion.
Over a longer horizon, a year of public toilet footfall answers capital questions: which block justifies more cubicles, whether the women’s facility is structurally undersized against the men’s, and whether a refurbishment or a second entrance would do more for wait times than extra cleaning hours ever will.
Restroom occupancy monitoring and privacy
This matters more in restrooms than in any other venue we work in, so we will be plain about it. V-Count sensors are mounted in the entrance corridor and nowhere else. There is no sensor inside a cubicle, inside a washroom area, above a urinal or facing a mirror — not as a configuration option, not on request. The device counts a person crossing a line at the door and produces two events, an entry and an exit.
The counting itself is anonymous. The sensor processes what it sees on the device and outputs numbers: how many in, how many out, at what time. It does not identify anybody, does not follow an individual between visits, and does not store or transmit images of people to BoostBI. What reaches the dashboard is a count per block per interval, which is why the same deployment can be rolled out across a mall, an airport or a portfolio of office buildings without holding personal data about the people using the facilities.
Signage at the entrance stating that anonymous counting is in use is good practice and we recommend it, both because it is honest and because it removes the question before anyone has to ask it.
Restroom people counting FAQ
Where exactly are the sensors mounted in a restroom?
Overhead in the entrance corridor, facing the doorway or lobby threshold of each block. Nothing is installed inside a cubicle, inside the washroom area, above a urinal or facing a mirror. The entrance is the only mounting point required, because every user crosses that line twice — once entering and once leaving — which is all the occupancy calculation needs. A block with two entrances gets one sensor per entrance and the counts are netted into a single figure for that facility.
Does a restroom occupancy counter record video of people?
No. The sensor processes what it sees on the device itself and outputs numbers only: entries, exits and timestamps. No images of people are stored or sent to BoostBI, nobody is identified, and no individual is followed between visits. The dashboard receives a count per block per interval. That anonymous-by-design posture is why the same deployment can be rolled out across a mall, an airport terminal or a whole office portfolio without collecting personal data about the people using the facilities.
Can men’s and women’s facilities be counted separately?
Yes, and they should be. Each entrance is its own counted zone in BoostBI, so men’s, women’s, accessible and baby-change facilities report their own visits, occupancy and peak pattern. They fill at different rates and rarely need servicing at the same moment, so a single averaged site figure hides the block that is actually in trouble. Separate zones also let you see whether one facility is structurally undersized against the other before a refurbishment budget is set.
How does the system decide when a restroom needs cleaning?
You set a visit threshold per block in BoostBI — the number of uses that block can absorb before it needs attention. The counter runs up from the last completed service, and when it crosses the threshold the platform raises a cleaning task. After the clean is signed off the count resets and starts again. Thresholds can differ by block and by time of day, so a concourse washroom on a departure peak triggers far more often than a back-of-house facility.
Can we show live restroom occupancy on a screen at the door?
Yes. VCare holds the live in-minus-out count against a limit you set for that block and drives a display at the entrance or further down the concourse. It can show a simple free-or-full state, a number of free places, or a redirect to a quieter facility on another level or in the next pier. The same live figure can hold entry during an event turnaround and release it automatically when the block empties.
How does counting cope with groups, queues and people who turn back at the door?
The entrance line is bidirectional, so anyone who walks in and walks straight back out nets to zero rather than inflating the visit count. Nano AI separates people walking side by side or in a group through a doorway, and Nano Prime’s 3D stereo vision is used where the entrance is high, dim or wide enough that a standard camera angle would struggle. Staff and cleaners can be excluded from the operational counts so a cleaning round does not trigger the next one.
Can the data be used for consumables ordering and contract reporting?
That is what most facility teams use it for. Paper, soap and liner consumption tracks visit counts far more closely than it tracks elapsed time, so visits per block become a replenishment schedule and a purchasing forecast. For contracts, BoostBI exports visits served, thresholds reached and cleans completed per shift and per site, which gives an FM provider and its client the same evidence to read. Book a demo and we will walk through the reports on your own floor plan.
الأسئلة الشائعة
تحديث المرجع: 2026-09-18