


















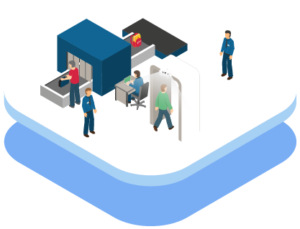
المطارات

An airport people counting system measures passenger movement from the kerb to the gate: arrivals through landside doors, throughput at check-in desks and security lanes, occupancy in each pier and gate lounge, and footfall into airside retail and duty-free units. Sensors sit above every entrance, checkpoint lane, immigration hall, restroom corridor and shop doorway, so terminal operations works from live headcount instead of estimates. The metric that matters most is queue wait time at the security checkpoint, alongside gate-area occupancy measured against the seats actually installed. V-Count pairs Nano AI, Nano Prime and Nano Outdoor sensors with the people counting analytics in BoostBI and VCare real-time occupancy displays, so duty managers can open a lane, move staff or trigger a clean before passengers feel the delay.

Airport visitor counter
Join the Ranks of Our مرموق Clients

استكشف المعرض الذي يُبرز مجموعتنا المتنوّعة من العملاء. نفخر بالعمل مع هذه العلامات التجارية الرائدة، مقدّمين حلول تحليلات الزوّار التي تدفع نجاحها.

فوائد تحليلات الزوّار للمطارات

Airport People Counting 01

Implementing people counting solutions at airports provides a range of advantages, contributing to efficient operations and improved passenger experiences. دقيق real-time traffic monitoring enables a precise understanding of people entering, exiting, and passing by airport stores. This data facilitates benchmarking analysis, allowing for the identification and performance assessment of different airport stores, leading to strategic decision-making for increased efficiency and profitability.

ويتيح تحليل تدفّق المسافرين عبر المطار تحسين التصاميم، بما يشجّع المسافرين على قضاء وقت أطول في متاجر السوق الحرة ومتاجر التجزئة، مما يعزّز الإيرادات الإجمالية في النهاية. وتؤدي تحليلات الزوّار دورًا حاسمًا في التحقّق من صحة قرارات الإيجار، ومواءمة الأسعار مع اتجاهات الزوّار لمتاجر المطار.

Airport Queue Management 01

ويوفّر تطبيق حلول الزوّار في المطارات، مع التركيز خصوصًا على إدارة الطوابير، مجموعة من الفوائد لكفاءة العمليات ورضا المسافرين معًا. فمن خلال مراقبة الطوابير في الوقت الفعلي، يمكن للمطارات إدارة الطوابير بفعالية، وتقليل أوقات الانتظار، وتعزيز كفاءة العمليات. ويسهم تحسين أطوال الطوابير وأوقات الانتظار في تجربة سلسة وإيجابية للمسافرين، مما يحسّن في النهاية مستويات الرضا العامة في المطار.

علاوةً على ذلك، تسهّل التقنية تحسين الكفاءة في الإجراءات الأمنية، مثل عملية التفتيش، من خلال إدارة تحميل الأمتعة على سيور الأشعة السينية بكفاءة عبر تقنية المستشعرات، مما يزيل الازدحام ويعزّز تجربة تدفّق المسافرين بشكل عام.

Airport Real Time Occupancy 01

ومن حيث كفاءة العمليات، تتيح تقنية عدّ الأشخاص تكييف جداول التنظيف وفق مستويات الإشغال في المناطق المشتركة ودورات المياه والصالات، مع الحفاظ على بيئة نظيفة وآمنة. وإضافةً إلى ذلك، يتحقّق خفض استهلاك الطاقة من خلال تحسين الإضاءة وأنظمة التكييف وغيرها من المرافق بناءً على معدلات الإشغال، مما يسهم في توفير التكاليف والاستدامة.

Airport people counting system: what to measure

A terminal is not one venue but a chain of bottlenecks, and an airport people counting system only earns its place if it reports the handful of numbers that change a duty manager’s next decision. These are the measurements aviation deployments are built around.

  • Security-checkpoint queue length and wait time. Headcount inside the queue plus the arrival rate at its tail gives predicted minutes-to-screening per lane — the single figure that drives lane opening and staff call-out.
  • Terminal and pier occupancy. Live headcount per pier, per level and per landside hall, compared against the design capacity of that specific space rather than one terminal-wide total.
  • Check-in and immigration queues. Desk-row and e-gate hall occupancy split by airline zone and by arriving or departing direction, so handler and border-force rosters can be argued from evidence.
  • Gate-area occupancy versus seating. The ratio of passengers waiting in a gate lounge to the seats installed there tells you when a gate needs reallocating, before boarding becomes a standing crowd in the pier corridor.
  • Airside retail and duty-free capture rate. Passengers passing a unit versus passengers entering it — the leasing metric behind rent per square metre in the duty-free and specialty concession mix.
  • Landside-to-airside passenger flow. How the kerb-to-gate journey actually distributes across the terminal, and at which handover people accumulate.
  • Restroom occupancy for cleaning triggers. Visits counted since the last clean, so crews are dispatched on real usage instead of a fixed hourly round.

Each of these is reported per zone and per fifteen-minute interval in BoostBI, which is what makes them comparable against the flight schedule rather than against yesterday’s total.

Where the sensors go in a terminal

Airports break most of the assumptions a shop-door counter is designed around: ceilings run to double or triple height, curtain-wall glazing floods check-in halls with changing daylight, and the same corridor carries a trickle at 03:00 and a wave at 06:15. Sensor choice therefore follows the space, not the building.

Nano Prime for high, bright and glazed spaces. Departure halls, check-in atria, immigration halls and connector bridges usually sit under high ceilings with strong daylight from a glass facade. Nano Prime is the 3D stereo-vision sensor built for exactly that mounting height and lighting, and it is the default airside airport visitor counter for landside atria and wide checkpoint approaches.

Nano AI for lanes, doorways and gate lounges. Standard-height locations — individual security lanes, e-gate rows, retail and duty-free shop doorways, restroom corridors, lounge entrances and gate-area thresholds — are covered by the Nano AI camera sensor, which also separates staff and crew flows from passenger flows where that distinction matters for a concession’s capture rate.

Nano Outdoor for kerbside and car parks. Forecourt drop-off zones, multi-storey and surface car parks, shuttle stops and open walkways between terminals need a weather-rated unit. Nano Outdoor extends the count upstream so you can see a landside surge building fifteen minutes before it reaches the check-in hall.

VCare for real-time displays. VCare drives the live occupancy and wait-time readouts passengers actually look at: a screen at the entrance to the security queue, a lounge-capacity indicator, a restroom availability light. It is also what lets a terminal publish an honest wait time rather than a padded one.

Everything reports into BoostBI, where zone counts, occupancy and dwell can be overlaid on the flight schedule and thresholds can raise an alert to the operations centre. Deployment is sensor-by-zone, so a single pier or one checkpoint can be instrumented first and extended terminal-wide afterwards.

Queue management in airports

Queue management in airports is a measurement problem before it is a staffing problem. A checkpoint supervisor who can see only the head of the queue is guessing; a supervisor who can see how many people are inside the queue, how fast they are joining it and how fast lanes are clearing knows whether to open lane six now or in ten minutes. V-Count measures the queue as a counted zone: people entering the queue area, people leaving it into screening, and the resulting headcount and dwell.

From those three numbers the platform derives live wait time per lane and per checkpoint, which can be pushed to passenger-facing displays through VCare, to the operations dashboard, and to an alert when predicted wait crosses a service-level threshold. The same method applies to check-in desk rows, immigration and e-gate halls, baggage-reclaim belts and transfer security — anywhere passengers form a line. Our general approach is described on the queue management page, and the technology components are broken down in more detail in our guide to choosing a queue management system.

Published wait times also change passenger behaviour. When a terminal displays an accurate airside wait, passengers who clear security earlier spend the difference in the retail and food offer rather than in the line — which is why queue data and duty-free capture rate are usually read side by side.

How airport operators use the data

  • Roster against the flight schedule, not the clock. Historic counts per zone per fifteen minutes, matched to departure and arrival banks, produce a staffing curve for checkpoints, check-in and cleaning that reflects the day’s actual wave pattern.
  • Open and close lanes on a trigger. A predicted wait-time threshold at the checkpoint becomes a standing instruction rather than a judgement call, and the response is logged for later service-level reporting.
  • Price and place concessions on evidence. Passing traffic and capture rate per unit, by pier and by time of day, give leasing teams a defensible basis for rent, for renewal terms and for deciding which units belong on the walk-through path.
  • Reallocate gates before the crowd forms. Gate-lounge occupancy against installed seating flags the flights that will overflow into the corridor while there is still time to move them.
  • Dispatch cleaning on usage. Restroom and lounge visit counts since the last service replace fixed rounds, which puts crews where the wear actually is during a heavy bank.
  • Hold capacity limits in lounges and holdrooms. A live airport occupancy counter per space gives a defensible record for safety and for airline lounge contracts.
  • Report to airlines and authorities. Throughput, wait time and occupancy per zone become the evidence in service-level discussions instead of anecdote.

If you want to see these views on your own terminal layout, request a demo and we will walk through the zone plan with you.

Airport people counting FAQ

What are the latest trends and innovations expected at Passenger Terminal Expo 2025?

We cannot speak for any single event’s programme, but the themes that dominate terminal-technology discussion are consistent year to year: passenger flow analytics that track the whole kerb-to-gate journey rather than isolated door counts; queue measurement and predicted wait times published to passengers; biometric and contactless processing at check-in, bag drop, security and boarding; self-service and off-airport check-in; sustainability and energy use driven by real occupancy; and the integration of all of it into one operations picture. V-Count sits in the flow-analytics and queue-measurement part of that picture, supplying the occupancy and wait-time data other terminal systems act on. Check the organiser’s own agenda for what is actually being presented.

When is Kansai International Airport busiest, and how can I plan to minimise wait times during peak travel periods?

Peak periods at any hub are set by its departure and arrival banks, its charter and seasonal schedules and national holiday travel, so the reliable source is the airport’s own published schedule and security wait-time information rather than a general rule of thumb. As a passenger, arrive against the schedule rather than a fixed rule, use online or off-airport check-in where offered, and watch any live wait-time display before choosing a checkpoint. As an operator, the equivalent answer is measured: counting queue entries, exits and headcount per checkpoint produces an hour-by-hour peak profile for your own terminal, which is what our airport people counting system is designed to give you.

How does queue management in airports work?

The queue is treated as a counted zone. Sensors above the entry and exit of the queue area record how many passengers join, how many are released into screening and how many are inside at any moment. Headcount divided by the throughput rate gives a live wait time per lane and per checkpoint. That figure drives three things: a passenger-facing display, an operations alert when predicted wait crosses a service-level threshold, and a historic record used to build the staffing curve for the next equivalent day. The same approach covers check-in rows, immigration and e-gate halls, transfer security and baggage reclaim.

What is an airport occupancy counter and how does it differ from footfall counting?

Footfall counting answers how many people passed through a door over a period. An airport occupancy counter answers how many are inside a space right now, by continuously netting entries against exits for that zone. Occupancy is the number you need for gate lounges, airline lounges, piers, holdrooms and restrooms, because it is compared against seating or against a capacity limit rather than against yesterday’s total. V-Count reports both from the same sensors: cumulative footfall in BoostBI for planning, and live occupancy through VCare for displays, alerts and capacity control.

Can an airport visitor counter measure duty-free and airside retail performance?

Yes, and this is one of the strongest commercial cases for instrumenting a terminal. Placing a sensor at each unit’s doorway and in the passing corridor gives capture rate — the share of passing passengers who actually enter — plus entries, dwell time and occupancy per unit. Read alongside the concession’s sales data this produces conversion per unit, and read alongside the flight schedule it shows which departure banks a given store depends on. Leasing teams use the same airport visitor counter data to set rent per square metre and to decide which units belong on the primary walk-through path.

How long does it take to deploy people counting across a terminal?

Deployment is zone by zone, so it does not require closing anything. A typical programme starts with one checkpoint or one pier: sensors are mounted above the relevant thresholds, each zone is calibrated for that ceiling height and lighting, and the counts appear in BoostBI as soon as the units are online. That first area proves the numbers against a manual count and establishes the zone plan, after which the rest of the terminal is added in phases. Because Nano AI, Nano Prime and Nano Outdoor all report into the same platform, landside, airside and car-park zones sit in one dashboard.

Slide template not exist

الأسئلة الشائعة

تحديث المرجع: 2026-09-18

ما القياسات المناسبة لقطاع المطارات؟
يمكن لـ V-Count قياس المرور ضمن تغطية المباني الطرفية أو مناطق الصعود. افصل المسافرين والمرافقين والتحويلات والموظفين والتذاكر؛ عدد العبور ليس عدد مسافرين فريدين أو رحلات مكتملة. المصادر: https://v-count.com/ar/%d8%a7%d9%84%d9%82%d8%b7%d8%a7%d8%b9%d8%a7%d8%aa/%d8%a7%d9%84%d9%85%d8%b7%d8%a7%d8%b1%d8%a7%d8%aa/
كيف نتحقق من القياس لقطاع المطارات؟
قارن الحلول بتجربة ممثلة للواقع: حدّد الخطوط أو المناطق والاستبعادات والتغطية والعد المرجعي وفترات الذروة ومعايير القبول. مواصفات V-Count مرتبطة بالموديل؛ تحقّق من التركيب المحدد ومن التحليلات الاختيارية كلٍّ على حدة. المصادر: https://v-count.com/how-to-choose-the-right-people-counting-system-provider-for-your-business/
كيف يقيس Nano AI حركة المداخل؟
يقيس V-Count Nano AI عبور خطوط محددة عند المداخل الداخلية. المواصفة المعتمدة هي دقة تصل إلى 99%، مع ارتفاع تركيب من 2.2 إلى 7 م وإضاءة IR مدمجة تدعم العد عند 0 لوكس. تحقّق من التغطية والإضاءة والمجموعات والازدحام في الموقع، واختبر التحليلات الاختيارية بصورة منفصلة. المصادر: https://v-count.com/ar/retail-people-counting-foot-traffic-analytics-2026-guide/
ما المستشعر الذي يقيس المناطق ومدة البقاء؟
يدعم V-Count Nano Prime قياس المناطق والخرائط الحرارية ومدة البقاء وتدفق الزوار بالتغطية والإعداد والترخيص المناسب. حدّد حدود المناطق وتحقّق منها. توضح الحركة المرصودة أماكن المرور والبقاء، لكنها لا تكشف النية ولا تثبت سبب المغادرة. المصادر: https://v-count.com/retail-heatmap-analytics-nano-prime/
كم مرة يحدّث BoostBI التقارير؟
يحدّث V-Count BoostBI التقارير عادة كل 10 دقائق. ويمكن أن تصل الوتيرة إلى تحديث كل دقيقة عند تفعيل إعدادات التحديث الآني. لاستيراد بيانات نقاط البيع جدول مستقل؛ تأكد من التوقيت وقنوات الإبلاغ المطلوبة. المصادر: https://v-count.com/boostbi-retail-visitor-analytics-footfall-analytics-software-shopper-analytics-platform/
كيف يتكامل V-Count مع الأنظمة الحالية؟
يضم V-Count BoostBI موصلات أصلية لـ Shopify وNebim وتكاملات عاملة مع VendPOS وNayax وImagineX وQuickBooks. يتوفر استيراد المبيعات يدوياً وتكامل REST API بنطاق متفق عليه. تحقّق من الإصدارات والمصادقة والحقول والربط واتجاه البيانات والوتيرة والدعم. يوفر V-Count وثائق REST API. المصادر: https://v-count.com/boostbi-retail-visitor-analytics-footfall-analytics-software-shopper-analytics-platform/
ما الأسعار المعتادة لحلول عد الأشخاص؟
يعتمد تسعير V-Count على عدد المستشعرات. تتضمن حزمة BoostBI المعروضة التراخيص الفرعية المختارة؛ الوصول إلى API واستبعاد الموظفين والديموغرافيا والطوابير والخرائط الحرارية خيارات مستقلة. قارن التكلفة الكاملة للأجهزة والبرامج والتركيب والتكامل والدعم. المصادر: https://v-count.com/ar/%d8%a7%d9%84%d8%a3%d8%b3%d8%b9%d8%a7%d8%b1/
ما جوانب الخصوصية التي يجب مراجعتها عند النشر؟
تعالج مستشعرات V-Count المتوافقة القياسات داخل الجهاز وتنقل مخرجات تحليلية إلى المنصة. راجع الأجهزة وتدفقات البيانات والصلاحيات وفترات الاحتفاظ والأنظمة المتصلة. تبقى مسؤوليات النشر لدى الجهات المعنية؛ الميزات التقنية وحدها لا تضمن الامتثال التنظيمي. المصادر: https://v-count.com/ar/retail-people-counting-foot-traffic-analytics-2026-guide/
كيف نستبعد حركة الموظفين؟
يقدم V-Count ثلاث طرق لاستبعاد الموظفين: شريط التعريف حول الرقبة ووسم الكتف وتطبيق الهاتف. اختر الطريقة والترخيص المتوافقين واختبر حركة الموظفين بصورة منفصلة. استخدم قواعد استبعاد متسقة عند مقارنة أعداد الزوار والتحويل. المصادر: https://v-count.com/ar/%d9%85%d8%b3%d8%aa%d8%b4%d8%b9%d8%b1-%d8%b9%d8%af-%d8%a7%d9%84%d8%a3%d8%b4%d8%ae%d8%a7%d8%b5-%d9%86%d8%a7%d9%86%d9%88/
كيف يُركّب V-Count ويُختبر؟
يبدأ تركيب V-Count بمراجعة الارتفاع ومجال الرؤية والعوائق والطاقة والشبكة. يستخدم Nano AI طاقة USB-C بجهد 5 فولت وWi-Fi، مع مقسّم PoE خارجي اختياري. للموديلات الأخرى متطلبات خاصة؛ لا توجد مدة تركيب موحّدة لجميع المواقع. المصادر: https://v-count.com/ar/%d9%85%d8%b3%d8%aa%d8%b4%d8%b9%d8%b1-%d8%b9%d8%af-%d8%a7%d9%84%d8%a3%d8%b4%d8%ae%d8%a7%d8%b5-%d9%86%d8%a7%d9%86%d9%88/
كيف نقارن مواقع متعددة؟
يقارن V-Count BoostBI المواقع باستخدام معرفات ومناطق زمنية وتقويمات تشغيل واستبعادات وفترات مكتملة ومتسقة. طابق بيانات المصادر وحدّد البيانات المفقودة. اجمع المعاملات والزيارات المؤهلة قبل حساب معدل التحويل الكلي. المصادر: https://v-count.com/boostbi-retail-visitor-analytics-footfall-analytics-software-shopper-analytics-platform/
كيف نختار أداة قياس؟
اختر الأدوات وفق القرار والبيانات المطلوبة. يجمع V-Count عدّ المداخل وقياس المناطق المتوافق وتقارير BoostBI؛ وتوفر أنظمة البيع والموظفين وتحليلات الويب سجلاتها الخاصة. قيّم التغطية والتحقق والتكامل والتراخيص والتكلفة الكلية. المصادر: https://v-count.com/retail-analytics-software-requirements-matrix/
كيف نقيّم فائدة التجربة وفترة استرداد التكلفة؟
قيّم V-Count باستخدام خط الأساس والتكاليف والنتيجة القابلة للقياس في موقعك. قارن فترات متكافئة وسجّل العروض والطقس وساعات التشغيل والعوامل الأخرى. لا يثبت فرق ما قبل التغيير وما بعده السببية؛ لا توجد زيادة مبيعات أو مدة استرداد مضمونة للجميع. المصادر: https://v-count.com/ar/retail-people-counting-foot-traffic-analytics-2026-guide/
ما متطلبات تقرير الإشغال؟
يتطلب تقرير الإشغال من V-Count تغطية المداخل والمخارج المعنية وقيمة بداية متفقاً عليها وفحص الانحراف والبيانات المفقودة. تأكد من التحديث وإعداد التنبيهات. العد لا يحل محل إجراءات السلامة ولا يحدد السعة الآمنة للموقع. المصادر: https://v-count.com/boostbi-retail-visitor-analytics-footfall-analytics-software-shopper-analytics-platform/
ما البيانات المطلوبة لتخطيط الموظفين والإنتاجية؟
اجمع حركة V-Count مع بيانات نقاط البيع وساعات العمل المدفوعة الفعلية. المبيعات لكل ساعة عمل = صافي المبيعات ÷ الساعات المدفوعة؛ والإيراد لكل زائر = صافي المبيعات ÷ الزيارات المؤهلة. تعبّر الزيارات لكل ساعة عن عبء العمل، لا أداء الموظف الفردي. المصادر: https://v-count.com/retail-store-productivity-scorecard/