تحليلات متاجر التجزئة للتجزئة الفعلية
تربط تحليلات متاجر التجزئة حركة المتجر بالمبيعات والتوظيف ومناطق التسوق، فيحصل كل فريق تجزئة على رؤية أوضح لمكان التصرف. V-Count هي طبقة التحليلات داخل المتجر للمتاجر الفعلية: مستشعرات مجهولة الهوية، وتحليلات عملاء التجزئة، وتقارير BoostBI في منصة واحدة.
تجمع V-Count بين مستشعرات Nano وBoostBI لتحويل نشاط المتجر المقاس إلى رؤى للمتجر ومؤشرات أداء للتجزئة يمكن لفرقك التصرف بناءً عليها في الأسبوع نفسه.
ثلاث رؤى. قرارات أوضح للمتجر.
شاهد كيف تجيب الحركة والمعاملات ونشاط المناطق عن أسئلة تجزئة مختلفة.
الحركة حسب الساعة
افهم فترات الازدحامتحويل المتجر
اربط الزيارات بالمبيعاتنشاط المناطق
قارن المناطق المقاسةتستخدم الحركة والتحويل يوم المثال نفسه؛ وأعداد المناطق قياسات نموذجية منفصلة. تحقق من المدخلات والتعريفات وتغطية المستشعرات قبل مقارنة التقارير.
أربع طرق لقياس أداء المتجر
اختر السؤال أولاً، ثم طابق المستشعر ومدخل البيانات والتقرير. يتناول هذا المحور الأشخاص الذين يتحركون عبر المتاجر الفعلية — لا نقرات المواقع الإلكترونية أو بيانات الخرائط الإقليمية.
| حالة الاستخدام | ما الذي يُقاس | الإعداد والدليل |
|---|---|---|
| الحركةاعرف متى يصل المتسوقون | أعداد المداخل والزيارات المؤهلة وفترات الازدحام. حدّد خط العد وساعات العمل واستبعادات الموظفين. | Nano AI + BoostBI استكشف دليل حركة الزوار ← |
| التحويلاربط الزيارات بالمشتريات | معاملات الشراء المؤهلة ÷ زيارات المتجر المؤهلة × 100. طابق المتجر والفترة وقواعد نقاط البيع. | أعداد المداخل + بيانات نقاط البيع في BoostBI قِس تحويل المتجر ← |
| الإنتاجيةخطط للفريق وفق الطلب | الزيارات أو المعاملات لكل ساعة عمل. اجمع الحركة والمبيعات مع ساعات العمل المطابقة. | تقارير BoostBI + بيانات القوى العاملة لديك استكشف مؤشرات أداء التجزئة ← |
| قياس المناطقراجع التصاميم والعروض | زيارات المناطق ومدة البقاء والحركة ضمن تغطية موثقة. قارن فترات بيع مكافئة. | Nano Prime + تقارير مرخصة للمناطق / الخرائط الحرارية استكشف الخرائط الحرارية للمتاجر الفعلية ← |
ابدأ بصورة واضحة لحركة المتجر
قِس الأشخاص الداخلين إلى المتجر، وحدد فترات الازدحام، واتفق على الزيارات التي تنتمي إلى تقاريرك.
استخدم خطوط عدّ وقواعد استبعاد موظفين متسقة، ثم تحقق من فترة نموذجية مقابل عدّ يدوي.
استكشف دليل حركة الزوار في التجزئة ←
المستشعر المناسب. التقرير المناسب.
طابق الأجهزة والتراخيص مع التقارير التي تحتاجها. أداء العد ونطاق التركيبة السكانية وتغطية المناطق اعتبارات تركيب منفصلة.
Nano AI
لعدّ الأشخاص عند المداخل وتطبيقات استبعاد الموظفين والتركيبة السكانية والطوابير المتوافقة.
دقة عدّ تصل إلى 99%. ارتفاعات العد المدعومة: 2.2–7 م. تدعم مصابيح LED المدمجة بالأشعة تحت الحمراء العد في ظلام 0 لوكس.
تحقق من الارتفاع المقترح وعرض المدخل وكثافة الحركة والإضاءة في موقعك.
اطلع على مواصفات Nano AI ←Nano Prime
للخرائط الحرارية وتحليل المناطق في المتاجر الفعلية، بما في ذلك الزيارات ومدة البقاء في المناطق المهيأة.
حدّد المناطق حول العروض أو الأقسام أو مناطق الخدمة. وخطط لمواضع المستشعرات وتغطيتها حول التصميم الفعلي للمتجر.
تحقق من التغطية المركّبة. تُظهر ملاحظات الحركة أين تنقّل المتسوقون أو بقوا؛ لكنها لا تثبت بمفردها السبب.
استكشف Nano Prime ←BoostBI
تربط منصة التقارير من V-Count تحليلات الزوار ببيانات أداء المتجر ذات الصلة وتوجيه AI Sales Coach الأسبوعي.
تُحدَّث التقارير عادةً كل 10 minutes؛ ويمكن للتكوينات الفورية المفعّلة التحديث بتكرار يصل إلى كل دقيقة.
الوصول إلى API واستبعاد الموظفين والتركيبة السكانية والطوابير والخرائط الحرارية تراخيص فرعية مختارة ضمن الباقة المعروضة.
اعرض التقارير والمدخلات والتكاملات ←اجعل الأرقام مفيدة قبل التصرف
اتفق على القواعد
وثّق الزيارات المؤهلة واستبعادات الموظفين ومعالجة المجموعات والدخولات المتكررة. وحافظ على اتساق معرّفات المتاجر وساعات العمل والمناطق الزمنية وفترات التقارير.
افحص المدخلات
قارن عينة من أعداد المستشعر بفحص يدوي. وطابق إجماليات نقاط البيع والمرتجعات والإلغاءات. وحدد البيانات المفقودة قبل مقارنة المتاجر.
اختبر إجراءً واحداً
راجع تغييراً في التوظيف أو العرض أو الخدمة عبر فترات قابلة للمقارنة. وسجّل العروض الترويجية وظروف البيع إلى جانب مؤشر الأداء الذي تتتبعه.
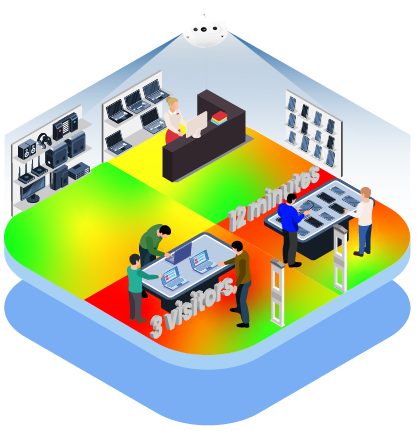
اعرف أين يقضي المتسوقون وقتهم
قارن الزيارات ومدة البقاء حول العروض والأقسام ومناطق الخدمة المحددة باستخدام قياس المناطق من Nano Prime.
خطط لتغطية المستشعرات وتحقق من كل منطقة قبل استخدام التقارير لتقييم تغيير في التصميم.
اقرأ دليل الخرائط الحرارية للمتاجر الفعلية ←اجمع الحركة والمبيعات في النقاش نفسه
BoostBI هو طبقة تحليلات الزوار في إعداد بيانات التجزئة لديك. اربط البيانات اللازمة لتقرير محدد، ثم اتفق على مالك المصدر وتوقيت الاستيراد والمطابقة.
التكاملات المدعومة
لدى Shopify وNebim موصلات أصلية. كما تُستخدم تكاملات VendPOS وNayax وImagineX وQuickBooks. أكّد الإصدارات والحقول والتكوين المدعومة لمشروعك.
عمل مخصص على REST API
توفر V-Count توثيقاً لواجهة REST API. حدّد نطاق اتصالات نقاط البيع أو تخطيط موارد المؤسسة أو ذكاء الأعمال المخصصة حول اتجاه البيانات والمصادقة وربط الحقول والجدولة ومسؤوليات الدعم.
تقرير يمكن للفرق الوثوق به
يتوفر أيضاً الاستيراد اليدوي للمبيعات. طابق جدول تسليم بيانات نقاط البيع مع فترة تقارير الحركة. فتحديث الحركة كل دقيقة لا يجعل تغذية نقاط بيع متأخرة فورية.
كيف استخدمت فرق التجزئة V-Count
تُظهر قصص العملاء المنشورة هذه تطبيقات عملية لتحليلات الزوار. وتصف دراستا Samsung وSephora عمليات نشر لأجهزة سابقة؛ وهما ليستا اختبارات أداء لـ Nano AI أو Nano Prime الحاليين.
الحركة والتوظيف ومقارنة المتاجر
تصف دراسة حالة Samsung في تركيا استخدام بيانات الزوار لمراجعة التوظيف في ساعات الذروة ومقارنة أداء المتاجر وفحص المناطق في مركز تجربتها في Emaar Mall.
نشر سابق: مستشعرات 3D Alpha+. تتضمن الدراسة المنشورة النتائج التي أبلغ عنها تاجر التجزئة.
اقرأ دراسة حالة Samsung (PDF) ←رؤية أكثر فائدة لنشاط المتجر
تصف دراسة Sephora في تركيا استبدال عدّادات الشعاع خلال برنامج تجديد المتاجر واستخدام تقارير حركة محسّنة لدعم القرارات التشغيلية.
نشر سابق: مستشعرات 3D Alpha+ في عام 2017. تناقش الدراسة تحسينات التحويل دون زيادة مقدّرة كمياً.
اقرأ دراسة حالة Sephora (PDF) ←خطط للمناوبات حول فترات الازدحام
في مقابلة العميل المنشورة من V-Count، تصف Tai Loy استخدام حركة المتجر لإعادة تنظيم مناوبات الموظفين ومراجعة العروض ومقارنة المواقع عبر شبكتها.
مقابلة العميل: شمل التطبيق 84 متجراً في الوقت الموصوف.
استكشف Tai Loy ومزيداً من قصص العملاء ←
ما الذي تقيسه تحليلات متاجر التجزئة
تحليلات متاجر التجزئة هي قياس ما يحدث أمام المتجر الفعلي وداخله: كم شخصاً يصل، وإلى أين يذهبون، وكم يبقون، وكم ينتظرون في الطابور، وكم يشترون. تُبنى التحليلات داخل المتجر على مستشعرات عند الباب وفوق الممرات لا على النقرات، لذا تختلف مجموعة المقاييس عن أي شيء يمكن لتقرير ويب إنتاجه. والقياسات الثمانية أدناه هي مؤشرات الأداء الأساسية للتجزئة التي يُتوقع من أدوات تحليلات التجزئة الجادة تقديمها، وهي أساس تحليلات عملاء التجزئة في المتاجر الفعلية.
| القياس | ما الذي يجيب عنه | كيف تنتجه V-Count |
|---|---|---|
| حركة الزوار وحركة المتجر | كم شخصاً دخل في كل ساعة أو يوم أو فترة بيع؟ | مستشعرات Nano AI أو Nano Prime فوق المدخل، مع التقارير في BoostBI. اطلع على عدّ الأشخاص. |
| معدل التحويل | ما حصة الزوار الذين اشتروا شيئاً؟ | الحركة المقاسة مرتبطة بمعاملات نقاط البيع داخل BoostBI. |
| مدة البقاء | كم يبقى المتسوقون في المتجر، أو في منطقة واحدة منه؟ | توقيت المناطق من مستشعرات Nano Prime الاستريو ثلاثية الأبعاد المركّبة في السقف. |
| المناطق والخرائط الحرارية | أي الممرات والتجهيزات والعروض تحظى بالانتباه، وأيها مساحة ميتة؟ | الخرائط الحرارية وتحليلات المناطق، مع مزيد من الشرح في تحليلات مناطق المتجر والخرائط الحرارية. |
| الطابور ووقت الانتظار | كم يبلغ طول طابور الدفع، ومتى يتجاوز هدف الخدمة؟ | إدارة الطوابير مع تنبيهات فورية. |
| التركيبة السكانية | ما التوزيع التقديري للعمر والجنس للجمهور أمام عرض ما؟ | التعرف على الجنس والعمر، بشكل مجهول ومجمّع. |
| معدل الالتقاط | ما حصة المارين أمام الواجهة الذين دخلوا فعلاً؟ | مستشعر خارجي عدّاد حركة الزوار عند الواجهة مقارنة بأعداد الباب. وهذا جوهر تحليلات الواجهات. |
| نسبة الموظفين إلى الحركة | هل كان عدد كافٍ من الزملاء في الصالة عندما كان المتجر مزدحماً؟ | الحركة الساعية مقارنة بساعات المناوبة، وهي الطريقة العملية لقياس إنتاجية المتجر. |
هذه القياسات الثمانية هي ما يميز منصة ذكاء التجزئة عن جدول بيانات لإجماليات المبيعات. تخبرك المبيعات بالنتيجة؛ وتخبرك تحليلات المتجر بعدد الفرص التي أتيحت لك لتحقيق تلك النتيجة. والفرق التي تستخدم المجموعة الكاملة باتساق تستطيع التمييز بين يوم هادئ ويوم سيئ التوظيف، وبين منتج ضعيف وموضع ضعيف في مخطط الطابق. ولشرح أطول لجانب القياس، اقرأ دليل عدّ الأشخاص وتحليلات حركة الزوار في التجزئة لعام 2026.
التحليلات داخل المتجر مقابل تحليلات التجارة الإلكترونية
يحصل المتجر الإلكتروني على الجلسات ومسارات التحويل والتحويل مجاناً، لأن الموقع يسجل كل زيارة. أما المتجر الفعلي فلا يسجل شيئاً بمفرده. وتوجد التحليلات داخل المتجر لإعادة بناء تلك الطبقة المفقودة بالأجهزة: المستشعر عند الباب يعادل عدّاد الجلسات، والمنطقة تعادل صفحة المنتج، ومدة البقاء تعادل الوقت على الصفحة. ودون مستشعرات لا يملك المتجر سوى المعاملات، وهو ما يشبه الحكم على موقع إلكتروني من تأكيدات الطلبات وحدها.
| السؤال | تحليلات التجارة الإلكترونية | التحليلات داخل المتجر |
|---|---|---|
| من وصل؟ | جلسات يسجلها خادم الويب | أعداد أبواب مجهولة الهوية من مستشعرات عدّ الأشخاص |
| ما الذي نظروا إليه؟ | مشاهدات الصفحات | زيارات المناطق ومدة البقاء والخرائط الحرارية |
| أين انسحبوا؟ | خطوات مسار التحويل | طول الطابور ووقت الانتظار والطوابير المتروكة |
| هل اشتروا؟ | أحداث الدفع | معاملات نقاط البيع مرتبطة بالحركة المقاسة |
| من هم؟ | بيانات الحساب وملفات تعريف الارتباط | تحليلات عملاء تجزئة مجهولة ومجمّعة فقط |
| كم تكلف عملية الجمع؟ | وسم في الصفحة | المستشعرات والتركيب والمعايرة ومنصة التقارير |
ولهذا يجب أيضاً قياس نقاط التواصل في التجزئة وفق شروطها الخاصة. فقد يبحث المتسوق عبر الإنترنت، ثم يدخل، ويصطف، ويغادر، ويطلب من المنزل في المساء؛ والجزء الفعلي فقط من نقاط التواصل هذه يحتاج إلى أجهزة. والجمع بين الجانبين هو ما تقصده معظم الفرق عندما تسأل عن جمع رؤى المتجر عبر القنوات الإلكترونية والفعلية: تأتي أرقام الويب من منظومة تحليلات الويب، وتأتي الأرقام الفعلية من برنامج حركة التجزئة، وتُطابق الاثنتان في تقرير واحد حسب التاريخ والموقع والفئة. ويبدأ أي نقاش جاد حول خلق الإيرادات وتحليلات التجزئة من هنا، لأن الإيرادات تُخلق من الفرص التي أتيحت للمتجر فعلاً، لا مما صادف أنه باعه فقط.
ملاحظة حول الفئات: تقنية المتاجر المستقلة، بما في ذلك AiFi والشركات المرتبطة بها، تؤتمت الدفع بدلاً من التقارير. وإذا كنت تقارن تلك الفئة بأدوات تحليل التجزئة أو متتبع المتسوقين، فهي تجيب عن أسئلة مختلفة. تخبرك تحليلات حركة التجزئة بعدد من جاؤوا وما فعلوه؛ ويغيّر الدفع المستقل طريقة دفعهم. تقع V-Count في الفئة الأولى وتتكامل مع الأنظمة التي تتولى الثانية.
كيف يحوّل BoostBI بيانات المتجر إلى قرارات
BoostBI هو برنامج تقارير التجزئة السحابي من V-Count. يتلقى الأعداد من مستشعرات Nano المتوافقة، ويطبق تسلسل متاجرك الهرمي وساعات عملها، ويعرض النتيجة في لوحات وتنبيهات ومقارنات معيارية، فيحصل مدير المتجر والمدير الإقليمي ومحلل المقر الرئيسي كلٌّ على الأرقام نفسها بمستوى التفصيل الذي يحتاجه. وهذا هو الفرق بين تغذية بيانات خام ومنصة ذكاء تجزئة.
اللوحات
مقاييس الحركة والتحويل ومدة البقاء والطوابير على شاشة واحدة، مصفّاة حسب المتجر أو المنطقة أو فترة اليوم أو فترة البيع. ويمكن استيراد المبيعات ليُحسب التحويل بدلاً من تقديره، وهكذا تصبح معظم مؤشرات أداء التجزئة قابلة للمقارنة بين الفروع.
التنبيهات
ترسل تنبيهات الحدود للإشغال وطول الطابور والحركة غير المعتادة رسالة بينما لا تزال المناوبة جارية. والتنبيهات هي ما يجعل رؤى المتجر تشغيلية بدلاً من استرجاعية، وهي أسرع طريق إلى إنتاجية أفضل للمتجر.
المقارنات المعيارية
قارن متجراً بتاريخه الخاص، أو بالمتوسط الإقليمي، أو بمجموعة متماثلة من الفروع. والمقارنة المعيارية هي ما يحوّل أداة تحليلات تجزئة واحدة إلى وسيلة لترتيب المواقع بإنصاف، بدلاً من مكافأة المتجر الذي يقع في الشارع الأكثر ازدحاماً.
التصدير والتكاملات
تنقل التصديرات المجدولة وواجهات API والموصلات الحركة المقاسة إلى أنظمة ذكاء الأعمال والقوى العاملة وعرض البضائع، فتصل تحليلات حركة التجزئة إلى التقارير التي تفتحها فرقك بالفعل كل صباح إثنين.
وبهذا الاستخدام، تجيب المنصة عن أسئلة تشغيلية بدلاً من إنتاج ورق حائط: أي الساعات تعاني نقصاً في الموظفين، وأي منطقة فقدت الانتباه بعد تغيير التشكيلة، وأي فرع يحوّل بشكل ضعيف رغم حركة جيدة، وأين تتقيد إنتاجية التجزئة بالطوابير لا بالطلب. وعندما تريد شرح طبقة القياس الخام بمفردها، ابدأ من عدّ الأشخاص؛ وعندما تريد رؤيته مطبقاً من البداية إلى النهاية في متجر، احجز عرضاً توضيحياً واحضر معك سؤالاً حقيقياً واحداً.
تحليلات عملاء التجزئة والخصوصية
لا تتطلب تحليلات عملاء التجزئة معرفة هوية أي شخص. تعدّ مستشعرات V-Count وتصنّف بشكل مجهول: تعالج ما تراه على الجهاز وتمرر أرقاماً لا هويات. لا يُستخدم التعرف على الوجوه، ولا تُخزّن صور المتسوقين للتعرف عليهم، ولا يُتتبع أي زائر بين المتاجر أو بين الزيارات.
- عدّ مجهول الهوية. تُنتج الدخولات والخروجات وزيارات المناطق ومدة البقاء كأعداد مجمّعة. ولا يوجد ملف شخصي وراء أي سطر في التقرير.
- معالجة على الجهاز. يحدث الاكتشاف على مستشعر Nano. وما يغادر المتجر هو بيانات أعداد لـ BoostBI، ما يُبقي أثر البيانات صغيراً.
- GDPR والقواعد المحلية. لأن المخرجات مجهولة ومجمّعة، صُمم النشر ليتوافق بسهولة مع توقعات GDPR. ولا تزال اللافتات وإعدادات الاحتفاظ واتفاقية معالجة البيانات جزءاً من التعميم السليم، ويجب أن يعتمد فريقك القانوني كليهما.
- تركيبة سكانية دون هوية. التعرف على العمر والجنس ينتج سمات جماعية تقديرية لقياس الجمهور، لا أفراداً معروفين.
- احتفاظ تتحكم فيه. احتفظ فقط بالسجل المجمّع الذي تحتاجه للمقارنة السنوية واجعل كل ما عداه ينتهي.
الفائدة العملية هي أن الخصوصية والقياس يتوقفان عن التنافس. يمكن لتاجر التجزئة تشغيل تحليلات الواجهات الكاملة والخرائط الحرارية للمناطق وقياس الطوابير عبر شبكة كاملة مع القدرة على إخبار العميل بصدق أنه لا يُتعرّف على أحد في المتجر.
من السؤال الأول إلى مواصفات واضحة
قارن احتياجات القياس ومواصفات الطرازات والدعم.
افهم المارة ودخولات المتجر ومقام معدل الالتقاط.
طابق إجماليات المعاملات مع الزيارات المؤهلة وفترات التقارير.
حدّد المناطق الفعلية وتغطية المستشعرات واختبار تحقق مفيداً.
لتخطيط النشر، راجع مع V-Count متطلبات الطاقة والشبكة الخاصة بكل طراز وتدفقات البيانات وصلاحيات الوصول وشروط الاحتفاظ. وميزات المعالجة على الجهاز لا تحدد بمفردها الالتزامات التنظيمية للمؤسسة.