حلول إدارة الطوابير وقياسها
نظرة عامة
ودّع الطوابير الطويلة
قلّل الوقت الذي يقضيه عملاؤك في الانتظار عند الصناديق لرفع رضاهم وزيادة المبيعات.
جديد على هذا المجال؟ يشرح دليل شراء نظام إدارة الطوابير الطوابير الخطية والافتراضية والقائمة على التذاكر والقائمة على الحسّاسات، والمؤشرات المهمة، وكيف يعمل التسعير.

عدّ الطوابير وتنبيهات في الوقت الفعلي
تجنّب المغادرة وضياع المبيعات.
- حسّن توزيع الموارد بمواءمة عدد الموظفين ونسبة العملاء إلى الموظفين مع ساعات الذروة.
- قلّل أوقات الانتظار وامنع مغادرة العملاء.
- ارفع رضا العملاء وولاءهم بتحسين كل خطوة في رحلة التسوق.
احجز عرضًا توضيحيًا الآن لتعظيم إمكانات أعمالك:
ما هو نظام إدارة الطوابير؟
قصر الطابور وزمن الانتظار عند الصندوق عاملان أساسيان لتحسين تجربة العملاء وتشجيع الإنفاق. فواحد من كل ثلاثة عملاء محتملين يغادر المتجر إذا اضطر إلى الانتظار أكثر من 5 دقائق للدفع، وقد يخسر تجار التجزئة ما يصل إلى 45% من الإيرادات بسبب الطوابير الطويلة.
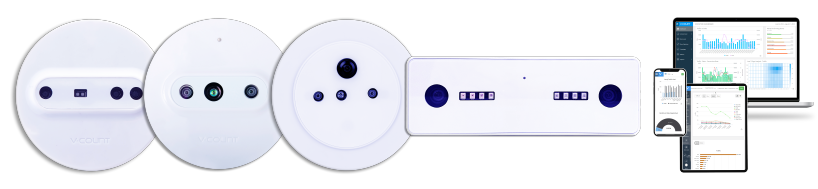
يقلّل نظام إدارة الطوابير الذكي من V-Count الوقت الذي يقضيه العملاء في طوابير الصناديق لتقديم خدمة أكثر فعالية وزيادة المبيعات.
فوائد نظام إدارة الطوابير
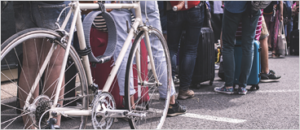
تقليل أوقات الانتظار
احسب متوسط الوقت الذي يقضيه عملاؤك في طوابير الصناديق وعدد من يغادرون، لتحديد الطول الأمثل للطابور وتقليل أوقات الانتظار.
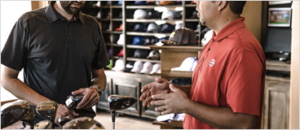
تحسين توزيع الموظفين
تجنّب ازدحام طوابير الصناديق بفتح صناديق أكثر أو أقل وتوزيع موظفيك حسب ساعات الذروة أو الهدوء لتجربة عملاء أفضل.

القضاء على المغادرة
امنع المغادرة بتقليل وقت انتظار العملاء عند الصناديق لتحسين رضاهم وتجنب خسائر الإيرادات.

زيادة ولاء العملاء
قدّم خدمة عملاء استثنائية وحسّن كل خطوة في رحلة التسوق عبر تطوير عمليات الدفع لرفع رضا العملاء وولائهم.
القطاعات التي نخدمها
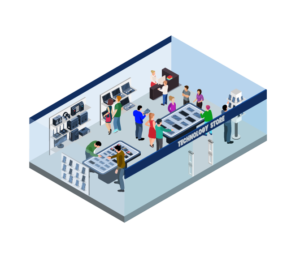
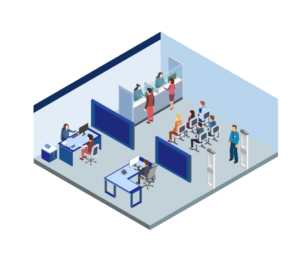
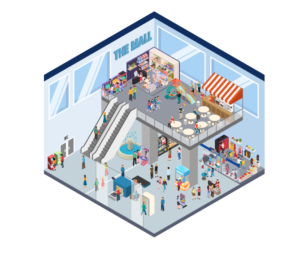
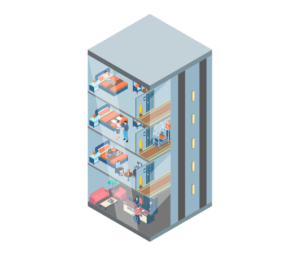
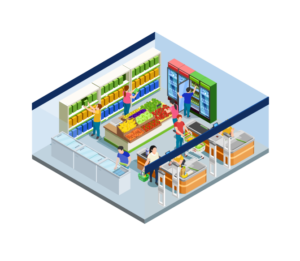
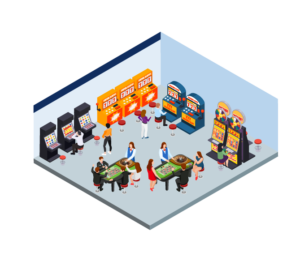
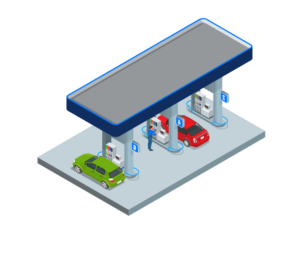

إدارة الطوابير حسب القطاع
لكل مكان طريقته في الاصطفاف، لذا يتغير المؤشر المهم بتغير المبنى. فيما يلي شكل إدارة الطوابير في كل قطاع نعمل معه، والمنطقة التي تغطيها الحسّاسات، والرقم الذي يحدد ما إذا كان الطابور تحت السيطرة.
إدارة الطوابير في البنوك
تُقيّم إدارة الطوابير في فروع البنوك برقم واحد: كم ينتظر العميل قبل الوصول إلى الصرّاف أو المستشار. تعدّ الحسّاسات المركّبة فوق طابور الصرّافين ومنطقة انتظار المستشارين الأشخاص داخل كل منطقة باستمرار، فيعرض BoostBI متوسط زمن الانتظار وأقصاه وطول الطابور وزمن الخدمة لكل شباك. ولأن الحسّاس يراقب المنطقة لا التذكرة، فإنه يلتقط أيضًا العملاء الذين ينضمون إلى الطابور ثم يترددون ويغادرون، وهو معدل المغادرة الذي لا يراه معظم مديري الفروع. وتنبّه حدود التنبيه المشرف لفتح شباك آخر بينما لا يزال الطابور قصيرًا. تعرّف على كيفية نشر ذلك في الفروع عبر صفحة تحليلات فروع البنوك.
إدارة الطوابير في الكازينوهات
تركّز إدارة الطوابير في الكازينوهات على المكانين اللذين يستسلم فيهما الضيوف أسرع: خزينة الصرف ومدخل البوفيه. تقيس الحسّاسات العلوية فوق طابور الخزينة ومنصة استقبال المطعم طول الطابور وزمن الانتظار ومدة خدمة كل ضيف، بينما يمنح VCare مشرفي الصالة عددًا فوريًا لكل منطقة. وفي عطلة نهاية أسبوع مزدحمة تُظهر البيانات بدقة متى يغطي شباك خزينة ثالث تكلفته، وإلى أي حد امتد انتظار البوفيه قبل أن يعود الضيوف إلى صالة اللعب. وتجعل الأسقف العالية والإضاءة الخافتة حسّاسات Nano Prime المجسّمة ثلاثية الأبعاد الخيار المعتاد هنا. المزيد في صفحة تحليلات الكازينوهات.
إدارة الطوابير في الرعاية الصحية
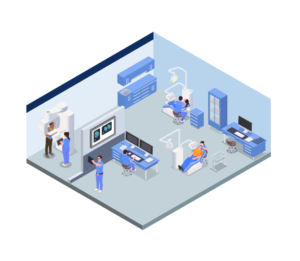
تتعلق إدارة الطوابير في الرعاية الصحية بالغرف أكثر من الطوابير: مناطق انتظار العيادات الخارجية، ومكاتب التسجيل، وشباك الصيدلية. تعدّ الحسّاسات فوق كل منطقة انتظار الإشغال باستمرار، فتعرف عدد المرضى المنتظرين، ومتوسط الوقت بين الوصول والنداء، والساعات التي تتجاوز فيها الغرفة سعتها المريحة. ويحصل استلام الأدوية على منطقة طابور خاصة لأنه يتصرف بشكل مختلف تمامًا عن تدفق العيادات. وتستخدم الفرق العرض الفوري لنقل الموظفين بين التسجيل والفرز قبل امتلاء الغرفة، والسجل لإعادة تصميم كتل المواعيد. وتغطي صفحة عدّ الأشخاص في الرعاية الصحية الإعداد الكامل.
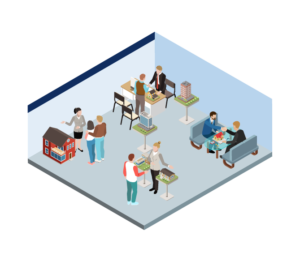
إدارة الطوابير في المتاحف
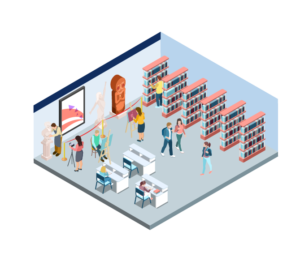
عادةً ما تتعثر إدارة الطوابير في المتاحف عند مكتب التذاكر وغرفة المعاطف، قبل أن تبدو القاعات مزدحمة بوقت طويل. تقيس الحسّاسات فوق قاعة التذاكر وبوابة الدخول عدد الزوار في الطابور ومدة انتظارهم ومقارنة ذلك بفترات الدخول المحددة التي بيعت فعلًا. فإذا كانت فترة الحادية عشرة تُنتج بانتظام طابورًا مدته عشرون دقيقة، فالفترة هي المكتظة لا المتحف. كما يتيح عدّ طابور المدخل منفصلًا عن إشغال القاعات حجز سعة للأعضاء والمجموعات المدرسية. واجمع بيانات الطابور مع مدة البقاء لتخطيط التوظيف ساعة بساعة. راجع صفحة المكتبات والمتاحف.
إدارة الطوابير في المطارات
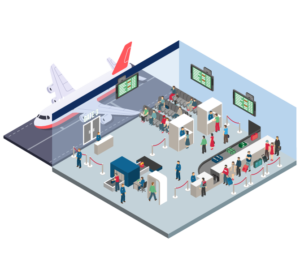
تُقاس إدارة الطوابير في المطارات نقطة تفتيش بنقطة: صفوف تسجيل الوصول، وتسليم الأمتعة، ومسارات التفتيش الأمني، ومراقبة الجوازات، وبوابات الصعود. تعدّ الحسّاسات فوق كل منطقة طابور المسافرين المنتظرين وتحسب التدفق لكل مسار، فتنشر العمليات زمن انتظار مقاسًا على الشاشات وتفتح مسارًا قبل أن يصل الطابور إلى ممر المبنى. ولأن أسقف كثير من المطارات عالية جدًا وبعض الطوابير تتكوّن خارج الأبواب، يُنشر Nano Prime وNano Outdoor معًا في الغالب. ويحتفظ BoostBI بالسجل لتُظهر لشركة طيران أو جهة تنظيمية عدد المرات التي التزمت فيها بمستوى الخدمة المتفق عليه. وتضم صفحة تحليلات المسافرين في المطارات تفاصيل النشر.
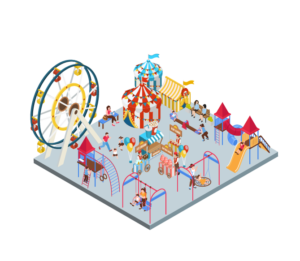
إدارة الطوابير في المدن الترفيهية
إدارة الطوابير في المدن الترفيهية هي تجربة الضيف نفسها. تعطي الحسّاسات عند مدخل كل طابور لعبة ومخرجه عددًا فوريًا للأشخاص في الطابور، وقسمته على التدفق الحالي تنتج زمن انتظار معلنًا مقاسًا لا مخمّنًا. ويمكن للتغذية نفسها تشغيل تطبيق طابور افتراضي، فيحجز الضيوف مكانهم دون الوقوف فيه. وتحتاج الممرات المتعرجة الخارجية إلى أجهزة مقاومة للطقس، وهنا يأتي دور Nano Outdoor، وتراقب عمليات المدينة كل لعبة على لوحة واحدة ليذهب الموظفون إلى أسوأ طابور أولًا. اقرأ المزيد في صفحة تحليلات المدن الترفيهية.
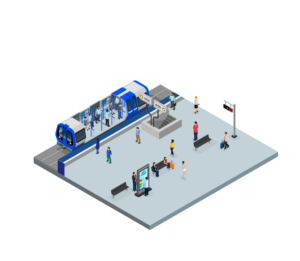
إدارة الطوابير في النقل
تغطي إدارة الطوابير في النقل مكاتب التذاكر ومكاتب المعلومات وبوابات الدخول وازدحام الصعود على الرصيف. تعدّ الحسّاسات فوق قاعة التذاكر الركاب المنتظرين وسرعة انصراف الطابور بعد كل وصول، بينما تُظهر حسّاسات الرصيف كيف يتوزع الركاب على طول القطار لترى أي العربات تكتظ. وبالنسبة لمشغّلي المحطات، فالأرقام الحاسمة هي زمن الانتظار عند شباك التذاكر، والمغادرة عند آلات الخدمة الذاتية، وإشغال الرصيف مقارنة بحد سلامة يطلق تنبيهًا فوريًا في غرفة التحكم. راجع صفحة تحليلات النقل للمحطات ومحطات الحافلات وموانئ العبّارات.
إدارة الطوابير للفعاليات
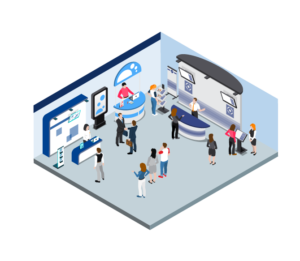
تُحسم إدارة الطوابير في الفعاليات خلال التسعين دقيقة الأولى. تُظهر الحسّاسات على بوابات الدخول ومكاتب التسجيل عدد الحضور المنتظرين في كل مسار، فتفتح ماسحات إضافية بينما لا يزال الطابور يتكوّن بدل أن يفيض إلى موقف السيارات. وتغذي الأعداد نفسها الإشغال الفوري لكل قاعة، وهو ما يريد المكان وضابط الإطفاء رؤيته. وبعد ذلك يستخدم المنظمون سجل الطوابير للتفاوض على توظيف البوابات للدورة التالية وإثبات تدفق الدخول للعارضين. وتشرح صفحة الفعاليات والمعارض طريقة النشر.
قياس الطوابير في السوبرماركت ومتاجر التجزئة
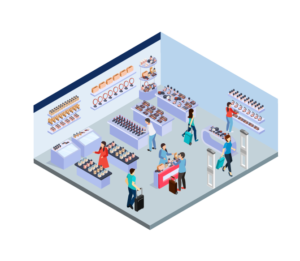
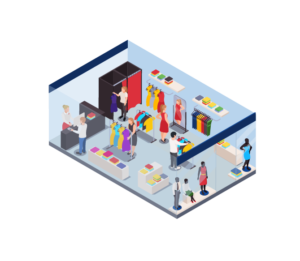
يبدأ قياس الطوابير في السوبرماركت عند صف الصناديق: حسّاس فوق منطقة الدفع يعدّ المتسوقين المنتظرين، وكيف ينمو الطابور مقارنة بعدد المسارات المفتوحة، وكم مرة يخالف المتجر قاعدته الخاصة لعدد الأشخاص في الطابور. ويعمل قياس الطوابير في متجر أصغر بالطريقة نفسها عند نقطة دفع واحدة، ويقترن طبيعيًا بحركة المتجر لترى التحويل ينخفض مع طول الطابور. ويتلقى المديرون تنبيهًا لاستدعاء زميل إلى الصندوق قبل ترك سلة. راجع صفحة تحليلات السوبرماركت وصفحة تحليلات متاجر التجزئة لمعرفة المؤشرات التي يتتبعها كل نوع.
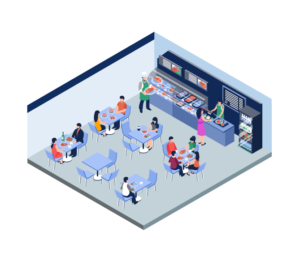
إدارة الطوابير في المراكز التجارية
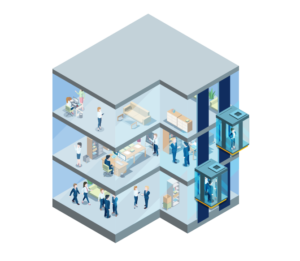
إدارة الطوابير في المراكز التجارية مشكلة للمالك بقدر ما هي للمستأجر: مكاتب ساحة الطعام وشبابيك السينما وخدمة الضيوف ومخرج الموقف تصطف كلها في ساعات مختلفة. وتمنح الحسّاسات في كل من هذه المناطق إدارة المركز رؤية واحدة لأماكن انتظار الزوار ومدته، فيُنقل موظفو التنظيف والأمن والمعلومات إلى نقطة الضغط. ويستفيد المستأجرون أيضًا، فمطعم لا ينصرف طابوره أبدًا يصبح نقاش تأجير مدعومًا بالبيانات. واجمع ذلك مع حركة المركز كله لتفسير سبب بلوغ الانتظار ذروته بعد ظهر السبت. وتضم صفحة تحليلات المراكز التجارية التفاصيل.
إدارة الطوابير في مراكز السبا
نادرًا ما تعني إدارة الطوابير في السبا طابورًا طويلًا؛ بل تعني ضيفًا جالسًا في الاستقبال بعد موعده. تعدّ الحسّاسات فوق منطقة الاستقبال وصالة الاسترخاء عدد الضيوف المنتظرين ومدة انتظارهم، فتتحول الشكوى الغامضة إلى تأخير مقاس لكل معالج وغرفة علاج. وتُبقي أعداد الإشغال في الصالات والمناطق الرطبة هذه المساحات ضمن سعتها المريحة، وهو المقياس الحقيقي للفخامة. ولأن الأرقام لكل منطقة ولكل ساعة، يستطيع المدير معرفة ما إذا كان ازدحام السادسة مساءً مشكلة في جدول الحجوزات أم في التوظيف. راجع صفحة مراكز السبا والعافية.
قياس الطوابير مقابل إدارة الطوابير
قياس الطوابير هو نصف الاستشعار: عدّ الأشخاص الواقفين في منطقة الطابور، ومدة انتظارهم، وعدد مرات مغادرتهم. أما إدارة الطوابير فهي ما تفعله بهذه المعلومات، سواء كان فتح صندوق أو استدعاء موظفين أو تقييد فترة دخول أو التحول إلى طابور افتراضي. تدير أنظمة موزعات التذاكر الطوابير دون قياس أي شيء يحدث قبل سحب التذكرة، بينما يقيس العدّ بالحسّاسات الجميع، بمن فيهم العملاء الذين لا ينضمون أبدًا. ومعظم المواقع تحتاج إلى النصفين، ولهذا تغذي حسّاسات V-Count مؤشرات الطوابير في BoostBI إلى جانب بيانات عدّ الأشخاص والإشغال الفوري من VCare. ويقارن دليل شراء نظام إدارة الطوابير النهج ونماذج الاصطفاف وكيفية بناء التسعير.

اشترك في نشرتنا الإخبارية
في بيئة أعمال سريعة التغير، لم يعد البقاء على اطلاع مفيدًا فحسب، بل ضرورة. اشترك لتبقى في طليعة المعرفة في قطاع تحليلات الزوار.