


















معارض السيارات
Car showroom analytics turns a dealership floor into numbers you can act on: how many people came through the doors, which vehicles they walked up to, how long they stayed beside each model, and how many of those visits became test drives and signed orders. V-Count sensors sit above the showroom entrances, over the forecourt and across every display zone, counting anonymously and excluding staff so the figures describe real prospects. In BoostBI a manager sees the visit-to-test-drive-to-sale funnel, dwell per model display, visitors per sales consultant per hour and live occupancy in the service reception. Quiet Tuesdays and packed launch weekends stop being anecdotes and start being staffing, layout and marketing decisions.
استكشف المعرض الذي يُبرز مجموعتنا المتنوّعة من العملاء. نفخر بالعمل مع هذه العلامات التجارية الرائدة، مقدّمين حلول تحليلات الزوّار التي تدفع نجاحها.


فوائد تحليلات الزوّار لمعارض السيارات

تُعدّ حلول عدّ الأشخاص تقنيةً غيّرت قواعد اللعبة لمعارض السيارات، إذ تقدّم ثروة من الفوائد لتحسين العمليات والارتقاء بتفاعل العملاء. فبيانات حركة الزوّار في الوقت الفعلي والرؤى حول سلوك الزوّار تمكّن مديري المعارض من اتخاذ قرارات مدروسة. فعلى سبيل المثال، عندما تجذب أيام أو فترات زمنية محدّدة عددًا أكبر من الزوّار، يمكن للوكلاء توزيع الموارد والموظفين استراتيجيًا، بما يعزّز رضا العملاء في نهاية المطاف وقد يرفع المبيعات.
ومن خلال المراقبة الدقيقة لتقلّبات حركة الزوّار قبل تنفيذ الحملات الجديدة وبعده، يمكن للوكلاء تقييم أثر حملاتهم وعروضهم الترويجية بدقة. ويسهّل هذا النهج المبني على البيانات التحسين المستمر للاستراتيجيات التسويقية، وتوجيه الموارد نحو الأساليب المثبتة، وتعزيز العائد الإجمالي على الاستثمار.
إضافةً إلى ذلك، يوفّر إجراء تحليل الاتجاهات المصمّم لكل موقع معرض رؤى قيّمة. ففهم الاتجاهات السائدة ومقارنة الأداء بمعارض السيارات الأخرى، محليًا ووطنيًا، يمكّن الوكلاء من التكيّف بفعالية مع ديناميكيات السوق المتغيّرة.
ولا يؤدي تطبيق عدّ الأشخاص في معارض السيارات إلى تحسين التصاميم والحملات والعمليات فحسب، بل يسهم أيضًا في زيادة معدلات التحويل ونموّ الإيرادات نتيجةً لكل ذلك.
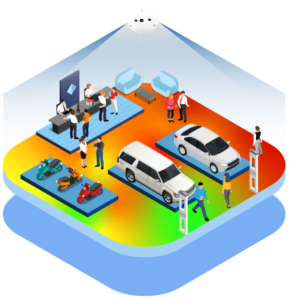
يقدّم دمج الخريطة الحرارية من Nano Prime وحلول تفاعل المنتجات من Pick and Sense فوائد رائعة لمعارض السيارات، بما يسهم في بيئة أكثر جاذبية وكفاءة.
تتيح الاستفادة من قوة تحليلات الخرائط الحرارية تحليل أنماط الحركة داخل المعرض. وتوجّه هذه البيانات القيّمة المبنية على مدد بقاء زوّار المعرض الوكلاءَ في تحسين التصميم استراتيجيًا، بما يتيح إعادة ترتيب المركبات والمعروضات الترويجية بناءً على النقاط الأكثر جذبًا للزوّار. ومن خلال مواءمة العروض الرئيسية مع مناطق التفاعل العالي للزوّار، يمكن للمعارض تعزيز ظهور سيارات وعروض محدّدة وجاذبيتها بشكل كبير، مما يزيد فرص نجاح التحويلات.
تتبُّع تفاعل المركبات: مع تقنية Pick and Sense، تصبح المراقبة الفورية لتفاعلات العملاء مع المركبات حقيقةً واقعة. فيمكن للوكلاء تتبُّع مدى تكرار تفاعل العملاء مع السيارات، وتحديد ميزات السيارة التي تجذب أكبر قدر من الاهتمام. ومن خلال معرفة أبواب السيارات الأكثر فتحًا من قِبل زوّار المعرض، يمكن للوكلاء تكييف استراتيجياتهم لإبراز الميزات الرائجة وتعزيز تجربة المعرض بشكل عام. ويؤدي هذا النهج المبني على البيانات إلى اتخاذ قرارات أكثر استنارة ومستوى أعلى من تفاعل العملاء، مما يؤدي إلى زيادة تحويل المبيعات.
أهمية عدّ الأشخاص في معارض السيارات
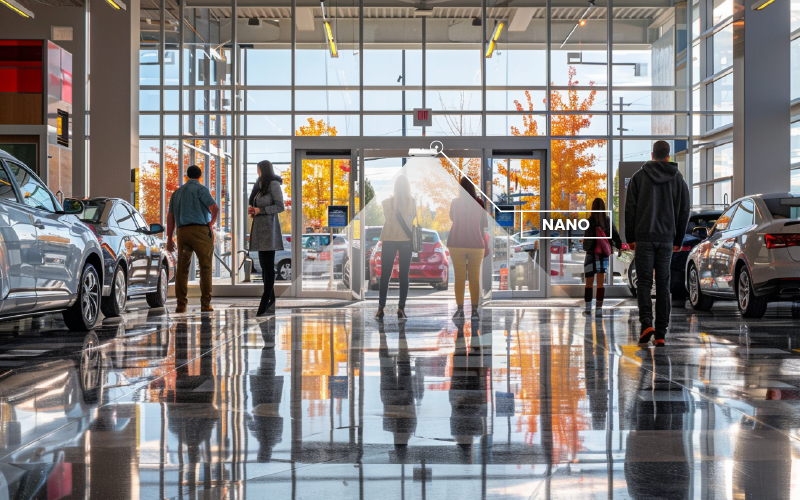
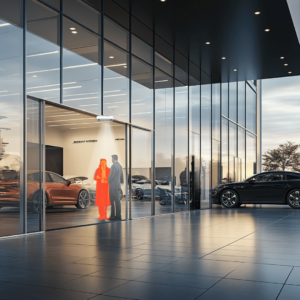
نركّب Nano عند مداخل معرض السيارات لعدّ الزوّار، بما يضمن حصولك على بيانات دقيقة حول حركة العملاءحتى تتمكّن من قياس تحويل متجرك.تضمن ميزة استبعاد الموظفين الرائدة في السوق لدينا أن تعكس البيانات أعداد العملاء الصافية عبر استبعاد الموظفين من العدّ، بما يتيح تحليلًا دقيقًا لزيارات العملاء.

بوضع Nano أعلى المركبات، يمكننا عدّ عدد مرات فتح صندوق السيارة بدقة.
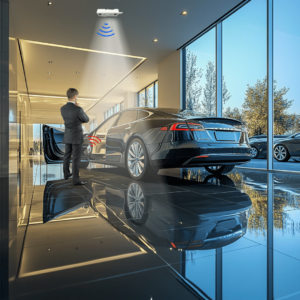
تتيح لك هذه البيانات مقارنة تفاعلات العملاء مع المركبات بعدد وصول العملاء اليومي، مما يوفّر رؤى أعمق حول الطرازات التي تجذب أكبر قدر من الاهتمام والتفاعل،بما يساعدك على قياس تحويل زيارة السيارة.
توفّر تقنية Pick and Sense لدينا معلومات تفصيلية حول مدى تكرار فتح أبواب المركبات.
وهذه البيانات لا تُقدَّر بثمن لفهم تفاعل العملاء مع طرازات السيارات المختلفة،بما يساعدك على قياس تحويلات التفاعل مع السيارة،وتحديد الميزات الرائجة، والتركيز على المجالات المحتملة للمبيعات.
Car showroom analytics: what to measure
Car showroom analytics is the practice of measuring everything that happens between the front door and the signed order form. A dealership sells a handful of cars from hundreds of visits, so the most valuable numbers in a showroom are not the sales totals — they are the steps that lead to them. These are the metrics worth instrumenting in a showroom, a forecourt and a service department:
- Showroom visitors, with staff excluded. A car showroom people counter above each entrance gives a clean count of prospects. Sales consultants, valets, service advisors and delivery drivers cross the door line dozens of times a day, and staff exclusion is what separates a usable footfall figure from noise.
- The showroom funnel: visits → test drives → sales. Counted entries give you the top of the funnel that a CRM never sees, because nobody logs the visitor who browsed for ten minutes and left. Put the door count next to test-drive bookings and delivered units and you finally have two real conversion rates instead of one guess: visit-to-test-drive and test-drive-to-sale.
- Dwell time per vehicle and per model display. Zone counting around each display bay shows which cars people actually walk up to and linger beside — the flagship in the window, the used stock at the back, the EV bay you invested a launch budget in. Attention is the earliest sales signal you can measure, and it arrives weeks before the order book moves.
- Visitors per sales consultant per hour. Divide hourly showroom traffic by the consultants on shift and you get a coverage ratio. When that ratio spikes on Saturday afternoon, prospects are walking the floor unattended; when it collapses on Tuesday morning, you are paying for coverage nobody is using.
- Service reception and waiting-lounge occupancy. Service is a second, separate flow with its own morning drop-off surge. Counting the reception desk and the customer lounge tells you when advisors are overwhelmed, how long people sit waiting, and whether the lounge is sized for the traffic it actually receives.
- Peak patterns: weekends, evenings and launch events. Showroom demand is spiky. A model launch, a weekend finance offer or a local motor event can multiply a normal day’s traffic for a few hours. Hour-by-hour history turns those spikes into a staffing roster instead of a surprise.
- Site-by-site benchmarking across the dealer group. Once every site counts the same way, a group can compare showrooms fairly: traffic per site, conversion per site, dwell per model per site. Differences that looked like “a better market” often turn out to be a difference in coverage or layout you can copy.
Where the sensors go in a car showroom
A showroom is a large, bright, glass-walled room with very few doors and a lot of open floor, so sensor placement is different from a high-street shop. A typical V-Count layout looks like this:
- Main entrance and customer doors. A Nano AI sensor mounted overhead works as the car showroom footfall counter: it counts people in and out bidirectionally, ignores the same person loitering in the doorway, and excludes staff so the entry figure is prospects only.
- Display zones around each vehicle. The same indoor sensors, configured as zones, report presence and dwell around individual cars and model groups. Combined with heatmap and zone analytics this is what tells you which stand draws a crowd and which corner of the floor people never reach.
- Atriums, mezzanines and dark glass frontages. Showrooms often have five- or six-metre ceilings and strong backlight from the glazing. Nano Prime, a 3D stereo-vision sensor, is designed for exactly those high-mount and difficult-light conditions.
- Forecourt, used-car lot and outdoor display. A large share of dealership browsing happens outside, often after hours. Nano Outdoor is built for weather-exposed positions and brings the lot into the same count as the showroom floor.
- Service reception, waiting lounge and handover bay. VCare shows live occupancy on a screen or feeds a threshold alert, so a full lounge or a queue at the service desk is visible the moment it forms rather than in next month’s report. Where people wait in line at a service desk or finance office, queue management adds waiting-time measurement on top of the count.
- Everything reports into BoostBI. Counts, zone dwell, occupancy and conversion land in one cloud dashboard with per-site and group-level views, scheduled reports and alerts, so a dealer principal and a single-site manager look at the same numbers.
All of it is anonymous counting. The sensors process images on the device and output numbers — entries, exits, dwell, occupancy — not identities. No faces are stored, nobody is recognised or followed between visits, and the data a showroom manager sees is a count, which keeps the deployment straightforward under GDPR-style privacy rules. If you want the fundamentals first, start with people counting.
How dealerships use car showroom customer analytics
Numbers only matter when they change a decision. These are the decisions car showroom customer analytics actually drives:
- Rostering the sales floor. Hourly traffic curves, not habit, decide how many consultants are on shift on a Saturday, during Thursday late-night opening, and in the dead first hour of a Monday. Coverage ratios show where an extra body earns its cost.
- Placing the metal. If the new model sits in a bay people walk past on the way to the coffee machine, dwell will say so. Showrooms rearrange display order, turn cars towards the natural entry path, and move slow stock into high-traffic zones based on where feet and attention actually go.
- Judging campaigns and events honestly. A radio campaign, a finance offer or a weekend launch event can be measured as incremental visitors against a normal-week baseline, then followed down the funnel into test drives. Attribution stops being a debate about which lead source ticked a box and becomes a traffic comparison.
- Sizing the service department. Reception occupancy by hour tells you when to add an advisor to the drop-off rush and whether the waiting lounge needs more seats or a faster loaner process.
- Setting fair targets across a dealer group. A site with half the traffic should not carry the same unit target. Traffic-adjusted targets, and conversion league tables between sites, replace volume-only comparisons.
- Proving the quiet wins. Longer dwell, better coverage and higher visit-to-test-drive conversion show up in the data long before they show up in registrations, which gives a general manager something to manage weekly instead of monthly.
Want to see the funnel against your own showroom layout? Request a demo and we will walk through a sample dealership dashboard.
Car showroom people counting FAQ
What is car showroom analytics, and what does it measure?
Car showroom analytics is the measurement of visitor behaviour inside a dealership: how many people enter the showroom, which vehicles and zones they stop at, how long they stay, how busy each hour is, and how many of those visits turn into test drives and sales. It is collected by overhead sensors at the doors and around display areas rather than by staff tallies or CRM entries. V-Count sensors feed counts, dwell and occupancy into BoostBI, where a showroom manager sees traffic, zone dwell and conversion for one site or for a whole dealer group.
How do I connect showroom visitors, test drives and sales into one funnel?
Start with an accurate door count, because that is the only number a dealership normally does not have. Once every entry is counted with staff excluded, you can divide test-drive bookings by showroom visits to get a visit-to-test-drive rate, and delivered units by test drives to get the closing rate. V-Count supplies the traffic side of that funnel per hour, day and site; you pair it with the test-drive and sales figures you already record. Suddenly a fall in sales is traceable: fewer people came in, or the same number came in and fewer were converted.
How do I find out which cars on the display floor draw the most attention?
Configure each display bay as a counting zone. The sensors report how many people entered that zone and how long they stayed, so every vehicle or model group gets its own traffic and dwell figure. Compare bays over a week and the pattern is unambiguous: the cars that hold people, the cars people glance at, and the corners of the floor nobody reaches. Dealerships use this to re-order the display, reposition slow stock into high-traffic zones, and prove to a manufacturer that a launch car is or is not getting attention.
How many visitors should one sales consultant cover?
There is no universal number — it depends on your sales process and how long a typical conversation takes — but you can measure it. Divide counted showroom visitors in each hour by the consultants rostered for that hour to get a coverage ratio, then look at what happens to conversion as the ratio rises. Most showrooms find a threshold above which visit-to-test-drive conversion falls because prospects are waiting or leaving unattended. BoostBI charts traffic by hour so you can set the roster against the ratio instead of against tradition.
Can I measure occupancy in the service reception and waiting lounge too?
Yes, and it is usually the fastest win in a dealership. The service side has its own rhythm, with a heavy drop-off surge early in the morning and a collection peak late in the day. A sensor over the reception area and the customer lounge gives live occupancy, and VCare can display it or trigger an alert when the lounge fills. Over time you get hour-by-hour occupancy that shows when to add an advisor, whether the lounge is sized correctly, and how long customers are actually sitting there.
How do I count visitors on an outdoor forecourt or used-car lot?
Use weather-rated sensors. Nano Outdoor is designed for exposed positions and covers forecourt entrances, lot walkways and outdoor display rows, including out-of-hours browsing when the showroom itself is closed. Those counts join the indoor data in BoostBI, so a dealership can see total site traffic rather than only the people who pushed the showroom door. That matters for used-car operations especially, where a large share of looking happens outside and never registers as a showroom visit at all.
What is the difference between a car showroom people counter and a car showroom footfall counter?
In practice they describe the same hardware: an overhead sensor at the entrance that counts people in and out. “Footfall counter” is the retail term for total entries, while “people counter” is used more broadly and often implies the extra capabilities — staff exclusion, occupancy, zone dwell and group counting. A car showroom needs all of it, because entries alone will not tell you which vehicles held attention or how many prospects a consultant was covering. V-Count sensors do both jobs from the same device.
الأسئلة الشائعة
تحديث المرجع: 2026-09-18