الاتصالات
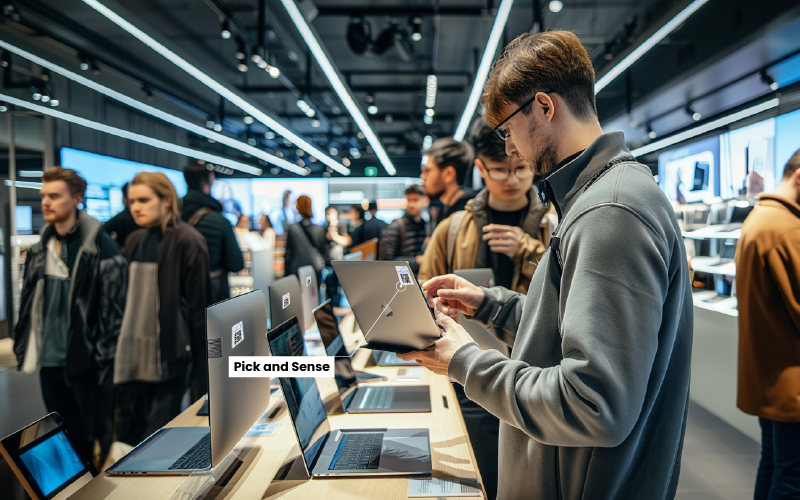
A telecom store people counter turns the door of every branch into a measurable step in the sales funnel. Mobile operator stores are consideration environments: visitors compare handsets, ask about tariffs and wait at the service desk, and only a fraction of them leave with an activation or an upgrade. V-Count sensors count everyone who enters, keep staff out of the total, time the queue at the bill-pay and repair counters, and map dwell at device tables and the accessory wall. BoostBI turns that into store conversion, advisor-to-visitor ratio and hourly traffic curves you can compare across a network of hundreds of stores – anonymously, with no images of faces stored and no personal data collected.
استكشف المعرض الذي يُبرز مجموعتنا المتنوّعة من العملاء. نفخر بالعمل مع هذه العلامات التجارية الرائدة، مقدّمين حلول تحليلات الزوّار التي تدفع نجاحها.


















فوائد تحليلات الزوّار لقطاع الاتصالات
The entrance count is the foundation of every telecom store metric. A sensor over the door records how many people came in, hour by hour, with staff filtered out, so a branch can finally divide its contracts, activations and upgrades by the number of customers it actually had. That is store conversion, and it is what makes a mall kiosk comparable with a high-street flagship. The same hourly curve drives advisor rotas, break scheduling and launch-day planning.
Storefront counting measures the people who pass your window but never come in. Comparing passing traffic with entries gives capture rate – the share of mobile phone store footfall your window, display and promotion actually convert into a visit. It is the number that separates a location problem from a merchandising one, and it is the evidence estate teams bring to a mall rent review or a decision between a corridor unit and a high-street site.
Telecom retail runs one of the highest staff-to-customer ratios in retail, and on a quiet morning advisors can outnumber customers on the floor. Staff exclusion filters employees out of the counted totals so that conversion, dwell and queue figures describe customers only. Without it, advisors moving between the floor, the stockroom and the repair bench inflate the count enough to make every downstream KPI unusable. In a telecom store this is essential, not optional.
Zone analytics and heatmaps show where attention goes inside the store: which handset table holds visitors, which flagship display is walked past, and whether anyone stops at the accessory wall that carries the margin. Dwell time per zone tells you what to move, what to demo and where to place an advisor. Around the service desk, the same zone data becomes queue length and wait time at the bill-pay and repair counters.
Telecom store people counting: what to measure
Telecom retail has a measurement gap that most other store formats do not. A supermarket reads its own traffic through basket counts; a mobile operator store can serve fifty visitors in an afternoon and write twelve contracts, because most of the visits are questions, bill payments, SIM swaps and repairs that never produce a transaction line. Without a telecom retail people counter at the door, the denominator simply does not exist, and every conversion number in the business is a guess. These are the metrics a telecom store analytics programme should produce first.
- Store conversion rate – counted visitors divided by contracts, activations, upgrades and device sales for the same hour, day and store. This is the single number that makes a telecom store comparable to every other store in the network, and it is the reason people counting exists in this format.
- Advisor-to-visitor ratio – how many customers each advisor on the floor is expected to handle, hour by hour. A store that looks fully staffed on a headcount report can still be running three visitors per advisor at 17:00 on a Saturday and one per advisor all Tuesday morning.
- Service-desk queue length and wait time – the bill-pay, SIM and repair counters generate the longest waits and the worst reviews in telecom retail. Counting the people standing in the service zone, and how long they stand there, is what queue management in a telecom store actually means.
- Dwell at device tables and the accessory wall – which handset table holds attention, which flagship display is ignored, and whether anyone stops at the cases and chargers that carry the margin. Heatmaps and zone analytics answer this without a single extra question to staff.
- Capture rate – the share of passers-by who actually come in. A mall store measures itself against the footfall in the corridor; a high-street flagship measures itself against the pavement. The same brand can have a great mall capture rate and a poor high-street one, and only mobile phone store footfall measured outside the door will show it.
- Appointment versus walk-in mix – operators that book device set-ups and business consultations need to know what share of the floor is pre-booked and what share simply walks in, because those two flows need different staffing and different waiting space.
- Launch-day and peak-day traffic curves – a new handset release, a tariff promotion or a network outage can multiply a store’s traffic in a single morning. Historical hourly curves from previous launches are the only reliable basis for planning the next one.
Where the sensors go in a telecom store
Telecom stores are small, bright and glass-fronted, and they are usually staffed at a far higher ratio than a comparable clothing or grocery store. Both facts shape the sensor plan. A typical mobile operator branch needs one counting line at the entrance and two to four zones inside; a flagship with a mezzanine, a workshop and a business desk needs more.
- The entrance line. Nano AI mounts above the door and produces the in and out counts that every other telecom store analytics metric is divided by. Because entrances in telecom retail are wide, frameless and often shared with a mall corridor, the counting line has to be drawn deliberately rather than assumed from the door frame.
- The storefront. Counting the people who pass the window, not just the ones who enter, is what produces capture rate. For an outward-facing sensor on a high-street unit or a standalone store, Nano Outdoor is built for the weather and light conditions outside the glass.
- Device tables, the accessory wall and the demo area. These are zones, not doors, and they are where the dwell and heatmap data comes from. Nano Prime 3D stereo covers larger open floors, high ceilings in converted flagship units and areas with strong backlight from a shop window.
- The service desk and repair counter. A zone drawn over the waiting area in front of the bill-pay and repair counters gives live queue size and average wait, which is what triggers a call for a second advisor before the line reaches the door.
- Staff exclusion everywhere. Telecom retail runs one of the highest staff-to-customer ratios in the whole of retail – on a quiet weekday morning the employees can easily outnumber the customers. Without staff exclusion, advisors walking to the stockroom and back inflate the visitor count enough to make conversion meaningless. Excluding staff from the count is not a refinement in this format; it is the difference between usable and useless data.
- Real-time occupancy. Where a branch needs a live headcount on the floor – a launch day with a managed door, a small store with limited seating – VCare shows current occupancy and can drive a display or an alert.
All of it reports into BoostBI, where a regional manager sees one store, a cluster or the whole estate. If you are new to the technology, the people counting hub explains how the sensors and the platform fit together.
How telecom operators use the data
- Staffing the shift to the traffic curve. Telecom store traffic is lumpy – lunchtimes, evenings after work, Saturday afternoons, the first days of the billing cycle. Matching advisor rotas and break schedules to the counted curve, rather than to a flat opening-hours roster, is usually the first change a store makes after installation.
- Planning launch day. When a new handset lands, last launch’s hourly counts tell the store how many advisors to pull in, when to open an appointment-only window, and when the floor is going to hit the point where queue time damages the experience.
- Benchmarking a network of hundreds of stores. Conversion per counted visitor is the only fair league table across a mixed estate of mall kiosks, high-street flagships and franchise branches. It separates stores with a traffic problem, which need marketing or a different location, from stores with a conversion problem, which need coaching or staffing.
- Judging locations and rent. Capture rate against measured passing footfall is the evidence used when a mall unit comes up for renewal, when a franchise partner argues for a better pitch, or when the estate team compares a corridor site with a high-street site.
- Merchandising the accessory wall. Dwell and heatmap data show whether the cases, chargers and audio that carry the margin are in a zone anyone actually stops in, and whether the demo handsets that get attention are the ones the operator wants to sell.
- Protecting the service experience. Wait time at the repair and bill-pay counters, measured rather than estimated, sets the trigger for opening a second position and gives a factual answer when a store is accused of slow service.
- Attributing campaigns. A tariff promotion, a local radio spend or a mall event either moves counted visitors or it does not. Comparing traffic lift with sales lift separates campaigns that brought people in from campaigns that only changed what existing visitors bought.
The same approach applied across the wider store estate is covered on our retail store analytics page, and you can see the telecom setup on your own floor plan in a demo.
Telecom store people counting FAQ
What is a telecom store people counter?
How do you measure conversion rate in a mobile phone store?
Can the system exclude staff from the visitor count?
Does people counting also measure the queue at the service desk?
How do we compare hundreds of stores across a network?
What is capture rate and why does it differ between mall and high-street stores?
How should a store prepare for a device launch day?
Is any personal data collected in the store?
اسمع ما يقوله عملاؤنا من شركات الاتصالات
استكشف قصص شركات الاتصالات التي تستخدم حلولنا لعدّ الأشخاص المدعومة بالذكاء الاصطناعي. تعرّف على كيفية إدارتها لجداول الموظفين لضمانخدمة عملاء من الطراز الأولوتقليل أوقات الانتظار، وكيفتخصّص اتصالاتها التسويقيةلتقييم فعاليتها.
احجز عرضًا توضيحيًا الآن للاستفادة القصوى من إمكانات أعمالك:
الأسئلة الشائعة
تحديث المرجع: 2026-09-18