الخرائط الحرارية وتحليلات داخل المتجر
نظرة عامة
حسِّن رحلة عملائك نحو الشراء
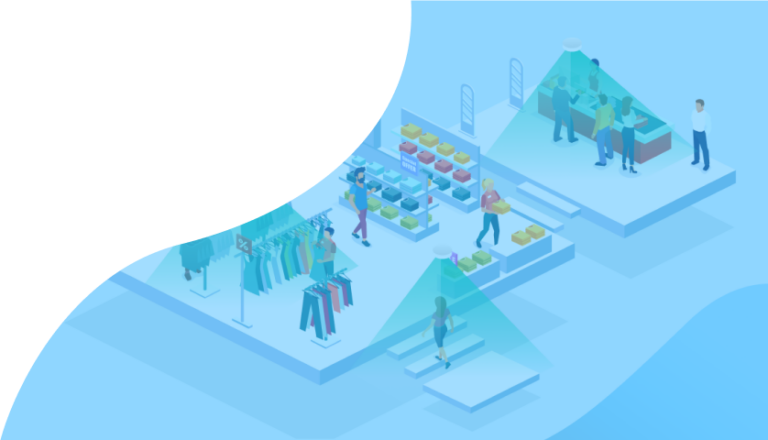
تقنية الخرائط الحرارية التي تعزّز الإيرادات
ربحية أعلى مع التوزيع الأمثل للمنتجات
- حسِّن تصميم متجرك باستخدام رؤى سلوك العملاء بهدفزيادة مدة بقاء العملاء.
- حدِّد المنتجات التي تحظى بأكبر قدر من الاهتمام، ثم وزِّعها استراتيجيًابالشكل الأمثل لزيادة المبيعات.
- حدِّد المناطق الأكثر ازدحامًا وضع فيها استراتيجيًا لافتات الحملات والإعلانات التفاعليةلتعزيز جهودك التسويقية.
احجز عرضًا توضيحيًا الآن لتعظيم إمكانات نشاطك:
ما هي تحليلات المناطق داخل المتجر؟
تتيح البيانات المستمدة من حل تحليلات التجزئة داخل المتجر للشركات فهم مدة بقاء الزوّار، وتعزيز تفاعل العملاء، وتحديد أسباب نجاح أداء المناطق المتميزة، وتطبيق هذه المعرفة على مناطق أخرى لتحقيق أفضل النتائج.
والاستفادة من هذه البيانات تمكِّن تجار التجزئة من اتخاذ قرارات مدروسة تحسِّن تصميم المتجر وتوزيع المنتجات وتوظيف الكوادر، بما يؤدي في النهاية إلى زيادة المبيعات ورضا العملاء.
فوائد تحليلات المناطق
تحسين تصميم المتجر

تحسين توزيع المنتجات
حسّن فعالية التسويق

زيادة رضا العملاء

الإشغال الفوري VCARE
أدِر إشغالك لحظيًّا
تتبّع حركة الزوّار الوافدين وأدِرها بشكل مجهول عبر العرض الرقمي. وراقب مستويات الإشغال عن كثب لتعزيز تجربة العملاء وتتبّع أداء موظفيك.
القطاعات التي نخدمها
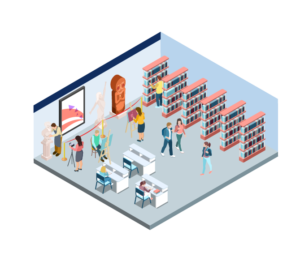
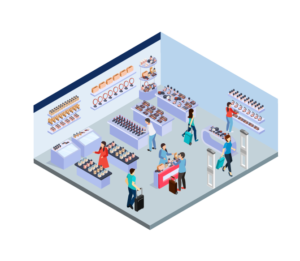
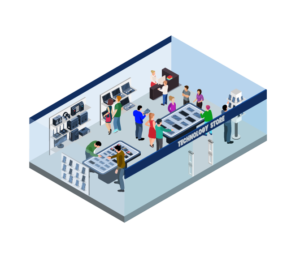


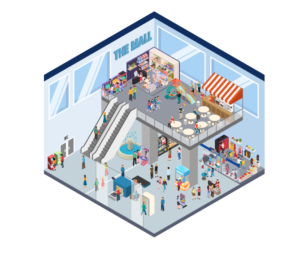
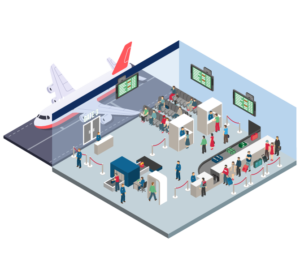
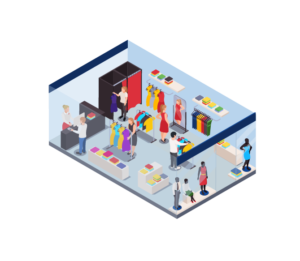

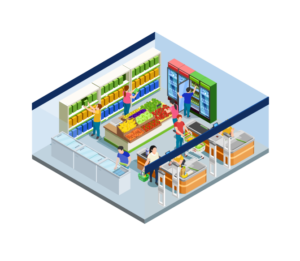





شرح الخرائط الحرارية وتحليلات المناطق في قطاع التجزئة
تحليلات المناطق بالخرائط الحرارية هي ممارسة تحويل الحركة المجهولة الهوية داخل المتجر إلى صورة توضّح أين يذهب المتسوقون، وكم يمكثون، وأي المناطق تحقق التحويل إلى مبيعات. يتناول هذا القسم ما تُظهره الخريطة الحرارية للمتجر فعلًا، وكيف تختلف الخرائط الحرارية للتجزئة عن تحليلات المناطق، وكيف تنتج V-Count كليهما من المستشعرات نفسها، والقرارات التي يتخذها تجار التجزئة بناءً على هذه البيانات. ويجمع هذا القسم الإرشادات التي نُشرت سابقًا بشكل منفصل حول الخرائط الحرارية للمتاجر، ليكون كل ما يتعلق بالموضوع في مكان واحد.
ما الذي تُظهره الخريطة الحرارية للتجزئة
الخريطة الحرارية للمتجر طبقة مرئية فوق مخطط متجرك تلوّن كل منطقة بحسب حجم نشاط المتسوقين الذي تستقبله. وبينما يجيب عدّاد الباب عن سؤال «كم شخصًا دخل؟»، تجيب الخرائط الحرارية للتجزئة عن سؤال «ماذا حدث بعد أن دخلوا؟». وعند نشر حلول V-Count، تغذّي المستشعرات نفسها التي تقيس حركة الزوّار عند المدخل عروضَ الخرائط الحرارية وتحليلات المناطق داخل BoostBI أيضًا، فيأتي الرقمان من مصدر واحد بدلًا من نظامين تتعارض بياناتهما.
تتكوّن الصورة الكاملة للخرائط الحرارية وتحليلات المناطق من خمس طبقات:
- الخرائط الحرارية لمدة البقاء — شدة اللون بحسب المدة التي يمكثها الزوّار في منطقة ما. وتميّز تحليلات مدة البقاء بين منصة عرض تجذب الاهتمام فعلًا وبقعة يعبرها الناس فحسب في طريقهم إلى غرف القياس.
- خرائط المسارات والتدفق — المسارات التي يسلكها المتسوقون فعلًا عبر أرضية المتجر، بما في ذلك المسار الغالب من المدخل، والنقاط التي تتفرّع عندها الحركة، والممرات التي تشكّل نقاط اختناق.
- أعداد المناطق — عدد الزوّار الذين يدخلون كل منطقة محددة خلال فترة معينة، وهو ما يحوّل الصورة الملوّنة إلى رقم يمكنك وضعه في تقرير أو مقارنته أسبوعًا بعد أسبوع.
- التفاعل مع الرفوف ووحدات العرض — النشاط المقيس عند وحدة عرض واحدة أو طرف رف الجندولا أو طاولة ترويجية أو وحدة تجربة، بدلًا من قسم كامل.
- التحويل حسب المنطقة — مقارنة زيارات المنطقة بالمعاملات الخاصة بفئات المنتجات الموجودة فيها، لتعرف أي المناطق تجذب الاهتمام وأيها يحوّل هذا الاهتمام إلى مبيعات.
وعند قراءة هذه الطبقات معًا، تتكشّف المشكلتان اللتان يعاني منهما كل مخطط متجر: المناطق الساخنة التي تستحوذ على الاهتمام بالفعل وينبغي أن تحمل منتجاتك الأعلى هامشًا، والمناطق الميتة التي تدفع إيجارها وتكاليف إنارتها وتنظيفها دون أي عائد.
الخرائط الحرارية للتجزئة مقابل تحليلات المناطق: أيهما تحتاج؟
كثيرًا ما يُستخدم المصطلحان بالتبادل، وهما بالفعل مستمدّان من بيانات المستشعرات نفسها، لكنهما يجيبان عن أسئلة مختلفة ويستخدمهما أشخاص مختلفون.
الخرائط الحرارية للتجزئة هي الأسلوب المرئي. فهي تعرض الحركة ومدة البقاء على هيئة ألوان فوق مخطط المتجر، بحيث يستطيع أي شخص — مدير متجر أو منسّق عرض مرئي أو مالك عقار — أن يرى النمط في ثوانٍ معدودة دون قراءة جدول. وتكمن قوتها في التواصل والاكتشاف: فهي تُريك أين تنظر. أما حدودها فتتعلق بالدقة، لأن التدرج اللوني يصعب تتبّع اتجاهه عبر الزمن أو وضع ميزانية على أساسه أو إدراجه في مؤشر أداء رئيسي (KPI).
تحليلات المناطق هي أسلوب القياس. فأنت ترسم مناطق مسمّاة — الملابس النسائية، الإلكترونيات، صناديق الدفع، مكتب الخدمة، واجهة العرض — ويعرض النظام لكل منها عدد الزوّار ومدة البقاء ومعدل الاستقطاب والتحويل كأرقام عبر الزمن. وتكمن قوتها في المساءلة: إذ يمكنك تحديد هدف لمنطقة ما، أو المقارنة بين متجرين، أو اختبار تغيير ما وإثبات نتيجته.
وفي الواقع العملي، يستخدم تجار التجزئة كليهما، بهذا الترتيب:
- استخدم الخرائط الحرارية عندما تكون في مرحلة الاستكشاف — بعد إعادة تجهيز المتجر، أو عند إطلاق فئة منتجات جديدة، أو عندما يتراجع أداء متجر ولا يعرف أحد السبب، أو عندما تحتاج إلى إقناع أحد أصحاب المصلحة بأن الزاوية الخلفية اليسرى ميتة فعلًا.
- استخدم تحليلات المناطق عندما تكون في مرحلة الإدارة — التقارير الأسبوعية، وجداول مناوبات الموظفين، وقياس العروض الترويجية، والتقارير المقدَّمة لمالك العقار، أو أي قرار يجب الدفاع عنه برقم.
القاعدة العملية: الخرائط الحرارية تولّد الفرضية، وتحليلات المناطق تختبرها. ولهذا تتعامل V-Count مع الخرائط الحرارية وتحليلات المناطق كعرض واحد ضمن المنتج بدلًا من تقريرين منفصلين، ولهذا أيضًا يأتي هذا العرض إلى جانب مجموعة تحليلات متاجر التجزئة الأشمل بدلًا من أن يكون أداة مستقلة لتصوّر البيانات.
كيف تبني V-Count الخرائط الحرارية وبيانات المناطق
لا تستخدم V-Count «كاميرا خرائط حرارية» منفصلة. فالخريطة الحرارية عرضٌ يُولَّد من بيانات المواقع المجهولة الهوية التي تنتجها المستشعرات نفسها داخل المتجر أصلًا لأغراض عدّ الأشخاص، ولهذا تتطابق أرقام حركة المدخل وزيارات المناطق ومدة البقاء جميعها.
المستشعرات التي تنتج البيانات
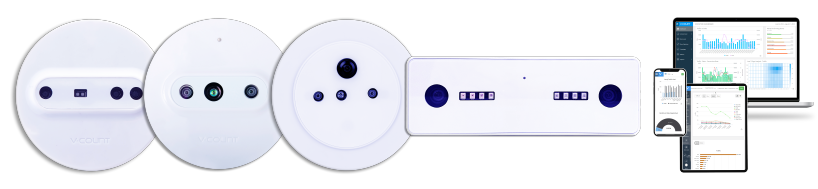
- Nano AI — مستشعر يعمل بالذكاء الاصطناعي ويُجري تحليله على الجهاز نفسه. يتولى تحديد المناطق وقياس مدة البقاء واتجاه التدفق، وهو الخيار المعتاد عندما تحتاج إلى عدة مناطق وتفاصيل على مستوى وحدات العرض من موضع واحد في السقف.
- Nano Prime — مستشعر رؤية مجسّمة ثلاثي الأبعاد (3D) مصمَّم لبيئات العدّ الصعبة: المداخل الواسعة، والأسقف العالية، وضوء النهار القوي، والحركة الكثيفة. وهو المستشعر الذي ينبغي اعتماده عندما تكون دقة عدّ المناطق عند مدخل مزدحم أهم من التفاصيل الدقيقة على مستوى وحدات العرض.
- Nano Outdoor — لمداخل المراكز التجارية والساحات الأمامية والمناطق الخارجية، حيث يجب أن يصمد العدّ أمام تقلبات الطقس والإضاءة المحيطة.
وجميعها تقيس الحركة دون تحديد الهوية. فلا تُخزَّن أي وجوه، ولا يُتعرَّف على أي فرد، وسجل المنطقة عبارة عن عدد ومدة، لا شخص.
من المستشعر إلى الخريطة الحرارية في BoostBI
تُرسم المناطق على مخطط المتجر داخل BoostBI، منصة التحليلات السحابية من V-Count. وتصبح كل منطقة عنصرًا قابلًا لإعداد التقارير له عدد زوّاره الخاص ومتوسط مدة البقاء فيه وحصته من إجمالي الحركة. ثم يعرض BoostBI الخرائط الحرارية فوق المخطط نفسه، فيمكنك التنقل بين الخريطة الملوّنة وجدول المناطق الذي تستند إليه دون مغادرة التقرير. ولأن المناطق تعريفات برمجية، يمكنك إعادة رسمها بعد إعادة تجهيز المتجر أو إضافة منطقة مؤقتة حول عرض ترويجي موسمي دون المساس بالأجهزة.
وتتوفر المخرجات في صورة تقارير مجدولة، ولوحات معلومات حسب المتجر أو الإقليم، وعبر واجهة برمجة التطبيقات (API) إلى منظومة ذكاء الأعمال (BI) أو مستودع البيانات، وهي الطريقة التي يدمج بها معظم تجار التجزئة متعددي الفروع بيانات المناطق مع معاملات نقاط البيع (POS) لاستخراج التحويل حسب المنطقة.
القرارات التي يتخذها تجار التجزئة بناءً على بيانات الخرائط الحرارية
لا تستحق الخرائط الحرارية عناء تركيبها إلا إذا غيّرت شيئًا ما. وفيما يلي القرارات التي تُستخدم فيها بيانات تحليلات المناطق فعليًا:
مخطط الرفوف (البلانوغرام) وتجاور الفئات
تُظهر أرقام زيارات المناطق ومدة البقاء فيها أي الفئات تجذب الحركة وأيها يتجاوزها المتسوقون. ويستفيد تجار التجزئة من ذلك في نقل الفئات بطيئة الحركة إلى المسار الطبيعي من المدخل، ووضع منتجات الشراء الاندفاعي على المسار الغالب، وتبرير تغييرات مخطط الرفوف أمام المورّدين بأدلة مستمدة من الحركة لا من الحدس.
مواضع وحدات العرض ومنصات العرض
يُخبرك التفاعل على مستوى وحدات العرض ما إذا كان طرف رف الجندولا أو طاولة التجربة أو واجهة العرض يستحق المساحة التي يشغلها. فإذا كانت منصة عرض مميزة تقع في منطقة باردة، فالخلل ليس في المنصة بل في موقعها. ونقلها ثم إعادة قياس المنطقة نفسها بعد أسبوعين مشروعٌ مدته أسبوع واحد، لا إعادة تجهيز كاملة.
توزيع الموظفين على المناطق الساخنة
تُظهر تحليلات مدة البقاء حسب الساعة متى تبلغ كل منطقة ذروتها، ونادرًا ما تتطابق هذه الذروات مع ذروة المدخل. وجدولة المستشارين في المناطق المزدحمة عند الساعة 11:00 وفي غرف القياس المزدحمة عند الساعة 16:00 يحسّن تغطية الخدمة دون إضافة ساعات إلى جدول المناوبات.
اختبار العروض الترويجية والمقارنة بأسلوب A/B
نفّذ عرضًا ترويجيًا في المتجر A دون المتجر B، أو في نصف أرضية المتجر دون النصف الآخر، ثم قارن زيارات المناطق ومدة البقاء والتحويل للفترة نفسها. بهذا يتحول التقييم اللاحق للحملة إلى اختبار مضبوط، وهي أسرع طريقة لمعرفة ما إذا كانت الزيادة ناتجة عن العرض نفسه أم عن اللافتات أم عن الموقع.
مزيج المستأجرين والتأجير في المراكز التجارية
في مراكز التسوّق، يُظهر التدفق على مستوى المناطق أي الممرات والطوابق والمداخل تحمل الحركة، وأي متجر رئيسي يجذب الزوّار مرورًا بأي وحدات، وأين تتلاشى حركة الزوّار. ويستخدمه الملاك لتسعير الوحدات بواقعية، وتخطيط مزيج المستأجرين، وتزويد المستأجرين بالأدلة خلال مفاوضات الإيجار.
بيئات التجزئة المتخصصة
ويمتد تطبيق الأسلوب نفسه إلى ما هو أبعد بكثير من الأزياء ومتاجر البقالة. وصالات العرض مثال جيد على ذلك — اطّلع على دور تحليلات المناطق في معارض السيارات لتعرف كيف تغيّر مدة البقاء عند كل سيارة على حدة طريقة توزيع موظفي المبيعات.
إذا أردت رؤية الخرائط الحرارية وتحليلات المناطق وهي تعمل على مخطط متجرك، احجز عرضًا توضيحيًا وسنرشدك خلال إعداد المناطق بما يناسب نوع متجرك.

اشترك في نشرتنا الإخبارية
في بيئة أعمال سريعة التطوّر، لم يَعُد الاطّلاع مجرّد ميزة — بل ضرورة. اشترك لتبقى دائمًا في طليعة المعرفة بقطاع تحليلات الزوّار.