مكاتب الرهان
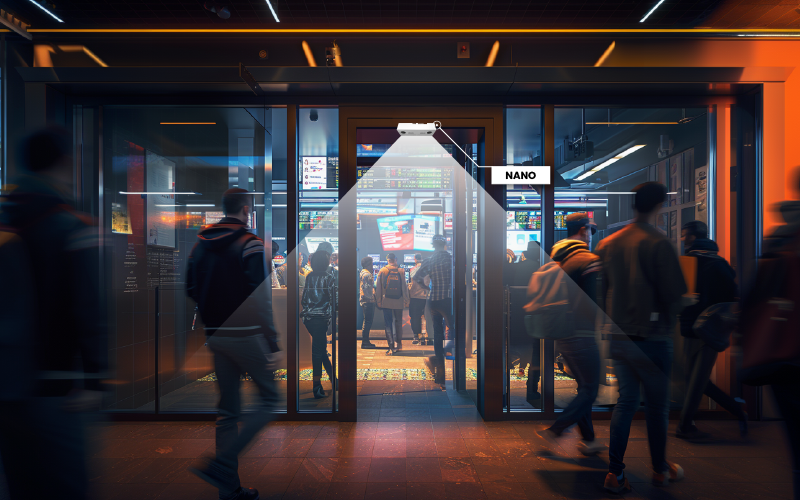
A betting office people counter measures what tills and terminal logs cannot: how many people actually walk through the door, when they arrive relative to the fixture list, how long they stay, and how many pass the window on the high street without coming in. V-Count fits overhead sensors above the shop entrance and over the interior zones that matter — the counter, the self-service betting terminal bank and the screens area — and streams anonymous counts into the BoostBI dashboard. The result is betting office visitor analytics an area manager can act on: footfall by hour and by event day, counter queueing against terminal usage, dwell, and staff hours per hundred visitors. Nobody is identified, recognised or tracked as an individual — the sensors count shapes, not people.
استكشف المعرض الذي يُبرز مجموعتنا المتنوّعة من العملاء. نفخر بالعمل مع هذه العلامات التجارية الرائدة، مقدّمين حلول تحليلات الزوّار التي تدفع نجاحها.


فوائد تحليلات الزوّار لمكاتب الرهان

في عالم مكاتب الرهان، تقدّم حلول عدّ الأشخاص مزايا لا تُقدَّر بثمن. فمن خلال تحليل حركة الزوّار، يمكن لمكاتب الرهان التعمّق في سلوك العملاء، وتحديد أوقات الرهان الرائجة والمناطق المحدّدة داخل المكتب. وتُستخدم هذه الرؤى لتحسين التصاميم وتوزيع أجهزة الرهان استراتيجيًا لتعزيز تفاعل العملاء.
تمكّن بيانات عدّ الأشخاص من وضع استراتيجيات تسويقية مخصّصة، بما يتيح للشركات استهداف شرائح محدّدة من العملاء بناءً على العمر والجنس. ويعظّم هذا النهج المخصّص أثر الحملات التسويقية، فيزيد تفاعل العملاء ورضاهم. علاوةً على ذلك، يساعد حل عدّ الأشخاص في تحسين مستويات التوظيف، بما يضمن خدمة عملاء كافية خلال أوقات الرهان المزدحمة.

ولا تتيح الاستفادة من تحليلات الزوّار المتقدّمة لمكاتب الرهان الحصول على رؤى قيّمة حول حركة الشارع فحسب، بل تمكّنها أيضًا من التفاوض على اتفاقيات إيجار أكثر مواءمةً مع مالكي العقارات. فمن خلال تحليل ديناميكيات حركة الزوّار وأنماطهم، يمكن لمكاتب الرهان التعامل مع مفاوضات العقارات استراتيجيًا، بما يعزّز اتفاقيات تعاونية تسهم في خفض تكاليف التشغيل الإجمالية. ولا يحسّن هذا النهج المبني على البيانات توزيع الموارد فحسب، بل يعزّز أيضًا فعالية التكلفة، بما يهيّئ مكاتب الرهان لنموّ مستدام وكفاءة تشغيلية.
People counting for betting offices: what to measure
Betting office visitor analytics starts from a simple gap in the data. Your EPOS, your terminal logs and your over-the-counter slips only describe customers who staked money. They say nothing about the people who came in, watched two races on the screens and left, nothing about the queue that formed at the counter ten minutes before the off, and nothing about the hundreds who walked past the window on a Saturday afternoon. A betting office people counter closes that gap by counting every entry and exit anonymously and lining those counts up against the fixture list. These are the measures worth reporting in a licensed betting office:
- Footfall by fixture and event day. Raw daily totals hide the pattern. Break the day into fifteen or thirty minute buckets and overlay the racing card, the football kick-off times and the big annual meetings, and you can see how far ahead of an event your customers arrive and how quickly the shop empties afterwards.
- Counter traffic versus self-service terminal traffic. Separate zone counts over the counter and over the terminal bank show you which channel your customers are choosing hour by hour, and whether counter demand is being driven by bet types staff have to handle or simply by terminals being occupied.
- Counter queue length and wait time. When counter traffic spikes, the question is whether the queue cleared before the race started. Zone counting combined with queue management analytics gives you queue length, waiting time and abandonment at the busiest minute of the day rather than an average that flatters the shop.
- Dwell time and visit length. A betting office is a dwell venue, not a transaction venue. Average time in shop, and the share of visits over thirty minutes, tell you whether the screens area and seating are doing their job, and whether a refit changed behaviour.
- Repeat visit patterns — anonymously. V-Count sensors do not identify anyone. There is no face recognition, no name, no loyalty match and no personal record. What you get instead is aggregate pattern data — the shape of the week, the ratio of quiet-hour to peak-hour traffic, how event days compare with baseline days — which is what you actually need to plan a shop.
- Live occupancy against your own capacity figure. Where your operating policy, licence conditions or local rules set a comfortable or maximum number of people in the shop, a live occupancy count lets you evidence that the limit is being respected and act when it is approached. The sensor supplies the number; the policy and the threshold remain yours to set with your compliance team.
- High-street pass-by capture rate. Counting the people who walk past the fascia, and dividing entries by pass-by, produces a capture rate. That single number tells you more about a site than footfall alone, because it separates a weak location from a weak shopfront.
- Staff hours per hundred visitors. The practical output of betting shop people counting: how much labour you are spending to serve the traffic you actually get, shop by shop and shift by shift.
Where the sensors go in a betting shop
Licensed betting offices are small, low-ceilinged units with one main door, a service counter, a run of self-service betting terminals and a screens area. That layout makes them straightforward to instrument, and it means a handful of sensors covers everything an area manager needs.
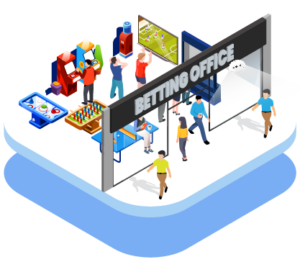
- Above the front door. One overhead unit on the entrance line gives bidirectional in and out counts, which is the base figure every other metric is built on. Nano AI is the usual choice: an all-in-one AI camera sensor that mounts to the ceiling inside the lobby and needs a single cable.
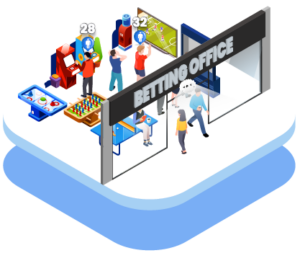
- Over the counter and the terminal bank. Zone counting is what separates a betting office people counter from a simple door clicker. A sensor over the counter area measures queueing and service pressure; a sensor over the SSBT run measures how long the machines are in use and when they are all occupied.
- Over the screens and seating area. This is the dwell zone. Counting it tells you whether customers are staying through a card or leaving between races, and whether adding or removing seating changed anything.
- High-bay, dark or awkward interiors. Where the ceiling is high, the entrance is glazed with strong backlight, or the lighting is deliberately low around the screens, Nano Prime 3D stereo counting handles the conditions that trip up simpler sensors.
- The pavement outside (optional). If you want bookmaker footfall on the street as well as inside the shop, Nano Outdoor mounts above the fascia in a weatherproof housing and counts pass-by traffic, so you can report a capture rate and judge window displays and odds boards on evidence.
- Live occupancy screens. VCare turns the entrance count into a real-time occupancy figure on a display or a manager dashboard, with alerts when a threshold you have set is approached.
Everything reports into BoostBI, V-Count’s cloud analytics platform, so a single shop and a thousand shops are read the same way: hourly curves, day comparisons, zone breakdowns, exports and scheduled reports. If you are new to the technology, our people counting overview explains how the sensors and the platform fit together.
How betting office operators use the data
- Staffing to event peaks, not to averages. A shop that averages steady traffic can still have a twenty-minute crush before a televised race. Once you have footfall in fifteen-minute buckets against the fixture card, rotas can be built around the peaks that actually exist in that shop, and a second person can be on the counter before the queue forms rather than after.
- Getting the counter and terminal mix right. If the terminal bank is saturated every Saturday while the counter is quiet, you have a capacity problem, not a demand problem. If the counter queue is long while terminals sit idle, it is a signage, layout or bet-type problem. Zone counts tell you which.
- Setting and reviewing opening hours. Evening and late-night trading is expensive. Hourly footfall shows exactly what the last two hours of the day deliver in each shop, which is a far better basis for extending or trimming hours than takings alone.
- Estate benchmarking. Comparable footfall, dwell and capture-rate figures across every shop turn a portfolio into a league table you can trust. Normalise by opening hours and by pass-by traffic and a small shop on a busy street stops being unfairly flattered by its raw totals.
- Closure, relocation and lease decisions. Closing a shop on takings alone can mean closing a site whose footfall is strong but whose conversion is broken. A two-year footfall trend, plus pass-by capture, tells you whether the pitch has declined or the shop has — and it gives you a hard number to take into a rent review or a relocation business case.
- Judging refits, odds boards and window displays. Measure the four weeks before and the four weeks after. If capture rate rises and dwell rises, the change worked. If only takings moved, something else did.
- Service standards at the counter. Queue and wait figures let you set a realistic standard — for example, a target maximum wait during the hour before a major event — and then report against it per shop.
- Capacity and crowd comfort on big event days. On Grand National or derby days, live occupancy lets a manager see when the shop is approaching the number the business has decided is its limit, and take the steps set out in the operator’s own policy. The data supports the policy; it does not replace it, and it never involves identifying a customer.
Ready to see it on your own estate? Book a demo and we will walk through a betting office layout, the zones we would count and the reports your area managers would get.
Betting office people counting FAQ
How does a betting office people counter cope with fixture-day and race-day peaks?
It counts continuously and reports in fifteen or thirty minute buckets, so peaks are visible rather than averaged away. In BoostBI you can overlay the racing card and kick-off times on the footfall curve and see how far ahead of an event customers arrive, how sharp the pre-race spike is, and how fast the shop empties. That lets you compare a Saturday football card with a midweek evening, or a big annual meeting with a normal race day, and build rotas around the peaks that genuinely occur in that shop.
Can I compare counter traffic with self-service betting terminal usage?
Yes, by counting zones rather than just the door. A sensor over the counter and another over the terminal bank give you two separate curves for the same hours, so you can see whether customers are queueing at the counter because terminals are all occupied, or using terminals because the counter queue is long. Combined with queue analytics you get wait time and abandonment at the counter as well. That is usually the quickest way to decide whether a shop needs another terminal, another staff member, or a layout change.
Does betting office visitor analytics identify individual customers?
No. V-Count sensors count anonymously. They detect and track shapes moving through a counting line or zone and discard them immediately afterwards. There is no facial recognition, no identity, no name, no account match and no personal record kept, and the analytics you see are aggregate counts, not profiles of people. This matters in a betting office more than almost anywhere else, which is why anonymous counting is the default and why the data can be used freely for staffing, layout and capacity work.
How do you separate staff movements from customer footfall?
Two ways, used together. First, placement: sensors sit on the customer entrance line and over customer zones, not over the staff-only route behind the counter, so most colleague movement is never counted. Second, calibration: opening and closing routines and staff break patterns are visible as small, regular counts at predictable times, and those can be excluded from reporting baselines. For shops where staff must cross a counted line, we normally set the reporting rules during commissioning so your footfall figures reflect customers.
If the counting is anonymous, how can you report repeat visits and dwell?
Dwell is measured from the counts themselves: the time between entries and exits across a zone gives an average time in shop and a distribution of visit lengths, with no need to know who anyone is. Repeat behaviour is reported as pattern rather than as individuals, for example the ratio between quiet-hour and peak-hour traffic, the shape of the trading week, or how an event day compares with baseline days. You get the trend you need to plan a shop without ever holding customer-level data.
Can occupancy data support responsible-gambling capacity rules on busy event days?
It can support them by supplying an accurate live number. VCare converts the entrance count into real-time occupancy and can alert a manager or show a display when the figure approaches a threshold you have set. What the threshold should be, and what a colleague does when it is reached, is a matter for your own operating policy, licence conditions and compliance team; V-Count provides the measurement and the audit trail, not the rule. The counting itself stays anonymous throughout.
How do I measure high-street pass-by traffic outside a betting office?
Add an outdoor sensor above the fascia. Nano Outdoor is built for weather and mounts on the shopfront to count people passing on the pavement. Dividing entries by pass-by gives a capture rate, which is the fairest way to compare shops, because it separates a quiet pitch from a shop that simply fails to pull people in. It also gives you evidence for window displays, odds boards and fascia changes. Outdoor pass-by counting is optional and is normally added only to shops where the pitch is in question.
What does footfall data tell me before closing or relocating a shop?
More than takings do. A two-year footfall trend shows whether traffic to the pitch is declining or simply converting worse, and pass-by capture rate separates the two. Dwell shows whether people stay once inside. Set side by side across the estate on comparable terms, those measures tell you which sites are structurally weak, which are underperforming against their own catchment and could be fixed, and which are worth relocating a few doors along. The same figures are useful evidence in a rent review or lease negotiation.
الأسئلة الشائعة
تحديث المرجع: 2026-09-18