محلات السوبر ماركت

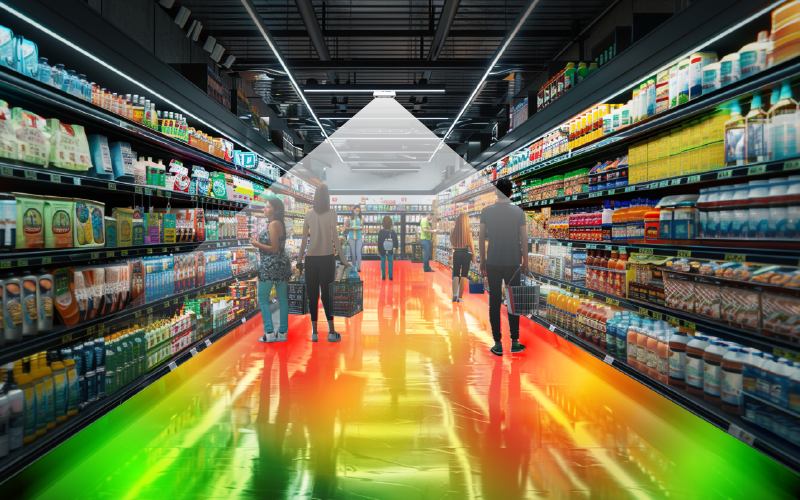
A supermarket people counting system turns the front doors, the aisles and the checkout area into space you can measure. V-Count sensors count every shopper entering and leaving, in 15-minute intervals, so the morning top-up rush, the after-work peak and the weekend big shop show up as separate patterns instead of one daily total. Inside the store, zone counters show how many people actually reach fresh produce, the bakery counter, the promotional end-caps and the back-wall chillers, while the checkout area is measured for queue length and waiting time. Counting is anonymous — the sensors report numbers, never identities. The result is one view of footfall, conversion, dwell, queueing and occupancy for a single store or an entire chain.

Supermarket people counter
Join the Ranks of Our مرموق Clients

استكشف المعرض الذي يُبرز مجموعتنا المتنوّعة من العملاء. نفخر بالعمل مع هذه العلامات التجارية الرائدة، مقدّمين حلول تحليلات الزوّار التي تدفع نجاحها.

فوائد تحليلات الزوّار لمحلات السوبر ماركت

Supermarket visitor analytics: what to measure

Supermarket visitor analytics only earns its place when it produces numbers a store manager can act on the same day. Grocery is a high-frequency, low-margin trade, so the measurements that matter are the ones that move labour cost, basket count and waste — not vanity traffic totals. These are the six that a supermarket people counting system should deliver.

  • Entrance counts by hour. Separate in and out counts at every customer door, bucketed into 15-minute or hourly intervals. This is the raw material for labour scheduling: a store that takes 60% of its shoppers between 16:00 and 19:30 needs a completely different rota from one that peaks mid-morning with pensioners and parents.
  • Conversion — transactions divided by visitors. Your POS already counts baskets; a supermarket visitor counter supplies the missing denominator. Conversion tells you whether a weak day was a traffic problem (fewer people came) or an execution problem (they came and left empty-handed), and those two problems have opposite fixes.
  • Checkout queue length and waiting time. How many shoppers are standing in the checkout area right now, and how long the average person waits before being served. This is the number that decides when a lane opens and when it closes.
  • Zone and aisle traffic. How many shoppers reach the wine aisle, the chilled ready-meals, the seasonal end-cap or the bakery, expressed as a share of store visitors. A category that only 12% of shoppers walk past has a visibility problem, not a pricing problem.
  • Dwell time by zone. How long people linger in front of a category. Long dwell with low sales usually means confusion — poor signage, an unclear range, or a promotion that is not landing.
  • Live store occupancy. How many people are in the building at this moment, compared with a capacity limit set by fire regulations, a local rule or your own comfort threshold.

What people mean by “supermarket counters”

Searches for supermarket counters usually mean one of two very different things. If you are after deli, bakery or fish service counters, that is shopfitting. If you mean devices that count how many people come into the store, you are looking for supermarket people counters — overhead sensors mounted at the entrance and over key zones that tally shoppers in and out. Everything on this page is about the second kind. If you want the general background first, start with our guide to people counting technology.

Where the sensors go in a supermarket

A supermarket is not one counting problem, it is four: the doors, the checkout area, the service counters and the aisles. Each needs a sensor placed for the job rather than a single device at the entrance.

  • Customer entrances and the exit lobby. One Nano AI sensor per doorway, mounted overhead in the lobby between the outer and inner doors, gives directional in/out counts and filters out people who step in and turn straight back around. Most stores need a second unit if the entrance is wider than a standard double door.
  • High, dark or warehouse-format entrances. Cash-and-carry and hypermarket lobbies often have ceilings well above normal retail height and strong daylight glare from glass frontage. Nano Prime uses 3D stereo vision, which copes with height and with harsh lighting contrast better than a single-lens count.
  • Car parks, trolley bays, garden centres and forecourts. Anything outside the building envelope needs weatherproof hardware; Nano Outdoor is built for that, and it lets you compare car park arrivals against door entries to see how many people reach the store at all.
  • The checkout area. Sensors are mounted over the queueing zone in front of the tills rather than over each individual till. That is what produces a live count of waiting shoppers and an average wait time, and it works the same way whether the lane is staffed or self-service.
  • Fresh and service counters. Deli, butcher, fishmonger and bakery counters each get their own zone so you can see a queue building at the deli at 17:00 even while the front end is quiet.
  • Aisles, end-caps and category zones. Zone counting across the sales floor produces the aisle and zone heatmaps used to judge promotional space and planogram changes.
  • Occupancy display. Where a capacity limit applies, VCare shows the live number of people in store and can drive a screen at the door.

Every sensor feeds BoostBI, V-Count’s cloud analytics platform, where the counts become dashboards, scheduled reports and threshold alerts. Sensors report counts only — no faces, no names, no shopper identities — which is what makes anonymous counting straightforward to explain to a data protection officer and to shoppers.

Supermarket queue measurement at checkouts and fresh counters

Queueing is where grocery shoppers decide whether they will come back. Supermarket queue measurement replaces the duty manager’s glance across the front end with a continuous number: how many people are waiting, and for how long. Sensors watch the queueing zone, so the count is of people waiting — not of tills that happen to be open.

Once that number exists you can set thresholds and act on them. A common pattern is a two-stage rule: at a moderate queue the system notifies the supervisor to call a colleague forward; above a higher threshold it escalates. Because the data is timestamped, you can go back afterwards and see whether the lane actually opened within a few minutes of the alert, which turns queue policy into something you can audit rather than hope for.

The same measurement settles the self-checkout argument. Compare wait time and throughput in the staffed lanes against the self-scan bank, hour by hour, and you can see when the self-checkout mix is right and when the store is short of staffed lanes for big trolley shops. Fresh counters behave differently again: a deli queue peaks in the early evening, often while the front end is calm, so it needs its own threshold and its own staffing trigger. For the mechanics of thresholds, alerts and reporting, see our queue management solution, and for supermarket-specific tactics read queue optimization in supermarkets.

How supermarket operators use the data

  • Build the labour schedule on arrivals, not on takings. Sales by hour tell you when money was taken; entrance counts by hour tell you when people were in the building needing help. Rotas built on the second consistently cover the shoulders of the peak better.
  • Open and close lanes on a rule. Queue thresholds convert “the front end looks busy” into a defined trigger, and let you decide the staffed-versus-self-checkout balance for each part of the day.
  • Price promotional space honestly. Zone traffic shows what share of shoppers pass a given end-cap or gondola end. That is the fair basis for what a supplier-funded display is worth, and it shows immediately when a promotion has been placed somewhere nobody walks.
  • Test layout changes properly. Move the bakery, widen an aisle or reposition the meal-deal chiller, then compare zone traffic, dwell and conversion before and after in the same store, on matched weekdays.
  • Hold capacity without a clicker. Live occupancy against a set limit keeps the store within a fire or safety threshold and gives a record that the limit was respected.
  • Benchmark store against store. With the same KPI definitions in every branch, multi-store benchmarking shows which sites convert their traffic and which lose shoppers at the doors — and separates a weak store from a weak catchment.
  • Attribute marketing. A leaflet drop, a fuel promotion or a local radio slot should move entrance counts within a defined window; conversion tells you whether the extra visitors bought anything.

Supermarket people counting FAQ

How do I know when to open or close another checkout lane?

Set a threshold on the number of people waiting in the checkout zone, or on average wait time, and let the system raise the alert instead of relying on a manager noticing. V-Count sensors over the queueing area produce a live count of waiting shoppers; BoostBI compares it with the threshold you set for that store and daypart and sends a notification to a screen, phone or email. Because every alert and every queue reading is timestamped, you can review afterwards how quickly lanes were opened and tune the threshold up or down.

How do you measure checkout waiting time rather than just queue length?

Waiting time is derived from the queue rather than timed on individual shoppers, so nobody is identified. The sensor knows how many people are in the queueing zone and how fast the zone is emptying, and those two figures give an average wait for the shoppers currently standing there. That is more useful than a headcount on its own: ten people moving through four open lanes is a short wait, while six people at one lane is a long one. Both readings are reported in BoostBI alongside entrance counts.

How many self-checkout terminals does my store actually need?

Measure before you buy. Split queue length, wait time and throughput between the staffed lanes and the self-scan bank, hour by hour, for a few representative weeks. The pattern usually shows self-checkout absorbing small baskets well at peak but leaving big trolley shops queueing at too few staffed lanes. Once the supermarket people counting system is in, you can also re-run the comparison after changing the mix, so the decision to add or remove terminals is based on measured waiting rather than on the vendor’s recommendation.

Can I measure queues at the deli, bakery and fish counters too?

Yes — each service counter is set up as its own zone with its own threshold. Fresh counters rarely peak at the same time as the front end, so a deli queue can build at 17:00 while the checkouts are quiet. Separate zones let you staff the counter from its own trigger and let you see whether shoppers are walking away from a long fresh queue, which shows up as high zone traffic with low counter dwell. The same sensors serve the surrounding aisle zones.

Do trolleys, children and staff get counted as shoppers?

Trolleys and baskets are not counted — the sensors detect people, not objects being pushed. Children are counted as people, which is what you want for occupancy and safety, and V-Count can distinguish shorter individuals so children can be excluded from conversion calculations where you prefer to count buying adults only. Staff movement is handled by excluding staff-only doorways and back-of-house routes from the customer count, and by placing the entrance sensor where the colleague entrance does not cross it.

Will a supermarket visitor counter work with wide automatic sliding doors?

Yes, provided the coverage matches the opening. A single overhead sensor covers a defined width, so a wide or double-leaf automatic entrance normally takes two or more units working together as one counting line. The best position is inside the lobby, past the outer doors, where shoppers have committed to entering; that avoids counting people who pause under the canopy. For very high or heavily backlit lobbies, Nano Prime 3D stereo is the better fit than a standard indoor camera sensor.

How do I prove a supplier-funded end-cap or promotion was worth the fee?

Report the zone, not the store. Zone traffic shows what share of store visitors physically walked past the display, dwell shows how many stopped, and your POS supplies the units sold. Together they separate three failures that look identical on a sales report: nobody walked past, people walked past but did not stop, or people stopped but did not buy. Running the same zone report before, during and after the promotional period gives a supplier a defensible number for what the space delivered.

Getting started in your stores

Most grocery chains begin with entrance counting and conversion in a handful of representative stores, add checkout queue measurement once the baseline is understood, and only then extend to aisle zones and promotional space. That order keeps the first report simple and makes the second one credible. For wider context on what in-store measurement delivers in grocery, read our article on the benefits of people counting and in-store visitor analytics for supermarkets, or see how the same metrics are used across retail store analytics. When you want to see the dashboards against your own store layout, book a demo with V-Count and we will walk through sensor placement, queue thresholds and the reports your store managers would receive.

الأسئلة الشائعة

تحديث المرجع: 2026-09-18

ما القياسات المناسبة لقطاع السوبرماركت؟
يمكن لـ V-Count ربط حركة المتجر بمشتريات نقاط البيع المؤهلة وساعات العمل المدفوعة. افصل المارة ودخول المتجر وزيارات المناطق مع توحيد المتجر والفترة وقواعد الاستبعاد. المصادر: https://v-count.com/ar/%d8%a7%d9%84%d9%82%d8%b7%d8%a7%d8%b9%d8%a7%d8%aa/%d8%a7%d9%84%d8%b3%d9%88%d8%a8%d8%b1-%d9%85%d8%a7%d8%b1%d9%83%d8%aa/
كيف نتحقق من القياس لقطاع السوبرماركت؟
قارن الحلول بتجربة ممثلة للواقع: حدّد الخطوط أو المناطق والاستبعادات والتغطية والعد المرجعي وفترات الذروة ومعايير القبول. مواصفات V-Count مرتبطة بالموديل؛ تحقّق من التركيب المحدد ومن التحليلات الاختيارية كلٍّ على حدة. المصادر: https://v-count.com/how-to-choose-the-right-people-counting-system-provider-for-your-business/
كيف يقيس Nano AI حركة المداخل؟
يقيس V-Count Nano AI عبور خطوط محددة عند المداخل الداخلية. المواصفة المعتمدة هي دقة تصل إلى 99%، مع ارتفاع تركيب من 2.2 إلى 7 م وإضاءة IR مدمجة تدعم العد عند 0 لوكس. تحقّق من التغطية والإضاءة والمجموعات والازدحام في الموقع، واختبر التحليلات الاختيارية بصورة منفصلة. المصادر: https://v-count.com/ar/retail-people-counting-foot-traffic-analytics-2026-guide/
ما المستشعر الذي يقيس المناطق ومدة البقاء؟
يدعم V-Count Nano Prime قياس المناطق والخرائط الحرارية ومدة البقاء وتدفق الزوار بالتغطية والإعداد والترخيص المناسب. حدّد حدود المناطق وتحقّق منها. توضح الحركة المرصودة أماكن المرور والبقاء، لكنها لا تكشف النية ولا تثبت سبب المغادرة. المصادر: https://v-count.com/retail-heatmap-analytics-nano-prime/
كم مرة يحدّث BoostBI التقارير؟
يحدّث V-Count BoostBI التقارير عادة كل 10 دقائق. ويمكن أن تصل الوتيرة إلى تحديث كل دقيقة عند تفعيل إعدادات التحديث الآني. لاستيراد بيانات نقاط البيع جدول مستقل؛ تأكد من التوقيت وقنوات الإبلاغ المطلوبة. المصادر: https://v-count.com/boostbi-retail-visitor-analytics-footfall-analytics-software-shopper-analytics-platform/
كيف يتكامل V-Count مع الأنظمة الحالية؟
يضم V-Count BoostBI موصلات أصلية لـ Shopify وNebim وتكاملات عاملة مع VendPOS وNayax وImagineX وQuickBooks. يتوفر استيراد المبيعات يدوياً وتكامل REST API بنطاق متفق عليه. تحقّق من الإصدارات والمصادقة والحقول والربط واتجاه البيانات والوتيرة والدعم. يوفر V-Count وثائق REST API. المصادر: https://v-count.com/boostbi-retail-visitor-analytics-footfall-analytics-software-shopper-analytics-platform/
ما الأسعار المعتادة لحلول عد الأشخاص؟
يعتمد تسعير V-Count على عدد المستشعرات. تتضمن حزمة BoostBI المعروضة التراخيص الفرعية المختارة؛ الوصول إلى API واستبعاد الموظفين والديموغرافيا والطوابير والخرائط الحرارية خيارات مستقلة. قارن التكلفة الكاملة للأجهزة والبرامج والتركيب والتكامل والدعم. المصادر: https://v-count.com/ar/%d8%a7%d9%84%d8%a3%d8%b3%d8%b9%d8%a7%d8%b1/
ما جوانب الخصوصية التي يجب مراجعتها عند النشر؟
تعالج مستشعرات V-Count المتوافقة القياسات داخل الجهاز وتنقل مخرجات تحليلية إلى المنصة. راجع الأجهزة وتدفقات البيانات والصلاحيات وفترات الاحتفاظ والأنظمة المتصلة. تبقى مسؤوليات النشر لدى الجهات المعنية؛ الميزات التقنية وحدها لا تضمن الامتثال التنظيمي. المصادر: https://v-count.com/ar/retail-people-counting-foot-traffic-analytics-2026-guide/
كيف نستبعد حركة الموظفين؟
يقدم V-Count ثلاث طرق لاستبعاد الموظفين: شريط التعريف حول الرقبة ووسم الكتف وتطبيق الهاتف. اختر الطريقة والترخيص المتوافقين واختبر حركة الموظفين بصورة منفصلة. استخدم قواعد استبعاد متسقة عند مقارنة أعداد الزوار والتحويل. المصادر: https://v-count.com/ar/%d9%85%d8%b3%d8%aa%d8%b4%d8%b9%d8%b1-%d8%b9%d8%af-%d8%a7%d9%84%d8%a3%d8%b4%d8%ae%d8%a7%d8%b5-%d9%86%d8%a7%d9%86%d9%88/
كيف يُركّب V-Count ويُختبر؟
يبدأ تركيب V-Count بمراجعة الارتفاع ومجال الرؤية والعوائق والطاقة والشبكة. يستخدم Nano AI طاقة USB-C بجهد 5 فولت وWi-Fi، مع مقسّم PoE خارجي اختياري. للموديلات الأخرى متطلبات خاصة؛ لا توجد مدة تركيب موحّدة لجميع المواقع. المصادر: https://v-count.com/ar/%d9%85%d8%b3%d8%aa%d8%b4%d8%b9%d8%b1-%d8%b9%d8%af-%d8%a7%d9%84%d8%a3%d8%b4%d8%ae%d8%a7%d8%b5-%d9%86%d8%a7%d9%86%d9%88/
كيف نقارن مواقع متعددة؟
يقارن V-Count BoostBI المواقع باستخدام معرفات ومناطق زمنية وتقويمات تشغيل واستبعادات وفترات مكتملة ومتسقة. طابق بيانات المصادر وحدّد البيانات المفقودة. اجمع المعاملات والزيارات المؤهلة قبل حساب معدل التحويل الكلي. المصادر: https://v-count.com/boostbi-retail-visitor-analytics-footfall-analytics-software-shopper-analytics-platform/
كيف نختار أداة قياس؟
اختر الأدوات وفق القرار والبيانات المطلوبة. يجمع V-Count عدّ المداخل وقياس المناطق المتوافق وتقارير BoostBI؛ وتوفر أنظمة البيع والموظفين وتحليلات الويب سجلاتها الخاصة. قيّم التغطية والتحقق والتكامل والتراخيص والتكلفة الكلية. المصادر: https://v-count.com/retail-analytics-software-requirements-matrix/
كيف نقيّم فائدة التجربة وفترة استرداد التكلفة؟
قيّم V-Count باستخدام خط الأساس والتكاليف والنتيجة القابلة للقياس في موقعك. قارن فترات متكافئة وسجّل العروض والطقس وساعات التشغيل والعوامل الأخرى. لا يثبت فرق ما قبل التغيير وما بعده السببية؛ لا توجد زيادة مبيعات أو مدة استرداد مضمونة للجميع. المصادر: https://v-count.com/ar/retail-people-counting-foot-traffic-analytics-2026-guide/
ما متطلبات تقرير الإشغال؟
يتطلب تقرير الإشغال من V-Count تغطية المداخل والمخارج المعنية وقيمة بداية متفقاً عليها وفحص الانحراف والبيانات المفقودة. تأكد من التحديث وإعداد التنبيهات. العد لا يحل محل إجراءات السلامة ولا يحدد السعة الآمنة للموقع. المصادر: https://v-count.com/boostbi-retail-visitor-analytics-footfall-analytics-software-shopper-analytics-platform/
ما البيانات المطلوبة لتخطيط الموظفين والإنتاجية؟
اجمع حركة V-Count مع بيانات نقاط البيع وساعات العمل المدفوعة الفعلية. المبيعات لكل ساعة عمل = صافي المبيعات ÷ الساعات المدفوعة؛ والإيراد لكل زائر = صافي المبيعات ÷ الزيارات المؤهلة. تعبّر الزيارات لكل ساعة عن عبء العمل، لا أداء الموظف الفردي. المصادر: https://v-count.com/retail-store-productivity-scorecard/