العقارات

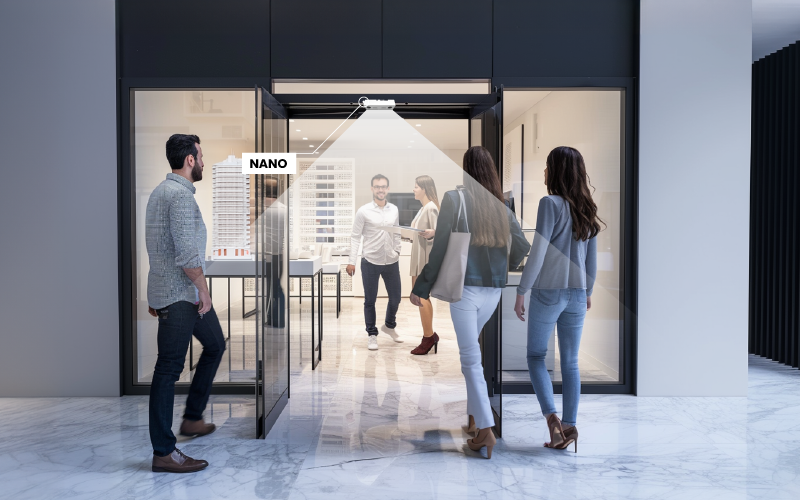
A real estate visitor counter turns a building into a measurable asset. V-Count sensors sit above lobby doors, retail podium units, amenity floors, leasing offices, show flats and sales galleries, counting everyone who walks in and out without identifying a single person. Landlords and property managers use those counts to evidence footfall in valuations and leasing pitches, to show a tenant its capture rate from the common areas, to see how gyms, lounges and coworking floors are really used, and to run lighting and HVAC on occupancy instead of a timer. Deployed across a portfolio, the same real estate traffic counter lets every asset be compared on one consistent definition of a visit.

Real Estate People Counter
Join the Ranks of Our مرموق Clients

استكشف المعرض الذي يُبرز مجموعتنا المتنوّعة من العملاء. نفخر بالعمل مع هذه العلامات التجارية الرائدة، مقدّمين حلول تحليلات الزوّار التي تدفع نجاحها.

فوائد تحليلات الزوّار لقطاع العقارات

Real Estate People Counting 01

في المشهد التنافسي للعقارات، توفّر الاستفادة من تحليلات الزوّار وعدّ الأشخاص مزايا متميّزة. فمن خلال التعمّق في أعداد حركة الزوّار، يمكنك الحصول على رؤى لا تُقدَّر بثمن حول حركة العملاء ومستويات التفاعل عند نقاط الاتصال المختلفة مثل مكاتب المبيعات، أو النماذج المنزلية ثلاثية الأبعاد، أو المنازل النموذجية. ونتيجةً لذلك، يمكنك تعزيز المبيعات، خاصةً في قطاع الشقق الفاخرة، عبر التقدّم على منافسيك في مجال العقارات.

كما يساعدك عدّ الأشخاص في قطاع العقارات على خفض تكاليف الطاقة. فمن خلال تحسين أنظمة الإضاءة والتدفئة والتبريد بناءً على الإشغال، تقضي على الطاقة المهدورة في المنازل الفارغة أو المناطق غير المستخدمة، بما يعزّز الممارسات الصديقة للبيئة.

Age and gender recognition tells a landlord who an asset actually attracts, rather than who the catchment study predicted. In a sales gallery, the demographic split shows whether a campaign is pulling the first-time buyers it was written for or an older downsizing audience, so the next media budget can be re-aimed. In a mixed-use scheme, the demographic profile of lobby and amenity visitors becomes evidence you can put in front of a prospective retail or F&B tenant during negotiation, and it guides where signage, screens and concierge services are placed. V-Count’s gender and age recognition runs on the device and produces anonymous aggregate counts only: no images, no identities, no individual profiles.

Real estate traffic analytics: what to measure in a building

Real estate traffic analytics is rarely one headline number. A landlord, an asset manager and a sales director all want a different cut of the same counted people, so the first decision is which metrics the building has to produce. These are the ones that carry weight in a property business.

Asset-level footfall

Total entries per day, week and year, per entrance, is the figure that goes into a valuation pack, an investor update or a leasing brochure. It only becomes comparable once you normalise it: entries per trading hour, per lettable square metre, and indexed against the same week last year. A property that can show three years of consistently measured footfall is arguing from evidence rather than from a catchment study.

Tenant capture rate

Capture rate is the share of people passing a unit inside the scheme who actually walk into it. Counting the mall or podium walkway and the tenant doorway separately turns “the centre is busy” into “your unit captured this proportion of the people who walked past it”. That is the number that supports turnover-rent clauses, rent reviews, unit re-grading and the case for moving a tenant to a better pitch.

Common-area and amenity utilisation

Lobbies, gyms, pools, coworking lounges, parcel rooms, meeting suites and roof terraces are paid for through the service charge, and occupiers ask what they are getting. Entries and peak concurrent occupancy per hour, per amenity, show which spaces earn their floor area, which are oversized, and which need longer opening hours rather than more equipment.

Sales gallery and show-home visits

For a developer, the sales gallery is a shop. Counting it per campaign, per weekend and per agent shift gives a viewing-to-reservation conversion rate, a cost per visit against media spend, and a fair view of which agent rota actually saw the traffic. Zone counts inside the gallery show whether visitors reach the model, the material library and the negotiation desks, or stop at the first display.

Open-house and viewing attendance

Booked viewings and attended viewings are different numbers. A counter on the show flat or open-house door records the attended one automatically, including walk-ins that were never registered, so marketing is measured on people who arrived rather than on people who clicked.

Occupancy against capacity

Peak concurrent occupancy per floor and per zone feeds three things at once: fire and event capacity limits at launch parties and open days, cleaning and HVAC schedules that follow real use, and the occupancy evidence increasingly requested for ESG and space-optimisation reporting. A floor running at a fraction of its designed density is a consolidation opportunity you can prove.

Dwell and repeat visits

How long a visitor stays in a sales suite, an amenity floor or a leasing office separates genuine interest from a pass-through. Repeat visits to the same show home before a reservation are one of the most useful early signals a developer has.

Where the sensors go in a property

A real estate visitor counter is only as good as its mounting plan. Property portfolios are awkward because one asset contains several very different counting problems, and V-Count sensors are chosen per opening rather than per building.

  • Main lobbies and tenant entrances. Nano AI mounts in the ceiling directly over the door line and counts people in and out bidirectionally. It is the default device for a standard lobby, a leasing office, an amenity room door or a retail unit inside a mixed-use scheme.
  • Double-height atria and glazed entrances. Prime residential and office lobbies are tall, bright and full of glass and polished stone. Nano Prime uses 3D stereo vision, which copes with height and difficult light where a single-lens device struggles.
  • Forecourts, plazas, car park gates and hoarding entrances. Nano Outdoor is weather-rated for the approach to the building, the site entrance at a construction-stage sales cabin, or the open plaza a scheme is judged on.
  • Zones inside the sales gallery. Sensors covering the scale model, the material library and the negotiation desks produce zone traffic and dwell rather than just a door count, so the gallery layout can be tested rather than argued about.
  • Lift lobbies and floor thresholds. Counting per floor in a multi-tenant office building gives occupancy per demise, which supports cleaning frequency, HVAC zoning and tenant conversations about space they no longer use.

Live occupancy is handled by VCare, which shows current headcount against a set limit and can drive a screen at a launch event or an alert to the building team. Everything lands in BoostBI, V-Count’s cloud analytics platform, where each asset has its own dashboard and the portfolio can be compared on one consistent definition of a visit. Data exports and API access let footfall sit next to rent roll, service-charge and energy data in the systems the asset team already uses. If your leasing suite or amenity desk builds a line at weekends, the same sensor data supports queue management.

All of it is anonymous. V-Count devices process images on board and output counts, not identities: no faces are stored, no visitors are tracked between buildings, and nothing is produced that could identify a resident, an occupier’s staff or a buyer. For background on the technology itself, see our guide to people counting.

How landlords, property managers and developers use the data

  • Evidence in valuations and investor reporting. A counted, continuous footfall series is a defensible input for an asset review, a refinancing pack or a fund report, and it removes the annual argument about whether a clicker count or a manual survey week was representative.
  • Leasing pitches and rent reviews. Bringing capture rate and passing traffic for a specific unit to a negotiation changes the conversation. The same data supports turnover-rent reporting, because sales performance can be read against the visitors the landlord actually delivered.
  • Service charge and amenity investment. Utilisation per amenity tells you whether to extend the gym, convert an under-used lounge into lettable coworking space, or reduce hours on a facility nobody uses at 7am.
  • Sales gallery staffing and agent rotas. Visits by hour and by day size the agent rota for the weekend peak instead of spreading cover evenly across a quiet week, and visits per agent shift give a fair denominator for conversion.
  • Marketing attribution per campaign. Comparing show-home and sales-gallery visits before, during and after a campaign shows which portal listing, outdoor site or launch event actually moved people to the door, and at what cost per visit.
  • Cleaning, HVAC and ESG. Cleaning triggered by visits since the last cycle and plant scheduled to real occupancy cuts wasted service in empty floors, and the occupancy record supports the space-efficiency and energy narratives in ESG reporting.
  • Safety and capacity at events. Launch parties, open days and community events in a lobby or plaza have capacity limits. Live occupancy makes the limit enforceable rather than estimated.
  • Portfolio benchmarking. When every asset counts the same way, a weak performer stands out on a like-for-like index instead of being explained away, and a successful amenity or layout can be repeated across the portfolio.

Most portfolios start with one asset: a flagship lobby, a single sales gallery or the two units whose rent review is next. Once the definition of a visit is agreed, adding buildings is a mounting exercise rather than a new project. Book a demo and we will walk through the counting plan for a specific building and the reports the asset team would receive.

Real estate people counting FAQ

What is a real estate visitor counter?

A real estate visitor counter is a sensor mounted above an entrance that counts people in and out of a building, a unit, an amenity or a sales gallery, and reports those counts as a continuous time series. It is not a security camera and it does not identify anyone. V-Count devices process the image on the sensor itself and send only anonymous counts to BoostBI, where footfall appears by hour, day and zone, per asset and across the portfolio, alongside occupancy and dwell.

How does footfall data support a valuation or a leasing pitch?

Valuers and prospective tenants both discount claims they cannot verify. A measured footfall series, collected the same way every day for years and normalised per trading hour and per square metre, is verifiable. V-Count gives each asset a dated record of entries, peak occupancy and zone traffic that can be exported straight into a valuation pack, an investor report or a leasing brochure. Because every building in the portfolio counts to the same definition, the comparison between assets holds up under scrutiny.

Can a real estate traffic counter measure tenant capture rate?

Yes. Capture rate needs two counts: the people passing a unit inside the scheme, and the people entering it. V-Count covers the mall or podium walkway as a zone and the tenant doorway as a separate line, and BoostBI divides one by the other automatically. The result gives landlords a per-unit conversion figure for rent reviews, unit re-grading and turnover-rent discussions, and gives tenants a fair way to see whether a weak month was their performance or the centre’s traffic.

How do we measure visitors to a show flat or sales gallery per campaign?

Put a counter on the gallery or show-home entrance and, where useful, zones over the scale model and the negotiation desks. BoostBI then reports visits by hour, day and week, which you can line up against campaign dates, portal listings, launch events and agent shifts. Dividing reservations by visits gives a viewing-to-reservation conversion rate, and dividing visits by media spend gives a cost per visit. Repeat visits before a reservation are recorded as return traffic to the same gallery.

How do we track open-house attendance without someone on the door?

A counter over the entrance records every arrival and departure, including walk-ins nobody registered, so attendance is captured while the agent is showing people round. Because the device counts bidirectionally, you also get concurrent occupancy, which tells you whether twenty people came in a steady trickle or arrived in one crush at the start. Nano Outdoor covers a gated forecourt or a site entrance where the open house begins outside the building itself.

Can we measure common-area and amenity use in a mixed-use building?

Yes, and it is one of the most common first deployments. Sensors on the gym, lounge, coworking floor, pool, parcel room and meeting suites give entries and peak concurrent occupancy per hour. That shows which amenities justify their floor area and service-charge cost, which are undersized at peak, and which need different opening hours rather than more capital. The same figures answer occupier questions during service-charge consultation with numbers rather than impressions.

Does occupancy data help with ESG and space optimisation?

Occupancy is the missing denominator in most building performance reporting. Knowing how many people were actually on a floor lets you express energy and water use per occupant, schedule HVAC and lighting to real presence instead of a timer, and identify floors running far below their designed density. For an office landlord, that evidence supports both a consolidation case with an occupier and the space-efficiency narrative in ESG disclosure. V-Count supplies the occupancy record; your reporting framework decides how it is presented.

How do we benchmark footfall across assets of different sizes?

Raw entries favour the biggest building, so BoostBI indexes them. Footfall per trading hour, per square metre of lettable area and against the same period last year puts a regional scheme and a city-centre tower on the same scale. Because all V-Count sensors count to one definition of a visit, differences in the index reflect real performance rather than different counting methods. New assets join the benchmark as soon as they have a baseline period.

Is a real estate traffic counter anonymous and privacy-compliant?

Yes. V-Count sensors analyse the image inside the device and output counts only. No video is streamed or stored, no faces or identities are retained, and no individual is followed between buildings, so the output is aggregate statistics about how a space is used. That matters in real estate because residents, occupiers’ staff and prospective buyers all pass through the spaces being counted. The approach is designed to satisfy GDPR-style data-minimisation requirements, and your legal team can review the deployment before rollout.

الأسئلة الشائعة

تحديث المرجع: 2026-09-18

ما القياسات المناسبة لقطاع العقارات التجارية؟
يمكن لـ V-Count مقارنة الوصول وزيارات مناطق الخدمة والانتظار المشمول بالتغطية. حدّد الزيارات المتكررة والموظفين والمواعيد؛ الدخول لا يساوي خدمة مكتملة. المصادر: https://v-count.com/ar/%d8%a7%d9%84%d9%82%d8%b7%d8%a7%d8%b9%d8%a7%d8%aa/%d8%a7%d9%84%d8%b9%d9%82%d8%a7%d8%b1%d8%a7%d8%aa/
كيف نتحقق من القياس لقطاع العقارات التجارية؟
قارن الحلول بتجربة ممثلة للواقع: حدّد الخطوط أو المناطق والاستبعادات والتغطية والعد المرجعي وفترات الذروة ومعايير القبول. مواصفات V-Count مرتبطة بالموديل؛ تحقّق من التركيب المحدد ومن التحليلات الاختيارية كلٍّ على حدة. المصادر: https://v-count.com/how-to-choose-the-right-people-counting-system-provider-for-your-business/
كيف يقيس Nano AI حركة المداخل؟
يقيس V-Count Nano AI عبور خطوط محددة عند المداخل الداخلية. المواصفة المعتمدة هي دقة تصل إلى 99%، مع ارتفاع تركيب من 2.2 إلى 7 م وإضاءة IR مدمجة تدعم العد عند 0 لوكس. تحقّق من التغطية والإضاءة والمجموعات والازدحام في الموقع، واختبر التحليلات الاختيارية بصورة منفصلة. المصادر: https://v-count.com/ar/retail-people-counting-foot-traffic-analytics-2026-guide/
ما المستشعر الذي يقيس المناطق ومدة البقاء؟
يدعم V-Count Nano Prime قياس المناطق والخرائط الحرارية ومدة البقاء وتدفق الزوار بالتغطية والإعداد والترخيص المناسب. حدّد حدود المناطق وتحقّق منها. توضح الحركة المرصودة أماكن المرور والبقاء، لكنها لا تكشف النية ولا تثبت سبب المغادرة. المصادر: https://v-count.com/retail-heatmap-analytics-nano-prime/
كم مرة يحدّث BoostBI التقارير؟
يحدّث V-Count BoostBI التقارير عادة كل 10 دقائق. ويمكن أن تصل الوتيرة إلى تحديث كل دقيقة عند تفعيل إعدادات التحديث الآني. لاستيراد بيانات نقاط البيع جدول مستقل؛ تأكد من التوقيت وقنوات الإبلاغ المطلوبة. المصادر: https://v-count.com/boostbi-retail-visitor-analytics-footfall-analytics-software-shopper-analytics-platform/
كيف يتكامل V-Count مع الأنظمة الحالية؟
يضم V-Count BoostBI موصلات أصلية لـ Shopify وNebim وتكاملات عاملة مع VendPOS وNayax وImagineX وQuickBooks. يتوفر استيراد المبيعات يدوياً وتكامل REST API بنطاق متفق عليه. تحقّق من الإصدارات والمصادقة والحقول والربط واتجاه البيانات والوتيرة والدعم. يوفر V-Count وثائق REST API. المصادر: https://v-count.com/boostbi-retail-visitor-analytics-footfall-analytics-software-shopper-analytics-platform/
ما الأسعار المعتادة لحلول عد الأشخاص؟
يعتمد تسعير V-Count على عدد المستشعرات. تتضمن حزمة BoostBI المعروضة التراخيص الفرعية المختارة؛ الوصول إلى API واستبعاد الموظفين والديموغرافيا والطوابير والخرائط الحرارية خيارات مستقلة. قارن التكلفة الكاملة للأجهزة والبرامج والتركيب والتكامل والدعم. المصادر: https://v-count.com/ar/%d8%a7%d9%84%d8%a3%d8%b3%d8%b9%d8%a7%d8%b1/
ما جوانب الخصوصية التي يجب مراجعتها عند النشر؟
تعالج مستشعرات V-Count المتوافقة القياسات داخل الجهاز وتنقل مخرجات تحليلية إلى المنصة. راجع الأجهزة وتدفقات البيانات والصلاحيات وفترات الاحتفاظ والأنظمة المتصلة. تبقى مسؤوليات النشر لدى الجهات المعنية؛ الميزات التقنية وحدها لا تضمن الامتثال التنظيمي. المصادر: https://v-count.com/ar/retail-people-counting-foot-traffic-analytics-2026-guide/
كيف نستبعد حركة الموظفين؟
يقدم V-Count ثلاث طرق لاستبعاد الموظفين: شريط التعريف حول الرقبة ووسم الكتف وتطبيق الهاتف. اختر الطريقة والترخيص المتوافقين واختبر حركة الموظفين بصورة منفصلة. استخدم قواعد استبعاد متسقة عند مقارنة أعداد الزوار والتحويل. المصادر: https://v-count.com/ar/%d9%85%d8%b3%d8%aa%d8%b4%d8%b9%d8%b1-%d8%b9%d8%af-%d8%a7%d9%84%d8%a3%d8%b4%d8%ae%d8%a7%d8%b5-%d9%86%d8%a7%d9%86%d9%88/
كيف يُركّب V-Count ويُختبر؟
يبدأ تركيب V-Count بمراجعة الارتفاع ومجال الرؤية والعوائق والطاقة والشبكة. يستخدم Nano AI طاقة USB-C بجهد 5 فولت وWi-Fi، مع مقسّم PoE خارجي اختياري. للموديلات الأخرى متطلبات خاصة؛ لا توجد مدة تركيب موحّدة لجميع المواقع. المصادر: https://v-count.com/ar/%d9%85%d8%b3%d8%aa%d8%b4%d8%b9%d8%b1-%d8%b9%d8%af-%d8%a7%d9%84%d8%a3%d8%b4%d8%ae%d8%a7%d8%b5-%d9%86%d8%a7%d9%86%d9%88/
كيف نقارن مواقع متعددة؟
يقارن V-Count BoostBI المواقع باستخدام معرفات ومناطق زمنية وتقويمات تشغيل واستبعادات وفترات مكتملة ومتسقة. طابق بيانات المصادر وحدّد البيانات المفقودة. اجمع المعاملات والزيارات المؤهلة قبل حساب معدل التحويل الكلي. المصادر: https://v-count.com/boostbi-retail-visitor-analytics-footfall-analytics-software-shopper-analytics-platform/
كيف نختار أداة قياس؟
اختر الأدوات وفق القرار والبيانات المطلوبة. يجمع V-Count عدّ المداخل وقياس المناطق المتوافق وتقارير BoostBI؛ وتوفر أنظمة البيع والموظفين وتحليلات الويب سجلاتها الخاصة. قيّم التغطية والتحقق والتكامل والتراخيص والتكلفة الكلية. المصادر: https://v-count.com/retail-analytics-software-requirements-matrix/
كيف نقيّم فائدة التجربة وفترة استرداد التكلفة؟
قيّم V-Count باستخدام خط الأساس والتكاليف والنتيجة القابلة للقياس في موقعك. قارن فترات متكافئة وسجّل العروض والطقس وساعات التشغيل والعوامل الأخرى. لا يثبت فرق ما قبل التغيير وما بعده السببية؛ لا توجد زيادة مبيعات أو مدة استرداد مضمونة للجميع. المصادر: https://v-count.com/ar/retail-people-counting-foot-traffic-analytics-2026-guide/
ما متطلبات تقرير الإشغال؟
يتطلب تقرير الإشغال من V-Count تغطية المداخل والمخارج المعنية وقيمة بداية متفقاً عليها وفحص الانحراف والبيانات المفقودة. تأكد من التحديث وإعداد التنبيهات. العد لا يحل محل إجراءات السلامة ولا يحدد السعة الآمنة للموقع. المصادر: https://v-count.com/boostbi-retail-visitor-analytics-footfall-analytics-software-shopper-analytics-platform/
ما البيانات المطلوبة لتخطيط الموظفين والإنتاجية؟
اجمع حركة V-Count مع بيانات نقاط البيع وساعات العمل المدفوعة الفعلية. المبيعات لكل ساعة عمل = صافي المبيعات ÷ الساعات المدفوعة؛ والإيراد لكل زائر = صافي المبيعات ÷ الزيارات المؤهلة. تعبّر الزيارات لكل ساعة عن عبء العمل، لا أداء الموظف الفردي. المصادر: https://v-count.com/retail-store-productivity-scorecard/