عدّ الركاب
نظرة عامة
نتائج فورية ودقيقة
ما هو حل عدّ الركاب؟
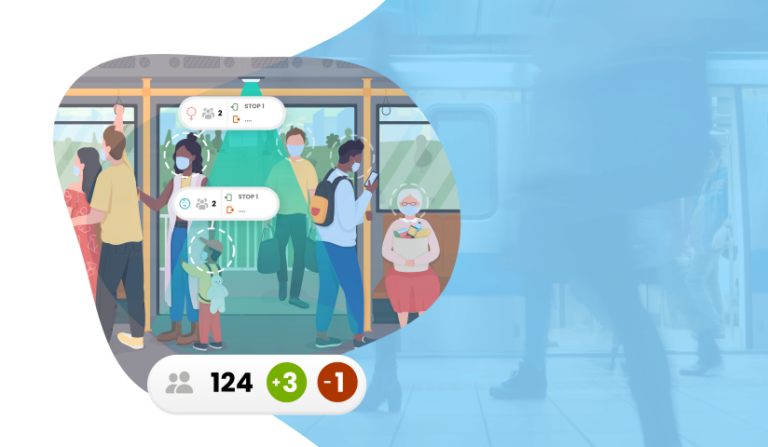
عدّ الركاب الآلي هو حل متطور وعالي التقنية يراقب ويَعُدّ الركاب الصاعدين إلى الحافلات والقطارات وغيرها من وسائل النقل العام والنازلين منها. وتُوفَّر بيانات عدّ الركاب عبر مستشعرات عدّ الأشخاص المركّبة في أبواب المركبات. ومن خلال عدّ أعداد الركاب الداخلين والخارجين في كل محطة، يمكن لشركات النقل تحسين أسطولها وتعظيم راحة الركاب.
بفضل تقنيات الذكاء الاصطناعي والتعلّم الآلي، تكتشف مستشعرات Ultima لدينا الركاب فورًا وبدقة أثناء مرورهم عبر المدخل. ونقدّم بيانات عدّ الركاب في الوقت الفعلي بدقة تصل إلى أكثر من 99%.
فوائد عدّ الركاب
بيانات إشغال الركاب في الوقت الفعلي
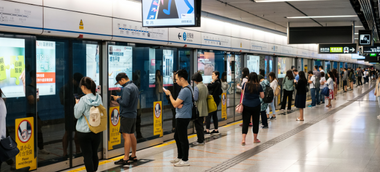
تتيح المعالجة الفورية لبيانات الركاب لشركات النقل تحسين أساطيلها باستخدام معلومات الإشغال الحيّة للمركبات والمحطات. ويمكن للبيانات الفورية للركاب اكتشاف أجسام مثل الدراجات والكراسي المتحركة وعدم احتسابها ضمن الركاب.
زيادة رضا الركاب
تتيح بيانات إشغال الركاب الفورية للشركات توفير مركبات إضافية لتلبية احتياجات الركاب، بما يضمن عدم تخلّف أي راكب حتى في الظروف الجوية السيئة، ويحسّن راحة الركاب وسلامتهم.
تحسين الأساطيل والمسارات
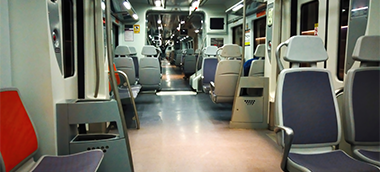
تحسين المساحات المخصّصة لأمتعة الركاب
خفض التكاليف
زيادة الإيرادات من الإعلانات داخل المركبات
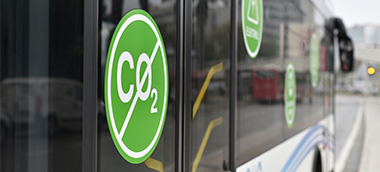
نقل صديق للبيئة ومستدام

أنظمة دفع وتذاكر محكومة
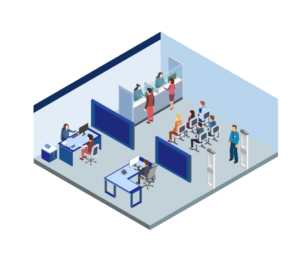
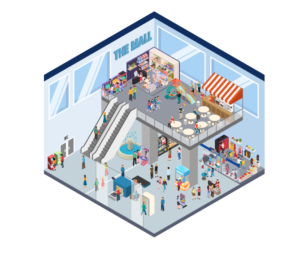
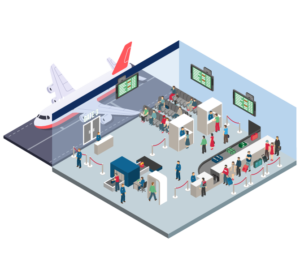
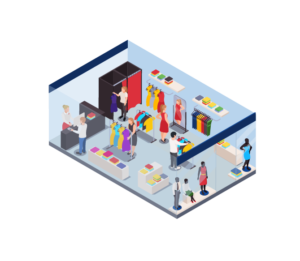
القطاعات التي نخدمها

ما الذي يقيسه نظام العدّ الآلي للركاب (APC)
نظام العدّ الآلي للركاب هو مجموعة من المستشعرات العلوية وبرمجيات التحليل التي تسجّل عدد الأشخاص الذين يصعدون إلى المركبة وينزلون منها، ووقت ذلك بدقة. وعلى خلاف بوابة تحصيل الأجرة أو جهاز التحقق من التذاكر، يسجّل عدّاد الركاب كل شخص يعبر خط الباب: حاملي الاشتراكات الموسمية، وركاب التحويل، والأطفال الذين يسافرون مجانًا، والموظفين، والركاب الذين لا يلمسون جهاز التحقق مطلقًا. والنتيجة عدد ركاب مستمر يمكن للمخططين اعتماده مصدرًا موثوقًا للحقيقة، بدلًا من رقم للطلب يُستنتج من الإيرادات.
يقدّم نشر نظام APC المتكامل تقارير عن خمسة أمور:
- الصعود والنزول لكل باب ولكل موقف. يُعدّ كل مدخل على حدة، فتتمكن من معرفة الباب الذي يتحمّل الحمل الأكبر، والمواقف التي تشهد أكبر قدر من تبادل الركاب، والمواضع التي يختلّ فيها توازن التدفق على امتداد الخط.
- معامل الحمولة. الإجمالي الجاري للركاب على متن المركبة مقيسًا إلى سعتها من المقاعد وأماكن الوقوف، ويُعبَّر عنه لكل مقطع بين موقفين بدلًا من متوسط واحد للرحلة.
- الإشغال لكل مركبة. رقم مباشر لعدد الركاب على متن المركبة يعمل بمثابة عدّاد إشغال لوسائل النقل — أي مدى امتلاء هذه الحافلة أو العربة أو الترام أو العبّارة في هذه اللحظة، جاهزًا للعرض في غرفة التحكم أو على شاشة الرصيف أو في تطبيق الركاب.
- زمن التوقف في المواقف. المدة التي تبقى فيها الأبواب مفتوحة ومدى ارتباطها بعدد الركاب الصاعدين والنازلين، وهو عادةً أول ما يُنظر إليه عندما يتأخر خطٌّ عن مواعيده.
- التحويلات وتدفق التبديل بين الخطوط. عند دمج مستشعرات المحطات والأرصفة مع أعداد الركاب داخل المركبات، يمكنك تتبّع تنقّل الركاب بين الخطوط ووسائل النقل المختلفة بدلًا من التعامل مع كل مركبة كعدٍّ منفصل.
خيارات عدّادات الركاب الآلية (APC): أين تُركَّب المستشعرات
تُركَّب عدّادات الركاب الآلية في الأعلى، موجّهةً عموديًا إلى الأسفل نحو العتبة التي يعبرها الأشخاص. ويتبع موضع التركيب حركة الأشخاص لا نوع المركبة، ولهذا تغطي عائلة المستشعرات نفسها أسطول المركبات والبنية التحتية الثابتة على حدٍّ سواء.
- أبواب المركبات. مستشعر واحد فوق كل مدخل في الحافلات والترام وعربات المترو والقطارات الإقليمية والعبّارات. فالعدّ لكل باب هو ما يتيح الفصل بين الصعود والنزول؛ أما المستشعر الواحد في مركبة متعددة الأبواب فلن يمنحك إلا عددًا جزئيًا للركاب.
- مداخل المحطات ومباني الركاب. توفّر المستشعرات المثبتة على البوابات ومداخل الردهات وحدود المناطق المدفوعة أعداد المارّة على مستوى المحطة، وهي أعداد لا تستطيع العدّادات داخل المركبات رصدها، بمن في ذلك الأشخاص الذين يدخلون للقاء أحدٍ ما أو لاستخدام المتاجر.
- الأرصفة ومناطق الانتظار. يوفّر عدّ الداخلين إلى الرصيف والخارجين منه رقمًا مباشرًا للحشود على الرصيف نفسه، وهو الرقم الذي يهمّ فرق السلامة عند حدوث اضطراب في الخدمة.
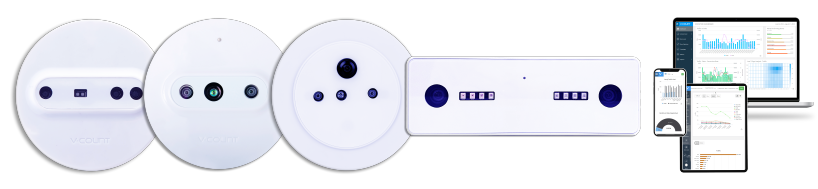
يعتمد جهاز V-Count المناسب على البيئة. Nano AI هو المستشعر المزوّد بالذكاء الاصطناعي، ويُستخدم حيث يكون المشهد معقدًا وتحتاج إلى تصنيف ما يمرّ على الجهاز نفسه. أما Nano Prime فهو مستشعر ستيريو ثلاثي الأبعاد مخصّص للعتبات ذات الحركة الكثيفة، مثل أبواب المركبات المزدحمة وخطوط البوابات. وللحصول على رقم إشغال مباشر مع حدود وتنبيهات بدلًا من عدٍّ تاريخي، يحوّل VCare بيانات المستشعرات نفسها إلى شاشة لعرض الإشغال في الوقت الفعلي. وترسل جميعها بياناتها إلى BoostBI، حيث تتحول الأعداد إلى تقارير حسب الخط والموقف والمركبة. والمنهجية الأساسية هي نفسها الموضّحة في صفحتنا المحورية حول عدّ الأشخاص، مطبّقةً على مركبة متحركة بدلًا من باب متجر.
عادةً ما يبدأ مشغّلو النقل بخط واحد أو مستودع واحد قبل التعميم على الأسطول بأكمله. تعرّف على كيفية نشر هذا الحل في شبكات النقل، وفي المطارات حيث يكتسب العدّ في مباني الركاب وعند البوابات أهمية لا تقل عن الطائرة نفسها.
8 فوائد للعدّ الآلي للركاب
لا تغطي المسوح اليدوية بالورقة والقلم سوى عيّنة من بضع رحلات في السنة، ولا تخبرك إلا بما حدث في الأيام التي كان فيها أحدٌ على متن المركبة يتولى العدّ. أما عدّادات الركاب الآلية فتعمل في كل رحلة، وهو ما يغيّر المجالات التي يمكن استخدام البيانات فيها.
1. بيانات إشغال يمكنك التصرف بناءً عليها خلال الوردية نفسها
تتيح الأرقام المباشرة للركاب على متن المركبات لغرفة التحكم إضافة مركبة إلى رحلة مزدحمة أو سحب مركبة إضافية من رحلة هادئة بينما لا تزال ذروة الحركة قائمة، بدلًا من اكتشاف الخلل في تقرير الشهر التالي.
2. سعة مركبات تتوافق مع الطلب الفعلي
تُظهر الأعداد المسجّلة على المدى الطويل عدد الوحدات التي يحتاجها الخط فعليًا في كل ساعة من ساعات اليوم. وهذا ما يحدد عدد العربات التي يجب ربطها، والخطوط التي تُخصَّص لها الحافلات المفصلية، وكيفية توزيع العمر التشغيلي للمركبات على الأسطول.
3. خطوط وجداول مواعيد مبنية على أنماط الصعود
تكشف بيانات الصعود والنزول على مستوى المواقف المقاطعَ التي يمتلئ فيها الخط ويفرغ. ويمكن بعد ذلك مناقشة المواعيد والمسافات بين المواقف وتقسيم الخطوط استنادًا إلى حركة تبادل الركاب المقيسة بدلًا من الشكاوى.
4. مساحات مخططة للأمتعة والكراسي المتحركة والدراجات
يميّز الاستشعار على مستوى الباب بين الأشخاص والأشياء التي تتحرك معهم، بحيث يمكن تحديد التصميم الداخلي وتوفير المنحدرات ومساحات الأمتعة وفقًا لما يُنقل فعليًا على خط معيّن.
5. تكلفة أقل لكل راكب منقول
إن معرفة الحمولة على كل مقطع تعني إمكانية تقليص الخدمة حيث لا تُستخدم فعلًا والحفاظ عليها حيث تُستخدم. فيصبح خفض التكاليف قرارًا قائمًا على القياس بدلًا من تخفيض شامل.
6. أرقام يمكن الدفاع عنها للإعلانات على متن المركبات
يدفع المعلنون مقابل الظهور أمام الجمهور. وتتيح أعداد الركاب الموثّقة حسب الخط والمركبة والفترة الزمنية للمشغّل تسعير الإعلانات داخل المركبات وفي المحطات استنادًا إلى الأدلة، كما تتيح للمشترين اختيار الخطوط التي تحقق مستوى الإشغال الذي يريدونه.
7. التحقق من التذاكر ومطابقة إيرادات الأجرة
تكشف مقارنة أعداد الركاب المعدودين بالتذاكر التي جرى التحقق منها في الرحلة نفسها المواضعَ التي يختلف فيها الرقمان. وتشير الفجوات المستمرة إلى التهرب من دفع الأجرة، أو جهاز تحقق معطّل، أو فئة من المستفيدين من التخفيضات لا يسجّلها أحد.
8. رحلات أكثر أمانًا وراحة
الازدحام مسألة تتعلق بالسلامة على الأرصفة، وبالاحتفاظ بالركاب داخل المركبات. ويمنح حدّ السعة المقترن بتنبيه الموظفين أساسًا للتصرف قبل أن يصبح الرصيف أو العربة غير آمنين.
بيانات عدّ الركاب للمخططين والمشغّلين
تُقرأ مجموعة البيانات نفسها بطرق مختلفة بحسب الجهة التي تستخدمها. وتغطي أربعة استخدامات معظم ما تطلبه هيئات النقل ومشغّلوه.
تصميم جداول المواعيد
يحتاج المخططون إلى بيانات الصعود والنزول حسب الموقف ونوع اليوم والفترة الزمنية. فهذا ما يُظهر ما إذا كان الفاصل الزمني بين الرحلات البالغ 12 دقيقة سخيًا عند الساعة 10:00 وغير كافٍ عند الساعة 17:30، وما إذا كان ينبغي تقسيم الخط أو تمديده أو تشغيله على جزء منه فقط. ولأن عدّادات الركاب الآلية تعمل باستمرار، تظهر التباينات الموسمية وتلك المرتبطة بالفصول الدراسية في البيانات بدلًا من تقديرها تخمينًا.
توزيع الأسطول
يُطلع معامل الحمولة حسب المقطع مخططي المستودعات على نوبات التشغيل التي تحتاج إلى مركبات عالية السعة. كما أن مواءمة حجم المركبة مع الطلب المقيس تحرّر وحدات للخطوط التي تتجاوز سعتها فعليًا، وتقلّل عدد المركبات الكبيرة شبه الفارغة التي تعمل خارج أوقات الذروة.
مطابقة إيرادات الأجرة
يجيب عدد الركاب وعدد التذاكر عن سؤالين مختلفين، والفرق بينهما معلومة بحدّ ذاته. وتدعم مطابقة الرقمين لكل رحلة حماية الإيرادات، وتحسم تقاسم الإيرادات بين المشغّلين الذين يتشاركون الشبكة نفسها، وتمنح برامج التخفيضات والسفر المجاني رقمًا لأعداد الركاب يمكن الدفاع عنه لتُحتسب التعويضات على أساسه.
إدارة السلامة والسعة
تعمل فرق التشغيل وفق حدود محددة: سعة قصوى عند الازدحام الشديد لكل عربة، وعدد آمن للوقوف على كل رصيف. ويؤدي ربط بيانات الإشغال المباشرة بحدٍّ مقترن بتنبيه إلى تحويل هذه الحدود إلى أمر يمكن لغرفة التحكم فرضه، ويترك سجلًا قابلًا للتدقيق لمدى امتلاء الشبكة عند وقوع أي حادث.
إذا كنت تريد هذه التقارير لشبكتك، يمكنك طلب عرض توضيحي وسنستعرض معك الأعداد على خط مشابه لخطك.

اشترك في نشرتنا الإخبارية
في بيئة أعمال سريعة التطوّر، لم يَعُد الاطّلاع مجرّد ميزة — بل ضرورة. اشترك لتبقى دائمًا في طليعة المعرفة بقطاع تحليلات الزوّار.