BoostBI: Footfall Analytics Software & Shopper Analytics Platform

نظرة عامة

Bring visitor counts, store performance and weekly AI coaching into one view.

BoostBI is V-Count’s retail analytics platform for physical locations. Compare footfall across stores, connect sales data to measure conversion, and use weekly AI Sales Coach suggestions to plan your next action.

مزايا BoostBI

19 لغة

19 لغة

English, Spanish, Turkish and 16 more languages.

View all 19 languages

English, Spanish, French, Danish, Norwegian, Chinese, Persian, Turkish, Vietnamese, Bulgarian, Russian, Portuguese, Serbian, Japanese, Arabic, Swedish, Italian, Thai and Polish.

سهل الاستخدام

سهل الاستخدام

Access store reporting through BoostBI’s web platform and mobile app.

مستويات المستخدمين

مستويات المستخدمين

لوحات تحكّم مخصّصة لأدوار مختلفة، من المستوى التنفيذي إلى مستوى المتجر.
قابل للتخصيص

قابل للتخصيص

لوحات تحكّم مخصّصة للحصول على رؤى حول أهمّ المؤشّرات الخاصة بنشاطك وقطاعك.

Reporting Refresh

Reporting Refresh

Typically every 10 minutes; as frequent as every minute with real-time updating enabled.

تقارير آلية

تقارير آلية

أنشئ تقارير آلية مخصّصة وسهلة الاستخدام لكل موظف بحسب دوره ومستواه.
آمن

آمن

أمان سحابي أمثل ونسخ احتياطي للبيانات

Connected Reporting

Connected Reporting

Shopify, Nebim, VendPOS, Nayax, ImagineX and QuickBooks integrations, plus custom REST API connections for compatible systems.

BoostBI – حيث تلتقي بيانات حركة الزوّار بالتنقّل

اطّلع على بيانات تحليلات زوّارك في أي وقت ومن أي مكان!

بسّط الوصول إلى بيانات زوّارك

Stay informed and make decisions on the go with BoostBI, V-Count’s footfall analytics software. This all-in-one mobile shopper analytics app is designed for dynamic retail managers. It allows them to monitor, analyze, and maximize the potential of their retail space.

وصول سهل. في أي مكان، وفي أي وقت.

If you travel frequently and are unable to remain at your computer, but still need to monitor your stores’ status, BoostBI offers a solution. It frees you from your desk, allowing you to track foot traffic, monitor performance, and utilize advanced footfall analytics, all from your mobile device.

بيانات لحظية في متناول يدك

  • دقيق Insights: اعتمد على بيانات حركة زوّار دقيقة ولحظية لفهم سلوك العملاء.
  • واجهة سهلة الاستخدام: تفاعل مع تطبيق بديهي بقدر ما هو قويّ.
  • إدارة عن بُعد: ابقَ مطّلعًا على عدّة مواقع دون أن تكون مقيّدًا بمكان واحد.

أبرز الفوائد

  • لوحات تحكّم شاملة: Monitor key retail analytics metrics at a glance.
  • دقيق عدّ الأشخاص: احصل على بيانات بالغة الدقة لاتخاذ قرارات أفضل.
  • إدارة مرنة: أدِر نشاطك التجاري من أي مكان وفي أي وقت.
  • عمليات أكثر سلاسة: استخدم رؤى قابلة للتنفيذ لتبسيط العمليات ورفع الكفاءة.

AI Sales Coach: weekly guidance for store managers

V-Count’s AI Sales Coach delivers targeted weekly coaching in BoostBI, curated from each store’s available performance data.

  1. ReviewReview the suggestions for your store.
  2. ActChoose a practical action for your team.
  3. TrackTrack the relevant KPI over a suitable follow-up period.

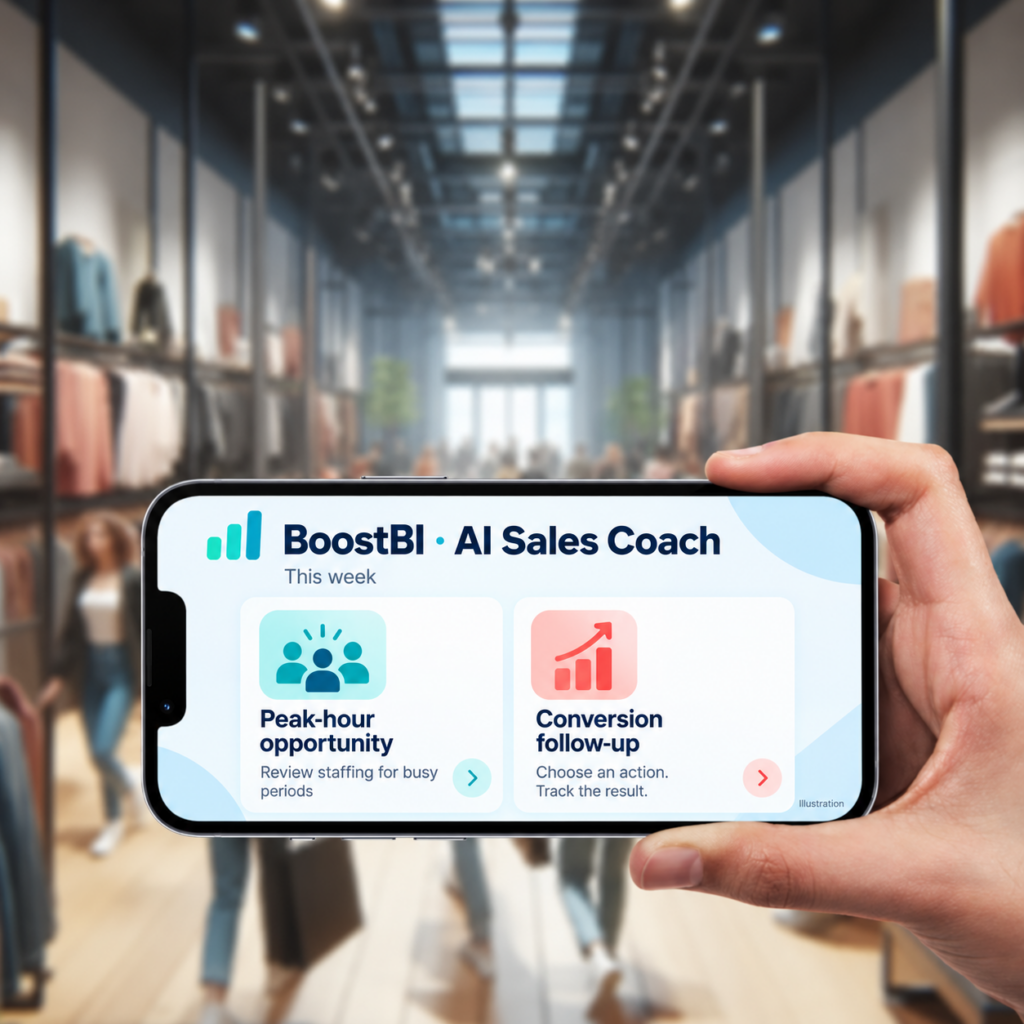
Illustration of V-Count BoostBI AI Sales Coach on a phone, showing peak-hour and conversion coaching cards.

تعرّف على BoostBI

تحليلات الزوّار لتعزيز كفاءة مواقعك الفعلية

لوحة تحليلات BoostBI تعرض بيانات حركة الزوّار والخرائط الحرارية وواجهة التقارير الفورية

Connect compatible people-counting data

Bring compatible visitor data from your physical locations into BoostBI. For an existing sensor estate, confirm each model, available data format and supported integration route before planning the connection.

V-Count will help map the required inputs and reports to your setup. Installation scope and integration timing depend on the hardware, connectivity and systems involved.

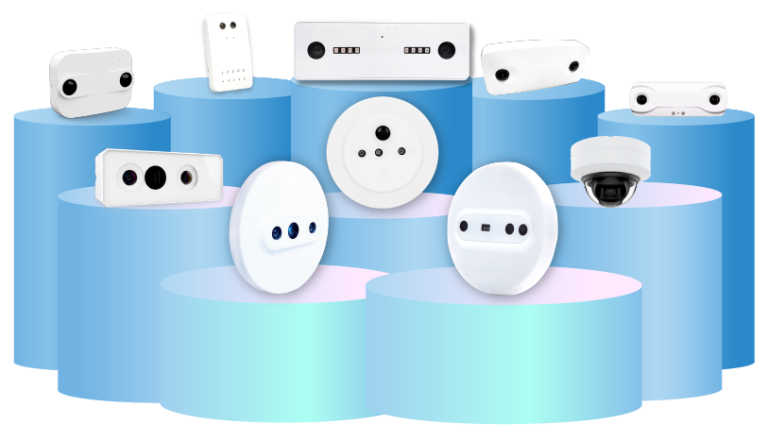
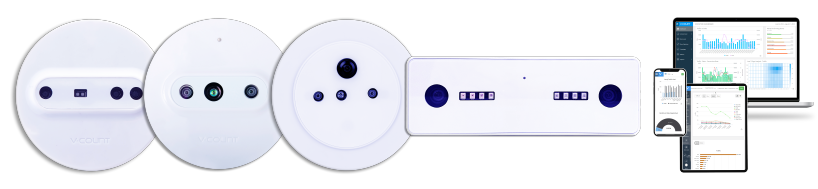
تشكيلة منتجات مستشعرات عدّ الأشخاص من V-Count بما في ذلك Nano AI وNano Prime وNano Outdoor

تكاملات API

Connect BoostBI with your retail systems through available integrations or a scoped API project.

Available integrations

Connect your retail systems

ShopifyNebimVendPOSNayaxImagineXQuickBooks

Shopify and Nebim have native connectors. VendPOS, Nayax, ImagineX and QuickBooks integrations are also currently working with V-Count’s BoostBI.

Confirm during setup

Supported versions, account access, field mapping and import timing.

Custom integration

واجهة REST API مفتوحة

POSERPBI

Connect other compatible POS, ERP and BI systems through a scoped API project. V-Count provides REST API documentation covering the available integration interface.

Agree before implementation

Data direction, supported fields, scheduling and support responsibilities.

Manual sales importSales data can also be imported manually.
API accessA selected sublicence within your quoted BoostBI package.

Explore BoostBI

Bring your store performance into focus

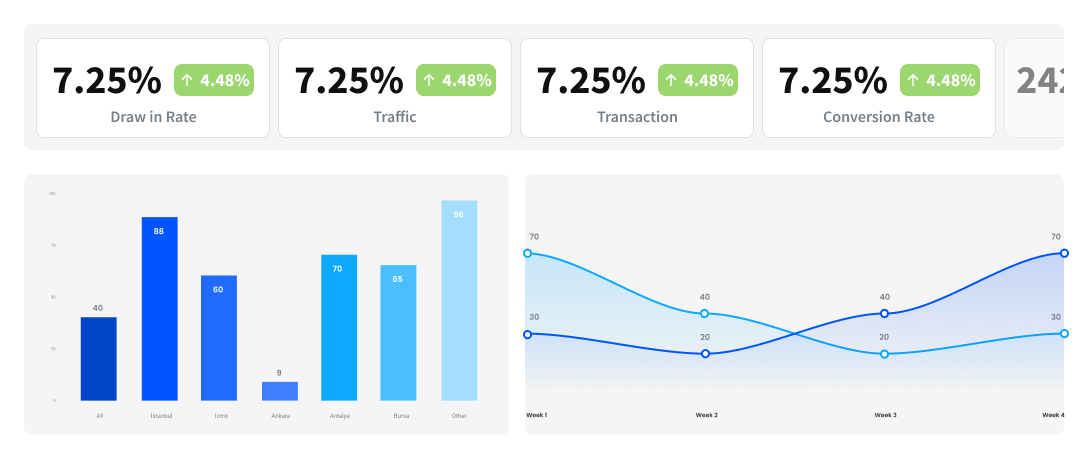
Review footfall alongside store conversion, queue trends and weekly coaching. Start with the store filter, reporting dates and the definition behind each metric, then decide which action to take.

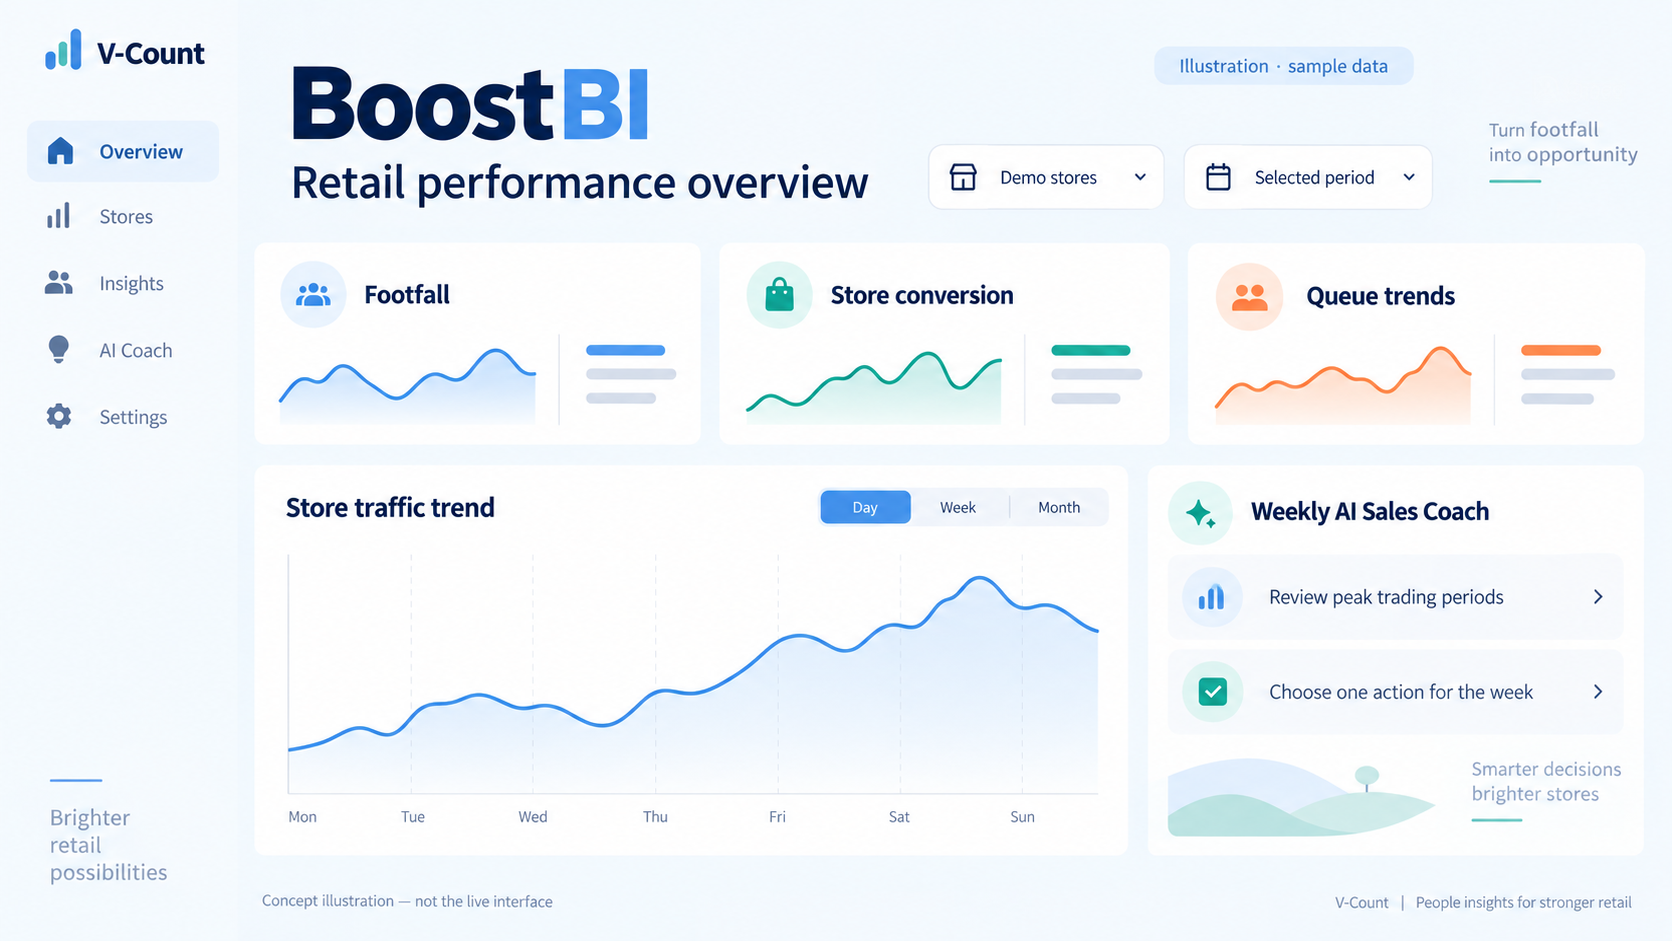
Illustrative BoostBI dashboard concept showing footfall, store conversion, queue trends and weekly AI Sales Coach, using sample data

BoostBI capability matrix

Choose the reports you need. An entrance counter does not automatically provide every in-store measurement.

Reporting refresh: typically every 10 minutes, with updates as frequent as every minute when real-time updating is enabled. This describes reporting freshness; sensor sampling, report aggregation and POS imports are separate. AI Sales Coach delivers weekly coaching.
Match the report to its data source, sensor and selected BoostBI licences.
ReportInputCompatible sensorRefresh cadenceData exportIntegration method
Footfall by location and periodDirectional entrance counts; agreed opening hours and exclusions.Nano AI at validated entrances.Typically 10 minutes; as frequent as 1 minute with real-time updating enabled.REST API with the selected API licence; fields and aggregation defined in the documentation.V-Count sensor connection to BoostBI.
OccupancyEntries and exits for all monitored access points; agreed starting occupancy and reset rule.Nano AI; coverage of all relevant entrances and exits.As frequent as 1 minute with real-time updating enabled; standard reporting is typically 10 minutes.Check supported occupancy fields and granularity in the REST API documentation.V-Count sensor connection; venue configuration required.
Sales and store conversionEligible visits plus POS transaction counts for the same store and time period. Add sales value for revenue metrics.Nano AI for visitor counts, plus an external POS data source.Typically 10-minute reporting, or as frequent as 1 minute when enabled; sales freshness also depends on POS import timing.REST API; check availability of raw inputs versus calculated conversion fields.Shopify, Nebim, VendPOS, Nayax, ImagineX or QuickBooks integration; manual sales import; custom REST API.
Staff-excluded visitor countsVisitor counts with the selected staff-exclusion method configured and validated.Nano AI with the staff-exclusion sublicence selected.Follows the configured reporting refresh: typically 10 minutes; as frequent as 1 minute when enabled.Check whether the selected REST API field contains raw or staff-excluded traffic.V-Count staff-exclusion configuration within the selected BoostBI package.
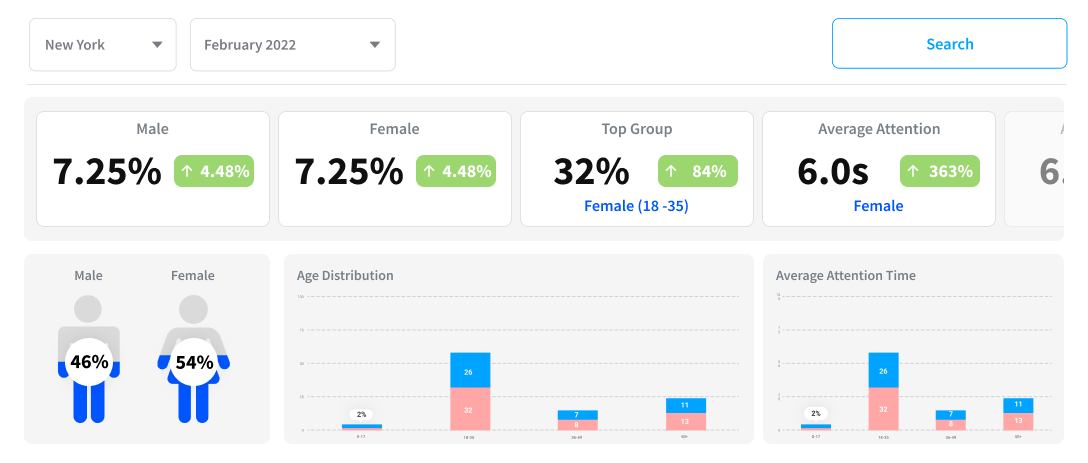
Gender and age reportingAggregate gender and age estimates generated by the compatible sensor.Nano AI with demographics selected.Typically 10-minute reporting; real-time configuration can update as frequently as 1 minute.Refer to the REST API documentation for available demographic fields and time buckets.V-Count sensor connection with demographics enabled.
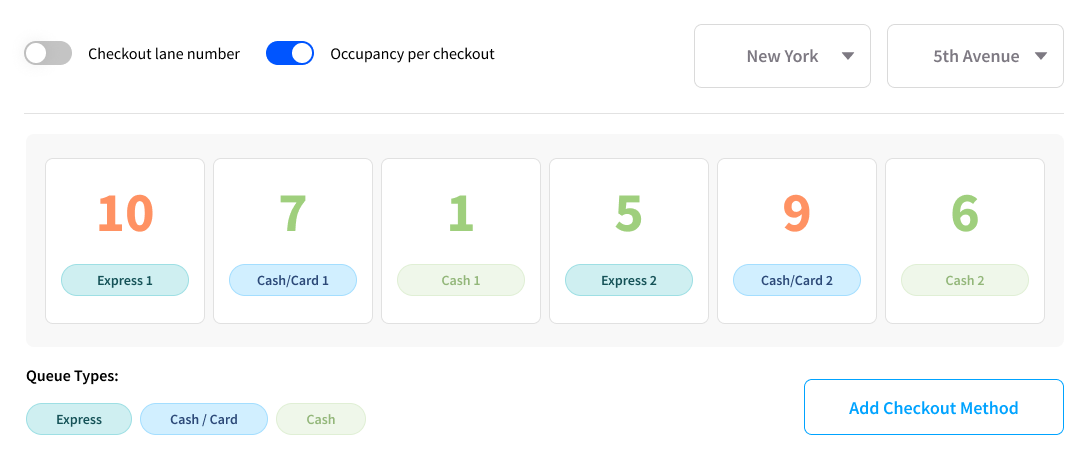
Queue reportingDefined queue zones, queue counts and waiting-time measurements.Nano AI with queue analytics selected; placement and zone coverage must be validated.Typically 10-minute reporting; as frequent as 1 minute with real-time updating enabled.Queue-data export by API; choose supported fields and time buckets from the documentation.V-Count queue configuration; sales correlation can use a connector or manual/API import.
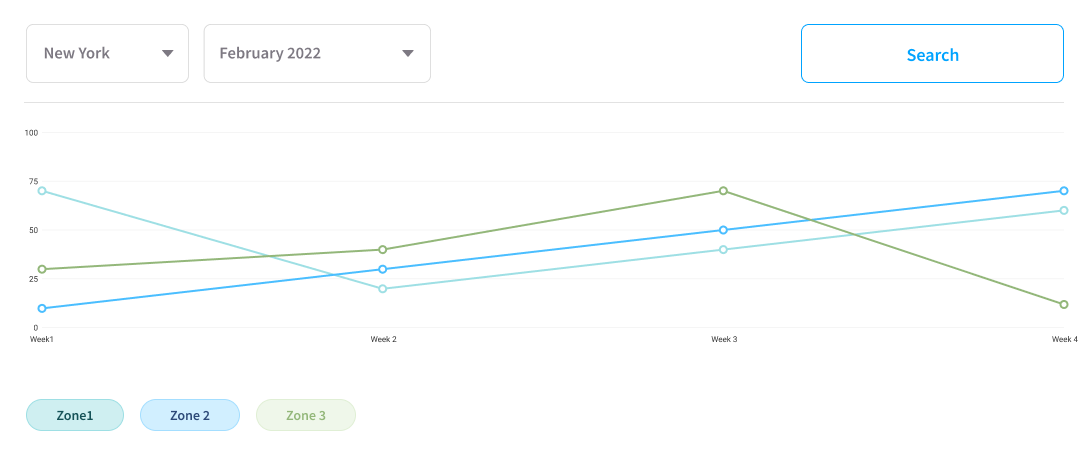
Heatmaps and zone analyticsMapped floor plan, defined zones, observed visitor movement and dwell measurements.Nano Prime with heatmap/zone analytics selected.Typically 10-minute reporting; as frequent as 1 minute when enabled. The selected analysis period determines the heatmap view.Zone-data export by API.V-Count sensor connection plus floor-plan and zone configuration.
AI Sales CoachAvailable store performance data in BoostBI.Uses data already available in BoostBI; no separate coaching sensor.Weekly coaching.Review coaching in BoostBI; discuss any separate coaching-export requirement with V-Count.Built-in BoostBI module providing targeted suggestions for store managers.

Report availability depends on the selected package and deployment. API access, staff exclusion, demographics, queue analytics and heatmaps are selected sublicences within the quoted BoostBI price.

Sensor references: Nano AI · Nano Prime · queue measurement.

Three practical BoostBI workflows

Compare store traffic with sales

Validate the entrance counts, define eligible visits and import the matching POS transaction totals. Align store identifiers, opening hours, time zones and exclusions before calculating conversion.

Read the conversion measurement guide →

Review queues and store layout

Use queue reporting to identify periods that need an operational review. Use Nano Prime zone and heatmap measurements to compare visits and dwell around a defined area. Check equivalent trading periods and the sensor’s coverage before changing staffing or a display.

Observed movement can show where people travelled or stayed. It cannot, by itself, establish purchase intent or prove why a shopper left. Evaluate the change against a defined measure and record other influences such as promotions or opening hours.

Explore physical-store heatmap measurement →

Turn weekly reporting into a manager action

V-Count’s AI Sales Coach provides weekly, targeted coaching in BoostBI based on the store’s available data. Review a suggestion, choose one action, record when it starts and compare the relevant KPI over a suitable follow-up period. Coaching supports the manager’s judgement; an uplift depends on the action, trading conditions and data quality.

Plan your deployment and data connection

Sensor and account setup

Choose the correct sensor for each report. Validate mounting position, coverage and counting lines or zones.

Power and connectivity

Follow the current model’s installation requirements. Nano AI’s published product page describes 5V USB-C power, Wi-Fi connectivity and an optional external PoE splitter. Do not apply those details to every model.

Sales and API mapping

Provide store IDs, time zones, the trading calendar and the agreed sales/transaction definitions. For API work, obtain the current access and authentication instructions, field definitions and integration limits from V-Count.

Agree the data timing: BoostBI typically refreshes every 10 minutes; enabled real-time configurations can update as frequently as every minute. Match the chosen setting to the operational use case, and align the POS import schedule and report period so traffic is compared with corresponding sales totals.

Before launch, reconcile a sample period with a manual traffic check and the source POS totals. Agree how the integration will identify missing data, avoid duplicate imports and handle late corrections. Request the model-specific network requirements and the current API setup guide from V-Count’s technical team.

V-Count describes on-device processing for compatible sensors and the transfer of analytics outputs to its platform. Review the selected hardware, data flows, account permissions, retention terms and any sales or loyalty data integration for your deployment. Technical features alone do not determine an organisation’s regulatory obligations.

Choose the BoostBI package for your reports

BoostBI is priced at US$9–49 per sensor per month, depending on the selected package and sublicences. API access, staff exclusion, demographics, queues and heatmaps are included within the BoostBI price. Sensor hardware is quoted separately.

For a useful quote, share your number of locations and sensors, required reports, existing POS or BI system, and reporting frequency.

What visitor analytics software does

Visitor analytics software turns anonymous movement through a physical space into numbers a team can act on. In V-Count’s system the sensors do the measuring and BoostBI does the thinking: Nano AI, Nano Outdoor and Nano Prime produce the counts at the door and inside the space, and BoostBI stores, aggregates and reports them as a single shopper analytics platform.

If you are comparing visitor analytics solutions, this is the checklist most buyers work through, and how each item behaves in BoostBI.

  • Footfall. Entries and exits per entrance, per hour and per day, with separate lines for each door so a mall entrance and a car-park entrance are never blended. This is the base layer of any people counting deployment and the reason footfall analytics software exists.
  • Conversion. Visits measured against transactions imported from your POS, so a quiet day with strong selling and a busy day with weak selling stop looking the same in the report. See retail store analytics for how the sales side is mapped.
  • Dwell time. How long visitors stay overall, and how long they linger in a specific area, which separates browsing from genuine interest.
  • Zone analytics. Counts and heat patterns for defined areas — entrance, promotional table, fitting rooms, a specific aisle — so layout decisions are made on observed movement. This is covered by heatmap and zone analytics.
  • Queue measurement. Waiting-line length and waiting time at tills and service desks, which is the pairing between counting hardware and queue management.
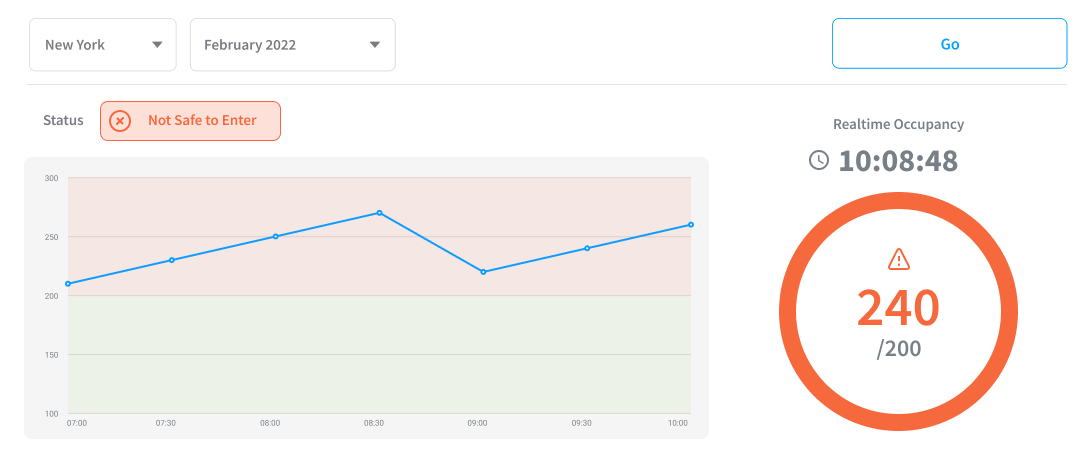
  • Occupancy. A live headcount of how many people are inside right now, derived from entries minus exits, for capacity rules, safety limits and space planning.
  • Demographics. Anonymous estimated age band and gender distribution of visitors, produced by gender and age recognition, used to check whether the people in the store match the people the range was bought for.
  • Alerts. Threshold and schedule-based notifications — occupancy above a limit, a queue past an agreed wait, a sensor that stopped reporting — delivered without anyone watching a dashboard.
  • Benchmarks. Store against store, region against region, this period against the same period last year, so a manager can see whether a result is a local problem or a chain-wide pattern.
  • Multi-site roll-ups. One estate-level view that totals every location, with the ability to drill from group to region to a single door.
  • API and exports. Scheduled exports and API access so the same visitor counts can sit inside the BI tool, data warehouse or workforce system your business already runs on.

The practical value of visitor analytics software is not the individual number but the comparison. Footfall on its own says how busy you were; footfall next to transactions, dwell, zone traffic and staffing is what produces usable store insights — which hour is under-staffed, which display is ignored, which entrance actually brings buyers rather than passers-by.

AI visitor analytics: what is actually automated

“AI visitor analytics” is used loosely, so it is worth separating the two places automation genuinely sits. The first is measurement: V-Count’s Nano AI sensor runs computer-vision models on the device itself to decide what is a person and what is a shopping trolley, a reflection or a shadow.

That is the AI doing the counting, and it happens before any data reaches the platform. The second is interpretation — what a BI layer can do with a long, clean history of counts.

The capabilities below are the ones worth expecting from a modern shopper analytics platform; treat them as what the category can do rather than as a promise of a specific number.

Anomaly alerts

Once a location has enough history, a platform can learn what a normal Tuesday afternoon looks like for that specific door and flag the days that do not fit — a sudden drop that usually means a sensor fault or a blocked entrance, or a spike that means a local event nobody told head office about. The value is that the exception finds you, instead of waiting for someone to open a report.

Forecasts and expected ranges

Historic footfall is seasonal and highly repetitive, which makes it well suited to forecasting. A visitor analytics platform can project an expected range for the coming days or weeks from the same store’s past pattern, then show actuals against that range. Forecasts can be wrong — weather, promotions and roadworks are not in the data — so they are best used as a planning baseline, not a commitment.

Staffing suggestions

If the system holds hourly traffic and hourly transactions, it can point at the hours where conversion falls while traffic stays high, which is the usual signature of too few people on the floor. BoostBI’s AI Sales Coach is the version of this on this platform: a weekly summary that turns the week’s numbers into a short set of suggested actions for a store manager, rather than another chart to interpret.

What is not automated

No visitor analytics solution decides your range, your pricing or your rota for you. It narrows where to look and removes the argument about what happened; the judgement about why, and what to change, stays with the retail team. Any vendor describing more than that is describing a decision-support tool in ambitious language.

Visitor analytics solutions by venue type

The sensors are largely the same across venues. What changes is which zones you bother to count, which KPI the site is actually judged on, and who reads the report.

Retail stores

A store is judged on conversion, so the pairing that matters is traffic against transactions, then dwell and zone data to explain the gap. Counting the entrance is the minimum; counting the fitting rooms, the promotional area and the till line is what makes the number diagnostic.

Chains typically add a multi-site roll-up so underperforming branches surface without anyone opening twenty dashboards. The detail for this venue type sits on the retail store analytics page.

Shopping malls

Malls measure for two audiences at once: their own operations team and their tenants. That means entrance counts per door, common-area and corridor traffic, capture rate between the mall and individual units, and occupancy for safety and event planning. Leasing conversations change when a landlord can show measured passing traffic for a unit rather than an estimate. See people counting for shopping malls.

Events and exhibitions

An event is a short, dense measurement window with no second chance, so the setup has to be right on day one. Organisers usually want total attendance, per-hall and per-stand traffic, dwell at individual stands and peak occupancy against the venue limit — numbers that become exhibitor evidence and next year’s floorplan. See events, exhibitions and trade show analytics.

Libraries and museums

Here there is no transaction to convert, so the KPI moves to visits, dwell and space utilisation: which rooms and study areas fill up, at what hours, and whether opening hours or staffing match actual demand. Counts also support funding and reporting obligations, which is why accuracy and a defensible method matter as much as the dashboard. See visitor counting for libraries and museums.

Transport hubs

Stations, terminals and interchanges measure flow rather than shopping: passenger volumes by entrance and platform, crowding and occupancy in concourses, and queue length at security, ticketing and boarding. Conditions are harsh and coverage areas are wide, which is where outdoor-rated and 3D stereo sensing options matter more than reporting features. See transportation and transit counting.

Case-study style: what a store insights review looks like

Imagine a fashion retailer with a group of stores, sensors on every entrance, zone counting in three areas per store and POS data connected to BoostBI. A monthly store insights review would run roughly like this.

  1. Start at the estate, not the store. Open the multi-site roll-up and sort stores by conversion rather than by sales. Sales rank tells you which store is biggest; conversion rank tells you which store is wasting the traffic it already has. The bottom of that list is your review list.
  2. Split traffic from performance. For each store on the list, ask whether footfall fell or conversion fell. A footfall problem is usually external — the location, the centre, the season, a road closure — and is answered with marketing or landlord conversations. A conversion problem is internal and is answered inside the store.
  3. Go to the hour. Pull the hourly view for a weak store and compare traffic curves with conversion curves. The pattern people most often find is a conversion dip that lines up with the busiest hours, which points at coverage rather than demand.
  4. Check the rota against the curve. Lay the staffing schedule over the hourly traffic. Shifts are frequently built around opening hours and break logistics rather than around when customers actually arrive, and that mismatch is visible the moment the two are on the same axis.
  5. Look inside the store. Use zone and heatmap data to see whether visitors reach the areas the store is being judged on. A promotional zone with high traffic and low dwell suggests the display is passed but not engaging; high dwell with weak conversion suggests interest that is not being closed.
  6. Check the queue. If waiting time climbs in the same hours conversion drops, the problem may be at the till rather than on the floor — a fixable operational issue that footfall alone would never reveal.
  7. Sanity-check the audience. Anonymous demographic distribution shows whether the people entering resemble the customer the range and marketing were built for. A persistent mismatch is a merchandising question, not a store-team question.
  8. Change one thing and re-measure. Agree a single action per store — a shift moved, a display relocated, a second till opened at a set hour — then compare the following period against the same period before the change and against stores where nothing changed. The control group is what keeps the review honest.

Two things make this kind of review work in practice. First, comparison discipline: a number is only evidence when it sits next to a baseline, a benchmark or an unchanged store.

Second, one change at a time — estates that adjust staffing, layout and promotions in the same week can never attribute the result. If you would like to see this run against your own data, book a BoostBI demo and bring one underperforming store with you.

Visitor analytics FAQ

What is AI visitor analytics, and how is it different from ordinary people counting?

People counting answers how many. AI visitor analytics adds two things on top. At the sensor, computer-vision models running on the device distinguish people from trolleys, reflections and staff, which is what makes the count reliable enough to build decisions on. At the platform, the same history can be used for anomaly alerts, forecast ranges and suggested actions such as BoostBI’s weekly AI Sales Coach summary. It is decision support, not automation of the decision itself: the system narrows where to look, your team still decides what to change.

Which visitor analytics solutions suit a multi-site estate?

For more than a handful of sites, three things matter more than dashboard design. First, identical measurement everywhere, so stores are genuinely comparable — mixed hardware and mixed counting rules make a roll-up meaningless. Second, hierarchy: group, region, store and individual door, so a head-office view drills down without switching tools. Third, exceptions by alert rather than by report, because nobody opens fifty dashboards. BoostBI is built around this pattern, with estate-level roll-ups, store-versus-store benchmarks and threshold alerts on V-Count sensors deployed consistently across sites.

Can we export BoostBI visitor analytics data into our own BI tools?

Yes. BoostBI provides API access and data exports so footfall, dwell, zone, queue and occupancy figures can be pulled into the data warehouse or BI tool your business already uses, and joined with sales, labour or loyalty data there. Most teams use BoostBI as the operational reporting layer for store managers while central analytics pulls the same figures through the API, which avoids two versions of the truth. Bring your integration requirements to a demo and we will confirm the fields and refresh timing for your setup.

What is a retail intelligence platform, and what does BoostBI provide?

A retail intelligence platform brings retail data together to help teams understand performance and decide what to review or change. V-Count’s BoostBI focuses on physical-location visitor analytics, combining compatible sensor data, store reporting and sales comparison.

Available reports depend on the sensors, inputs and licences selected, including footfall, occupancy, conversion, staff exclusion, demographics, queues and heatmaps. Its AI Sales Coach provides targeted weekly guidance for store managers from each store’s available performance data.

How does BoostBI integrate with POS and other retail systems?

V-Count’s BoostBI supports native Shopify and Nebim connectors, with working integrations for VendPOS, Nayax, ImagineX and QuickBooks. Sales data can also be imported manually. Other compatible POS, ERP and BI connections can be scoped through the open REST API, for which V-Count provides documentation.

Confirm supported versions, authentication, store IDs, field mapping, data direction and import timing during setup. Loyalty or inventory data requirements need separate compatibility review. API access is a selected sublicence within the quoted BoostBI package.


تشكيلة منتجات مستشعرات عدّ الأشخاص من V-Count

لنعمل turn insights into income معًا!

Privacy-focused processing

Review the data flow for your deployment

V-Count describes on-device processing for compatible sensors and the transfer of analytics outputs to BoostBI. Review the selected hardware, data flows, account permissions and retention terms for your deployment.

POS, loyalty or inventory integrations can introduce additional data responsibilities. Configure those connections for the data you need and review the applicable requirements with your team.

اشترك في نشرة V-Count الإخبارية للحصول على رؤى وتحديثات تحليلات التجزئة

اشترك في نشرتنا الإخبارية

في بيئة أعمال سريعة التطوّر، لم يَعُد الاطّلاع مجرّد ميزة — بل ضرورة. اشترك لتبقى دائمًا في طليعة المعرفة بقطاع تحليلات الزوّار.

الأسئلة الشائعة

كل ما تحتاج معرفته عن زيادة الزوار والمبيعات والكفاءة مع V-Count.

ما تحليلات الزوار بالذكاء الاصطناعي، وكيف تختلف عن عدّ الأشخاص العادي؟
يجيب عدّ الأشخاص عن سؤال «كم». وتضيف تحليلات الزوار بالذكاء الاصطناعي أمرين فوق ذلك. على المستشعر، تميّز نماذج الرؤية الحاسوبية العاملة على الجهاز الأشخاص عن عربات التسوق والانعكاسات والموظفين، وهذا ما يجعل العد موثوقاً بما يكفي لبناء القرارات عليه. وعلى المنصة، يمكن استخدام السجل نفسه لتنبيهات الشذوذ ونطاقات التوقع والإجراءات المقترحة مثل ملخص AI Sales Coach الأسبوعي في BoostBI. إنه دعم للقرار لا أتمتة للقرار نفسه: يضيّق النظام مكان البحث، ويبقى فريقك من يقرر ما يجب تغييره.
أي حلول تحليلات الزوار تناسب شبكة متعددة المواقع؟
لأكثر من بضعة مواقع، تهم ثلاثة أمور أكثر من تصميم اللوحة. أولاً، قياس متطابق في كل مكان، لتكون المتاجر قابلة للمقارنة فعلاً – فالأجهزة المختلطة وقواعد العد المختلطة تجعل التجميع بلا معنى. ثانياً، التسلسل الهرمي: المجموعة والمنطقة والمتجر والباب الفردي، فينزل عرض المقر الرئيسي إلى التفاصيل دون تبديل الأدوات. ثالثاً، الاستثناءات عبر التنبيه لا عبر التقرير، لأن أحداً لا يفتح خمسين لوحة. بُني BoostBI حول هذا النمط، بتجميعات على مستوى الشبكة ومقارنات متجر بمتجر وتنبيهات حدود على مستشعرات V-Count المنشورة بشكل متسق عبر المواقع.
هل يمكننا تصدير بيانات تحليلات الزوار من BoostBI إلى أدوات ذكاء الأعمال لدينا؟
نعم. يوفر BoostBI وصولاً عبر واجهة برمجة التطبيقات وتصديرات للبيانات، فيمكن سحب أرقام الحركة ومدة البقاء والمناطق والطوابير والإشغال إلى مستودع البيانات أو أداة ذكاء الأعمال التي يستخدمها عملك بالفعل، ودمجها هناك مع بيانات المبيعات أو العمالة أو الولاء. تستخدم معظم الفرق BoostBI كطبقة تقارير تشغيلية لمديري المتاجر بينما تسحب التحليلات المركزية الأرقام نفسها عبر واجهة البرمجة، ما يتجنب نسختين من الحقيقة. أحضر متطلبات التكامل إلى عرض توضيحي وسنؤكد الحقول وتوقيت التحديث لإعدادك.
ما منصة ذكاء التجزئة، وماذا يوفر BoostBI؟
تجمع منصة ذكاء التجزئة بيانات التجزئة معاً لمساعدة الفرق على فهم الأداء وتحديد ما يجب مراجعته أو تغييره. يركز BoostBI من V-Count على تحليلات زوار المواقع الفعلية، فيجمع بيانات المستشعرات المتوافقة وتقارير المتاجر ومقارنة المبيعات. تعتمد التقارير المتاحة على المستشعرات والمدخلات والتراخيص المختارة، بما في ذلك الحركة والإشغال والتحويل واستبعاد الموظفين والتركيبة السكانية والطوابير والخرائط الحرارية. ويقدم AI Sales Coach توجيهاً أسبوعياً موجهاً لمديري المتاجر من بيانات الأداء المتاحة لكل متجر.
كيف يتكامل BoostBI مع أنظمة نقاط البيع وأنظمة التجزئة الأخرى؟
يدعم BoostBI من V-Count موصلات أصلية لـ Shopify وNebim، مع تكاملات عاملة لـ VendPOS وNayax وImagineX وQuickBooks. ويمكن أيضاً استيراد بيانات المبيعات يدوياً. ويمكن تحديد نطاق اتصالات نقاط البيع وتخطيط موارد المؤسسة وذكاء الأعمال المتوافقة الأخرى عبر واجهة REST المفتوحة، التي توفر V-Count توثيقها. أكّد الإصدارات المدعومة والمصادقة ومعرّفات المتاجر وربط الحقول واتجاه البيانات وتوقيت الاستيراد أثناء الإعداد. تحتاج متطلبات بيانات الولاء أو المخزون إلى مراجعة توافق منفصلة. الوصول إلى واجهة البرمجة ترخيص فرعي مختار ضمن حزمة BoostBI المعروضة.