Theme Parks
A theme park is a dozen venues in one: a parking lot, a ticket plaza, several themed lands, twenty or more ride queues, food courts, gift shops and a show arena that fills and empties in minutes. A theme park people counter placed at each of those thresholds turns that movement into numbers: gate throughput in fifteen-minute blocks, daily attendance, how many guests are standing in each land right now, and how long the line at the headline coaster really is.
V-Count’s theme park visitor analytics run on anonymous overhead sensors that count bodies rather than faces, indoors and outdoors, and feed every count into BoostBI so operations, food and beverage, marketing and safety teams all work from the same attendance figure instead of four different estimates.
Explore the gallery showcasing our diverse range of customers. We’re proud to work with these leading brands, providing visitor analytics solutions that drive their success.


















Benefits of Visitor Analytics for Theme Parks
Count every guest through the ticket plaza, the service and hotel gates and each land portal, so daily attendance and live park occupancy are measured rather than estimated. Hourly gate throughput shows whether rope drop is clearing fast enough and gives every department one attendance figure to plan against.
See which themed lands hold guests and which are only corridors. Zone-level traffic and dwell expose the pinch points on parade routes, the paths guests refuse to walk and the dead corners that need shade, a cart or better signage, before you commit capital to new walkways.
Count guests into each ride queue and out at the load platform to get a measured wait time instead of a guessed one. The same feed tells operations when to add a train, open a second load side, release virtual queue slots or redirect guests to a land the occupancy map shows is quiet.
Families arrive as a unit and are easily miscounted at a busy gate. Group counting keeps the attendance total honest when parties of four or five pass through together, so per-capita spend, capture rate and capacity figures for the park are built on a correct headcount.
Theme park visitor analytics: what to measure
Park attendance is not one number. Useful theme park visitor analytics break the day into the handful of counts that actually change a decision, and each one comes from a different sensor position.
- Gate throughput and daily attendance. Guests counted through the ticket plaza and every service or hotel gate, in fifteen-minute blocks. Throughput tells you whether the plaza is clearing fast enough on a rope-drop morning; attendance is the daily control total that finance, marketing and operations all reconcile against.
- Land and zone occupancy. Entry and exit counts on the walkways between themed lands give a live headcount per land. Occupancy, not attendance, is what tells you a land has filled up while the rest of the park is half empty.
- Ride queue length and wait time. Counting guests into and out of each queue line gives the number standing in it and the boarding rate, and those two together give a measured wait rather than a guessed one.
- Food, beverage and retail capture rate by zone. Divide door counts at each outlet by the occupancy of the land around it. A churro cart with high passing traffic and low capture is a pricing, signage or staffing problem, not a demand problem.
- Show and venue capacity counts. Theatres, stadium shows and character meet-and-greets need a hard in-and-out count per performance so you know when a house is full and how many guests you turned away.
- Parking-to-gate flow. Vehicles arrive long before guests reach the turnstiles. Counting guests leaving the lots and trams gives the gate team a warning of the wave that is coming.
- Dwell and re-entry. How long guests stay in each land, and how often they come back to it, shows whether a land is a destination or a corridor.
Theme park traffic counter placement: where each people counter goes
A park is a mix of covered, open-air, bright and dark spaces, so no single sensor suits every position. V-Count builds the count from four device types, all reporting into one platform.
- Ticket plaza and turnstiles. Overhead Nano AI units above each lane give a clean per-lane throughput figure and a park-wide attendance total. Because lanes are counted separately, you can see which side of the plaza is jamming while the other runs free.
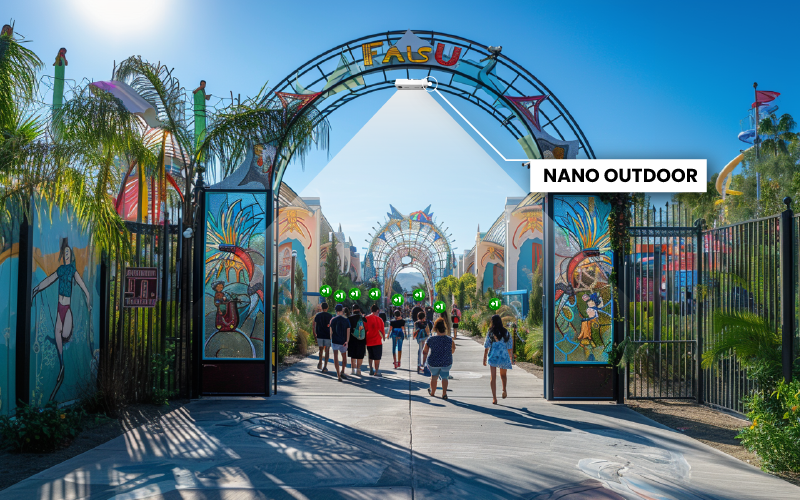
- Parking lots, tram stops and outdoor walkways. A theme park traffic counter has to survive sun, rain, dust and freezing nights. Nano Outdoor is the weather-rated unit for parking-to-gate flow, pathway junctions and open entrances where there is no ceiling to mount on.
- Ride queue lines, indoor attractions and show buildings. Switchback queues, dark ride loading bays and high-roofed queue barns are the hardest counting environments in the park. Nano Prime 3D stereo handles high mounting heights and low light, which is what queue houses and pre-show rooms are made of.
- Land gateways, F&B outlets and gift shops. Nano AI at each land portal and shop door produces the zone occupancy and capture-rate numbers above.
- Live occupancy for lands, theatres and indoor venues. VCare turns the in-and-out counts into a real-time headcount with thresholds, so a duty manager sees a land or theatre approaching its limit rather than hearing about it afterwards.
- One dashboard. Every sensor reports into BoostBI, where attendance, occupancy, queue and capture data sit side by side with hourly, daily and season views. If you are new to the hardware side, start with our overview of people counting technology.
Theme park queue management: posted wait times and virtual queues
Guests judge a park by its lines. Theme park queue management works when the posted wait time is honest and when the decision to open a virtual queue is made early, and both depend on counting rather than on a greeter with a stopwatch and a timing card.
Sensors at the queue entrance and at the load platform give two numbers every minute: how many guests are standing in the line, and how many are boarding per hour. Divide one by the other and you have a measured wait that updates continuously, with none of the drift that comes from a single timed guest walking the line once an hour.
The same feed drives the sign at the queue entrance, the park app and the duty manager’s dashboard, so all three agree.
Those counts also tell operations what to do next. When queue arrivals start outrunning the boarding rate, the choices are to add a train or boat, open a second load side, release virtual queue slots, or push guests toward a land that the occupancy map shows is quiet.
Knowing the crossover point half an hour early is the difference between a managed morning and a two-hour line by eleven. Our queue management solution covers how the line-length and wait-time logic works across venue types.
Show venues need the same discipline in reverse: count guests into the theatre against its seating capacity so the host stops the queue at the right moment instead of filling the house and turning people away at the door.
How theme park operators use the data
- Staffing by hour, not by shift block. Ride hosts, sweepers, till staff and food runners get rostered against the hourly arrival curve for their own land, so the two-o’clock peak at the water ride is covered and the quiet first hour is not overstaffed.
- Safety capacity. Lands, theatres, indoor play areas, queue houses and the park as a whole carry occupancy limits. Live counts with alert thresholds let a duty manager hold guests at a land portal or pause queue entry before a limit is reached, and give an auditable record afterwards.
- Food and beverage planning. Capture rate and zone occupancy decide which windows to open, when to start prep, and where a mobile cart earns its keep. A land that holds guests for two hours needs different catering from one they walk through.
- Weather and season patterns. Attendance in an outdoor park is weather-bound. Comparing hourly counts against the forecast across a season separates a genuinely soft week from a wet one, and gives a realistic baseline for next year’s operating calendar and seasonal event scheduling.
- Marketing and event attribution. Gate counts by hour, held against campaign dates, holiday periods and event nights, show whether a promotion, a new ride opening or a Halloween run actually moved attendance or simply shifted it from the following weekend.
- Layout, parades and flow. Zone-level traffic shows the pinch points on parade routes and which paths guests refuse to use, which is what you act on before spending on new walkways, shade or signage.
- Parking and transport. Counting guests off the trams and out of the lots gives the gate team lead time and tells transport whether tram frequency matches the arrival wave.
All V-Count sensors count anonymously: they detect the shape of a person passing under the sensor and store a count, not an identity. No images of guests or staff are retained, which matters in a venue where a large share of visitors are children.
Theme park people counting FAQ
How does a theme park people counter measure gate throughput and daily attendance?
Overhead sensors above each turnstile or entry lane count every guest passing through, in both directions, and timestamp each count. Throughput is the count per fifteen-minute block per lane, which shows whether the plaza is clearing arrivals fast enough at opening.
Daily attendance is the sum of entries across every gate, including service, hotel and season-pass entrances, minus exits where re-entry is allowed. Because each lane is counted separately, you can see which lanes jam and which run empty.
In BoostBI the figure becomes the park’s control total that finance, marketing and operations all reconcile to.
Can people counting sensors estimate ride queue length and wait times?
Yes. Place one sensor at the queue entrance and one at the load platform. The difference between the two counts is the number of guests currently standing in the line, and the platform count gives the boarding rate per hour.
Dividing the line population by the boarding rate produces a wait time that updates continuously rather than once an hour. That figure can drive the posted sign, the park app and the operations dashboard at the same time, so guests and managers see the same number.
It also flags the moment arrivals begin outrunning throughput.
How do we count guests outdoors where sensors are exposed to weather?
Outdoor positions such as parking lots, tram stops, open park entrances and pathway junctions need a weather-rated device rather than an indoor camera in a housing. Nano Outdoor is built for that: it mounts on poles, canopies and gate structures and keeps counting through rain, direct sun, dust and cold.
Indoor positions inside shops, queue houses and theatres use Nano AI or Nano Prime instead. Because every device reports into the same BoostBI account, outdoor parking-to-gate flow and indoor land occupancy appear in one view rather than in two separate systems.
How do we track occupancy of individual lands or zones across a large park?
Sensors are placed on the walkways and portals that connect one land to another, counting guests in both directions. Adding entries and subtracting exits gives a live headcount for each land, independent of total park attendance.
This is what shows you that a themed land is at its comfortable limit while the rest of the park is half empty, so you can redirect guests, open an alternative path or start a show early. VCare handles the real-time side with thresholds and alerts; BoostBI keeps the history for comparing lands across days and seasons.
Does theme park people counting identify individual guests?
No. V-Count sensors process what passes beneath them on the device itself and output a count, not an identity. No guest images are stored or transmitted, there is no facial recognition in the counting products, and children cannot be identified.
This is one reason parks choose sensor-based counting over camera review: the operational numbers you need, attendance, occupancy, queue length and capture rate, do not require knowing who anyone is. Anonymous counting also keeps the deployment simpler to explain to guests, works councils and regulators.
How do we measure food, beverage and retail capture rate inside the park?
Put a door counter on each outlet and compare its entry count against the occupancy of the land around it in the same hour. That ratio is capture rate: the share of guests present nearby who actually came in.
A cart or shop with heavy passing traffic and a low capture rate has a visibility, queue, menu or staffing problem rather than a demand problem, and the fix is usually cheap. Tracking capture rate by hour also tells you when to open a second window and when to start prep for the lunch and parade peaks.
Can counting data tell us when to open a virtual queue?
It can give you the trigger. Watch the queue arrival rate against the ride’s boarding rate: while boarding keeps up, the physical line is fine. When arrivals run ahead for a sustained period, the line will grow past your service standard, and that crossover is the point to release virtual queue slots, add a train, open a second load side or push guests toward a quieter land.
Because the counts update continuously, you see the crossover roughly half an hour before it shows up as a visibly long line.
How do we separate weather and seasonality from real attendance trends?
Hourly counts held against the calendar and the day’s weather let you compare like with like. A wet Tuesday in October and a dry Tuesday in October are different baselines, and treating them as the same is how parks misread a season.
With several seasons of counts in BoostBI you can compare the same week year over year, isolate the effect of an event night or a new ride, and build an operating calendar and staffing plan on measured patterns instead of last year’s impressions.
If you are scoping a counting deployment for a park, a water park or a family entertainment centre, we can map the sensor positions against your gates, lands, queues and outlets and show the BoostBI views your duty managers would use. Request a demo and we will walk through it with your operating calendar.