Solution · Retailer & mall traffic index
Retailer & Mall Traffic IndexMarket-level store and shopping-mall footfall, to benchmark your own traffic
V-Count’s Retail Foot Traffic Index (Store + Shopping Mall) adds up the foot traffic of many retail locations into one daily figure. It is updated every day in BoostBI with a 90-day backward view, and emailed every Monday.
Put it next to your own visitor counts and you can tell whether a quiet week was your store or the whole market.

What the Retail Foot Traffic Index measures
The index is a market-level footfall figure. It combines stores and shopping malls, and shows how retail traffic is moving day by day.

One total from many retail locations
The The Netherlands Retail Foot Traffic Index (Store + Shopping Mall) consists of the total foot traffic from many retail locations. It is reported daily with a 90-day backward view, so every report shows the latest day in the context of the three months before it.
- Stores and shopping malls in one index
- One value per day, with a 90-day backward view
- Market level: it shows how retail traffic is moving overall, not the traffic of any single location
It answers a different question from your own people counter. Your sensors tell you how many people came into your store. The index tells you how the market moved on the same days. Read more about what footfall is and how it is measured.
Explore the index chart
This is how the index looks: one line of daily foot traffic over 90 days. The data shown is for representation purposes only, not live market data.
Sample index chart with representation data, not current market figures.
One point per day
Each point on the line is the total foot traffic for one day.
Weekends shaded
Weekend days are shaded, so the weekly rhythm is easy to see.
Hover for values
Hover over or tap a day to see its date and its traffic total.
Peaks and dips
One-off peaks and dips stand out against the normal weekly pattern.
How to benchmark your footfall against the index
Compare change with change. Your store and the index are on very different scales, so compare the percentage change over the same days, not the raw totals.
Choose the same period
Take the same days for your own counts and for the index, for example the last four full weeks against the four weeks before.
Full weeks keep the number of weekend days equal in both periods.
Calculate both changes
Work out the percentage change in your own visits, then the percentage change in the index over the same days.
Use visits from a counter that covers every public entrance and excludes staff, so your side of the comparison means real visitors.
Read the gap
If your change is better than the index, you did better than the market. If your traffic fell while the index held steady, the cause is more likely in your own store.
Note promotions, opening hours and weather for both periods before you draw a conclusion.
Worked example to show the arithmetic, not customer or index data: your change minus the index change = −6% − (−9%) = +3 percentage points. On its own, −6% looks like a bad month. Against the market, it was 3 points better.
Is it your store, or the whole market?
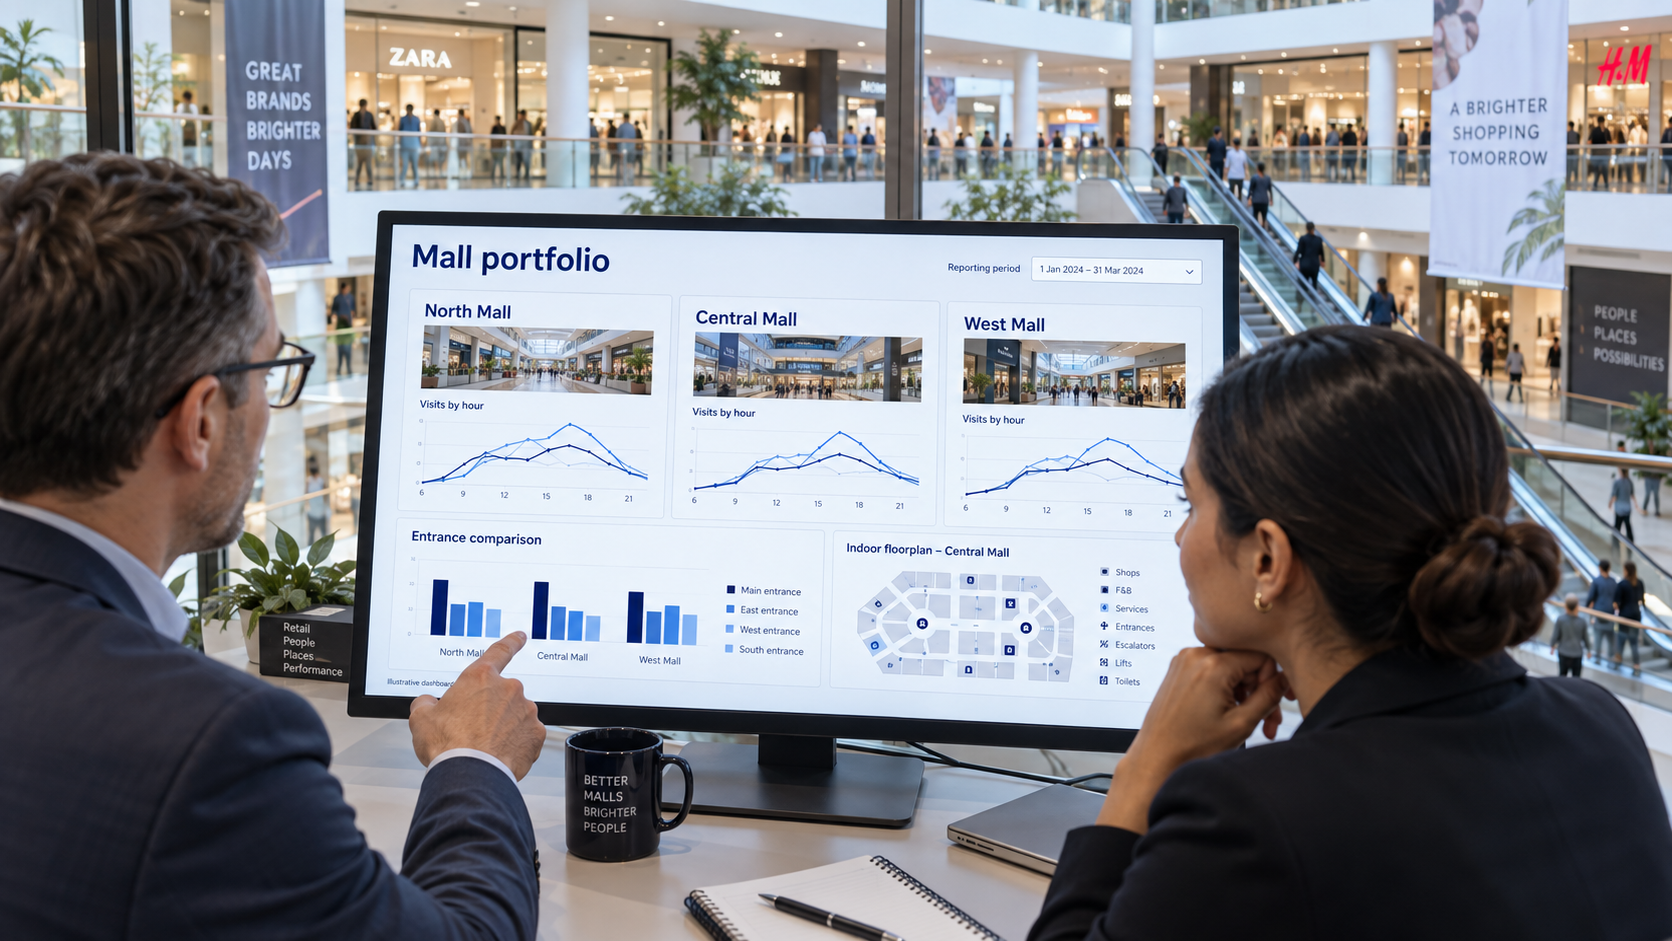
A month that looks poor on its own may be well ahead of the market. A strong month may simply be the season. Retailers and shopping-mall teams use the index as the outside reference point.
A reference point for every footfall report
- Retailers check whether a change in store traffic follows the market or goes against it, before they change staffing, layout or marketing.
- Shopping-mall teams see whether a soft month is their centre or the whole market, and whether a strong month is performance or seasonality. See people counting for shopping malls.
Read the index alongside your own footfall counts, not instead of them.
How you receive the index
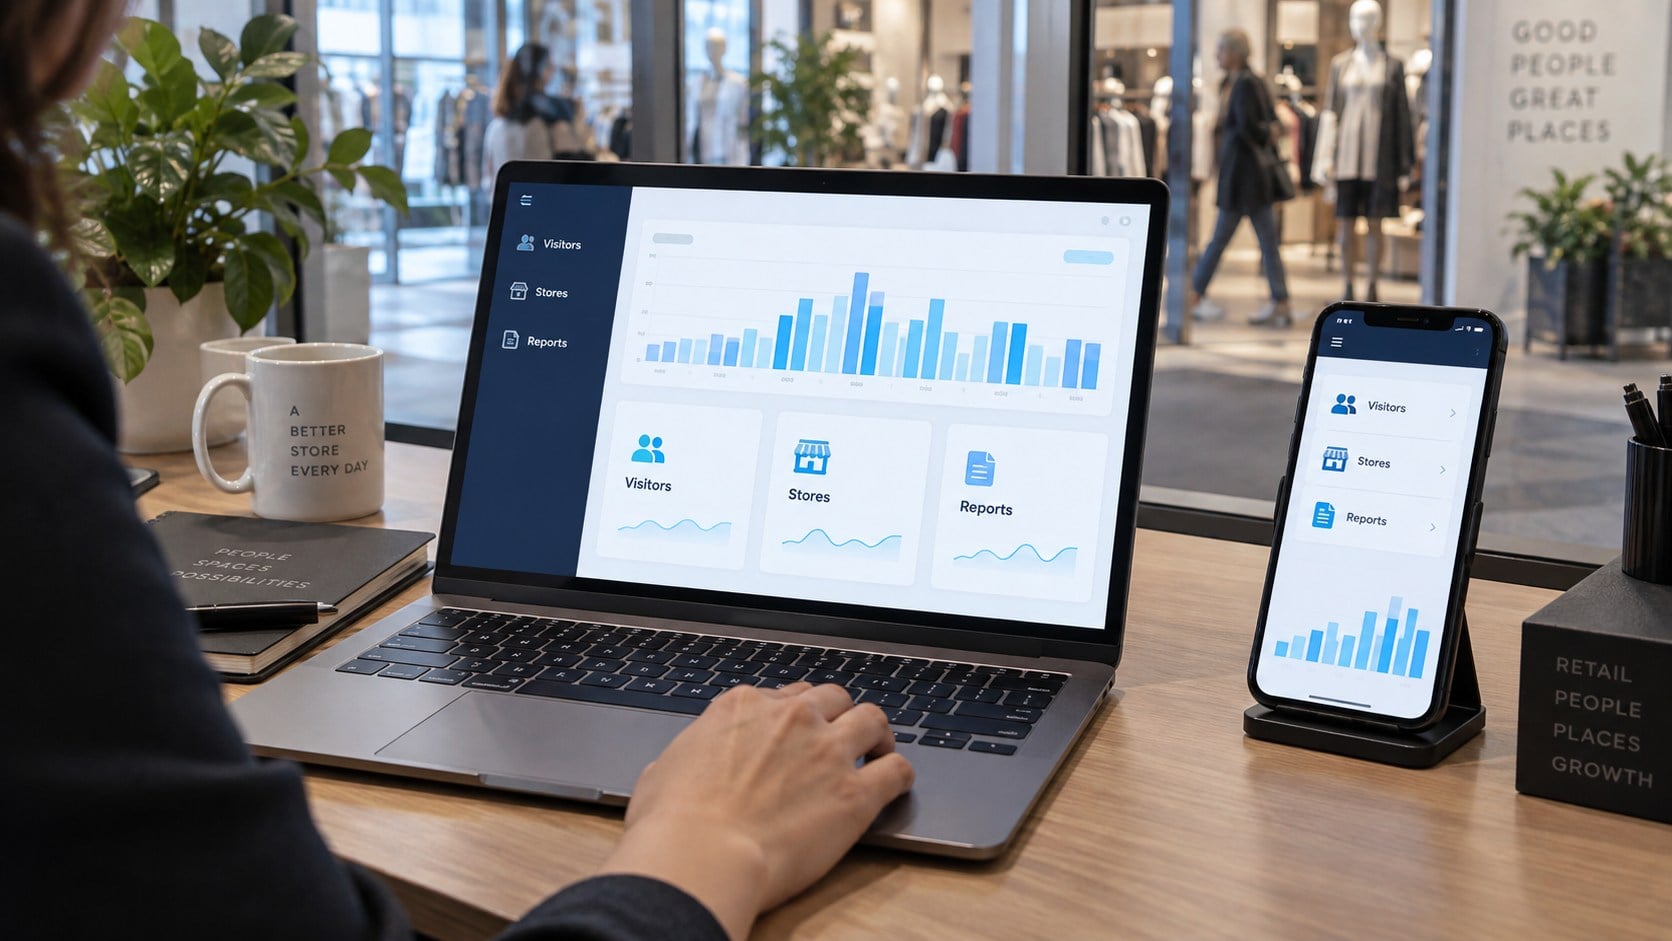
The index lives in BoostBI, V-Count’s analytics dashboard and mobile app, and a weekly report reaches your inbox every Monday.
Daily in BoostBI, weekly by email
- Updated daily on the V-Count BoostBI interface
- 90-day backward view, so you always see the recent trend, not just one day
- Emailed weekly every Monday to 10 email addresses
Send the weekly email to the people who review footfall each week, such as head office, regional managers or the centre management team.
Explore BoostBISubscription and price
The index is sold as a monthly subscription per market. The price below is for one market, for example The Netherlands.
| Plan | Price | What you get |
|---|---|---|
| Monthly | €500 per month, per market | Daily index updates in BoostBI with a 90-day backward view, and a weekly email every Monday to 10 email addresses |
To subscribe, fill out the form on our demo request page. For people counting sensors and BoostBI licences, see the pricing page.
Subscribe to the indexPair the index with your own footfall
The index shows the market. Your own sensors show your doors. You need both to benchmark.
Count your own doors with Nano AI
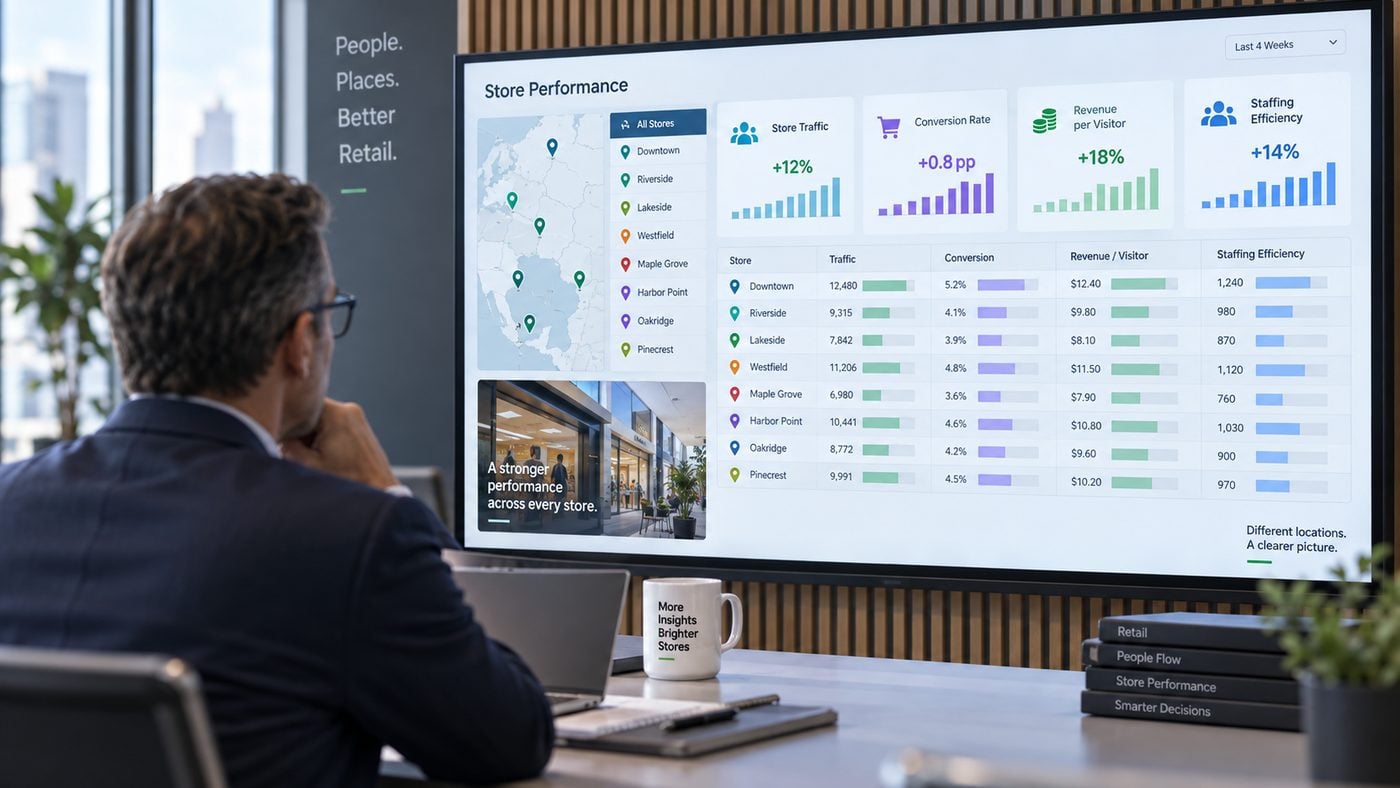
V-Count Nano AI counts entries and exits with up to 99% accuracy at an indoor entrance line, and keeps staff out of the count. Every site reports to one BoostBI account.
- Store-versus-store benchmarks across your own estate
- Year-over-year comparison built in
- Conversion rate once your POS is connected
Related solutions
Your own counts come from the Nano AI people counting sensor, with Nano Prime for zones inside the store and Nano Outdoor for open-air entrances, and all of them report to BoostBI.
Traffic index FAQ
What the Retailer & Mall Traffic Index measures, how it is delivered and what it costs.
Ask an expertWhat is the Retailer & Mall Traffic Index?
It is V-Count’s Retail Foot Traffic Index (Store + Shopping Mall): the total foot traffic from many retail locations, stores and shopping malls combined. It is reported daily with a 90-day backward view.
Where does the index data come from?
From many retail locations, both stores and shopping malls. The index reports their combined total foot traffic, so it shows how retail traffic is moving at market level rather than the traffic of any one location. The chart on this page uses sample data for representation purposes.
How often is the index updated, and how do I receive it?
The index is updated daily on the V-Count BoostBI interface, with a 90-day backward view. A weekly report is emailed every Monday to 10 email addresses.
How do I use the index to benchmark my own footfall?
Compare the percentage change in your own visits with the percentage change in the index over the same days. If your traffic fell less than the index, you did better than the market. If it fell while the index held steady, the cause is more likely in your own store. Read the index alongside your own counts, not instead of them.
How is the index different from my own people counting data?
Your own counter, such as V-Count Nano AI with up to 99% accuracy at an indoor entrance line, measures the people who enter your locations. The index measures total foot traffic across many retail locations. Use your own counts for store decisions and the index as the market reference.
How much does a subscription cost?
The subscription costs €500 per month, per market. To subscribe, fill out the form on the demo request page.
Benchmark your footfall against the market
Daily store and shopping-mall foot traffic in BoostBI, a 90-day backward view and a weekly email every Monday, for €500 per month, per market.
Subscribe to the index