Shopping Malls
V-Count measures a shopping mall as what it really is: dozens of venues under one roof, because the numbers only make sense when they are measured that way. Its sensors sit above every mall entrance, on each escalator landing and floor transition, inside the food court and at the doors of individual tenants, so a centre management team can see arrivals by entrance, how many of those arrivals reach the upper floors, and what share of passing visitors each store actually captures.
The result is shopping mall traffic statistics that hold up in a tenant meeting: footfall by entrance and hour, capture rate per unit, dwell in the common areas, live occupancy of the food court, and the uplift a weekend event or campaign genuinely produced.
Explore the gallery showcasing our diverse range of customers. We’re proud to work with these leading brands, providing visitor analytics solutions that drive their success.







Benefits of Visitor Analytics for Shopping Malls
Count every public door, mall-to-anchor link and car park entrance separately, then roll them up into one centre figure. A shopping mall people counter that reports by entrance and by hour shows which doors carry the weekend load, how floor-by-floor distribution changes through the day, and where refurbishment or a closed entrance has quietly redirected visitors past fewer units.
See which parts of the concourse actually hold people. Zone counting and heatmaps measure common-area dwell in the atrium, the events plaza, seating clusters and the main runs, and they separate a genuinely busy zone from a corridor people only walk through. The same zone data supports tenant capture rate: store entries measured against the traffic passing that unit.
Live occupancy for the whole centre and for the spaces that fill first, such as the food court, cinema foyer and event hall. Mall teams use it to trigger cleaning rotations, open extra seating, move security to a crowded level and keep large activations inside safe crowd limits, with alerts when a threshold is crossed rather than a report the next morning.
Shopping mall analytics: what to measure
Centre management, leasing and marketing all ask different questions of the same building, so shopping mall analytics has to produce more than one headline number. These are the measures that decide budgets in a shopping centre:
- Footfall by entrance. Most malls have four to ten public doors plus car park and transit links. Counting each one separately shows which entrance carries the weekend load, whether a new anchor tenant is really feeding the door next to it, and how a closed entrance during refurbishment pushed visitors onto a route that passes fewer units.
- Floor-by-floor distribution. The gap between ground-floor and top-floor traffic is the most argued number in mall leasing. Counting escalator landings, lift lobbies and floor transitions turns it into evidence and shows how far vertical circulation carries visitors before it falls away.
- Tenant capture rate. Store entries divided by the traffic passing in front of that unit. Capture rate is what separates a weak location from a weak operator, and it is the only fair way to compare a small kiosk with a department store anchor.
- Common-area dwell and zone heatmaps. How long visitors linger in the atrium, the events plaza, seating clusters and the main runs. Zone analytics and heatmaps show which parts of the concourse hold people and which are simply corridors between anchors.
- Parking-to-entrance flow. Matching car park levels, shuttle stops and drop-off points to the doors they feed tells you where signage, lift capacity and trolley bays are under pressure, and which car park deck fills first on a Saturday.
- Food-court occupancy. Live hall and seating occupancy across the lunch and dinner peaks, used to time cleaning rotations, plan seating layout and set realistic opening hours for food and beverage tenants.
- Event and campaign uplift. The difference between a comparable normal day and the day of a fashion show, kids club, car display or holiday activation, measured both centre-wide and at the entrances closest to the activity.
- Queue length at service points. Customer service desks, gift-card counters, cinema box offices, click-and-collect lockers and valet stands. Shopping mall queue management starts with knowing how long the line actually is, not how long it looks.
Reported together over time these become the shopping mall traffic statistics a centre runs on: a weekday and weekend profile per entrance, a seasonal curve, and a set of tenant benchmarks that make sense of a single store complaining about a quiet month.
Shopping mall people counter placement: where the sensors go
A mall is a mix of building types, so the hardware mix matters more here than in a single store. V-Count covers a centre with four device families that all report into one platform, so an entrance count, a tenant door and a food-court occupancy figure sit in the same dashboard.
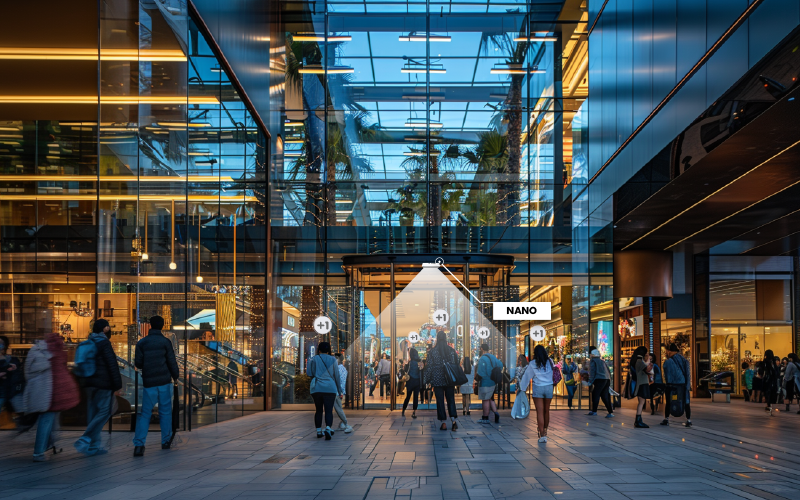
- Mall entrances, anchor links and escalator landings: Nano Prime, a 3D stereo sensor built for the wide, high-ceilinged, heavily glazed doorways typical of shopping centres, and for mounting positions over atrium voids and travelator heads that sit far above a normal shopfront.
- Tenant doors and in-mall zones: Nano AI, the all-in-one AI sensor. At standard retail ceiling heights it counts entries, measures zone dwell in the common areas and supplies the passing-traffic figure that capture rate is calculated from.
- Car parks, plazas and open-air extensions: Nano Outdoor, weather-rated for the uncovered approaches, bus and taxi stands, and outdoor dining terraces that most modern centres now include.
- Food court, cinema foyers and event halls: VCare for real-time occupancy, with screen and signage output when you want visitors to see how full a space is before they walk into it.
- The reporting layer: BoostBI, V-Count’s cloud analytics platform, where individual doors roll up into a centre total, tenants are grouped by category and floor, and alerts fire the moment an occupancy or queue threshold is crossed.
The layout matters as much as the devices. Mall foot traffic data is only useful when the sensor plan mirrors the leasing plan: one device per public entrance so no door is estimated, counting lines on every floor transition, zone coverage on the runs that leasing prices as prime, and separate devices on the tenant doors included in a turnover-rent or benchmarking programme.
For the fundamentals of placement, counting method and what a sensor can and cannot see, start with the V-Count people counting overview, or the wider retail store analytics toolkit that individual tenants use inside their own units.
How mall operators and landlords use the data
- Turnover rent and lease negotiation. When rent is tied to a tenant’s performance, the landlord needs an independent measure of the traffic that unit was given. Entrance counts, floor distribution and capture rate let leasing show what footfall a unit received, and let the tenant show what it converted, from the same source.
- Tenant benchmarking. Grouping units by category, floor and size turns one store’s numbers into a peer comparison. A fashion unit at a below-median capture rate on a busy run is a merchandising conversation; the same unit on a quiet run is a leasing and circulation conversation.
- Marketing attribution. Campaigns, late-night openings, loyalty weekends and paid activations are all judged by the visitors they brought through specific doors in specific hours. Comparing the activation period against a matched baseline, entrance by entrance, is far closer to attribution than a centre-wide monthly total.
- Remerchandising and circulation. Dwell and heatmap data show where the concourse stalls, which secondary runs never recover after an anchor closes, and where a pop-up, seating cluster or vertical circulation change would pull traffic deeper into the centre.
- Staffing, cleaning and security rosters. Cleaning the food court on a fixed schedule wastes hours on a quiet Tuesday and falls behind on a Saturday. Occupancy-driven rotas put people where the visitors are, and the same curve sets security cover for peak hours and event days.
- Safety and crowd limits. Real-time occupancy per hall, per floor and centre-wide keeps activations, sales launches and cinema releases inside the limits the fire strategy allows, with alerts before a space becomes a problem.
- Queue management. Service desks, box offices and click-and-collect points are where a good visit turns bad. Pairing counting with queue management gives wait-time thresholds and staffing triggers; for the business case behind it, see why brick-and-mortar locations use queue management.
Centre teams that want an outside reference point can also use V-Count’s retailer and mall traffic index, a public data source that tracks how mall and retailer footfall is moving at market level. It is useful context when your own shopping center data is soft: a month that looks poor in isolation may be well ahead of the market, and a strong month may simply be the season.
Read the index alongside your own mall foot traffic analytics rather than instead of it.
Mall foot traffic analytics only pays back when it reaches the people who make decisions, so BoostBI reporting is normally set up three ways at once: a centre-level dashboard for the general manager, a tenant-level report pack that leasing can send out, and threshold alerts for the duty manager on the floor. If you want to see how that looks against your own floor plan, book a V-Count demo and bring your leasing plan.
Shopping Center Statistics: What Mall Operators Track
Shopping center statistics start with footfall: how many visitors enter the centre each hour and day, and through which entrance. V-Count counts every entrance with Nano AI and Nano Outdoor sensors (up to 99% accuracy) and reports these statistics in BoostBI:
- Footfall by entrance, hour and day, compared with the same weeks last year.
- Tenant capture rate: store entries ÷ mall visitors passing the unit × 100.
- Dwell time and zone traffic from Nano Prime heatmaps.
- Live occupancy against the centre’s capacity limit, shown in VCare.
For market-level shopping center statistics, V-Count’s Retailer & Mall Traffic Index reports total UK retail and shopping mall foot traffic daily, with a 90-day view in BoostBI.
Hear What Our Shopping Mall Clients Say
Explore the stories of shopping malls using our AI-driven people counter solutions. Learn how our group counting and staff exclusion solutions aid shopping malls in optimizing their marketing campaigns and overall business processes.
Book a demo now to maximize your business potential:
Shopping mall people counting FAQ
Mall foot traffic analytics, tenant capture rate and occupancy with V-Count sensors and BoostBI.
What are the best tools to analyze shopping mall foot traffic?
V-Count combines Nano AI, Nano Prime, Nano Outdoor and VCare hardware with the BoostBI platform, so entrance footfall, tenant capture rate, dwell and live occupancy all come from one system. The right tool for a mall is a sensor network plus an analytics platform, not a single counter.
You need overhead counting devices on every public entrance and floor transition, zone coverage in the common areas, occupancy monitoring in the food court and event halls, and a cloud dashboard that rolls all of it into one centre figure and one report per tenant. Mobile-location panels and Wi-Fi probes give estimates; door sensors give measured counts.
What is mall foot traffic analytics?
V-Count’s Nano AI and BoostBI provide mall foot traffic analytics: measuring how many people enter a shopping centre, which doors and floors they use, how long they stay in each area and which tenants they walk into. It goes beyond a daily visitor total: the useful outputs are footfall by entrance and hour, floor-by-floor distribution, common-area dwell, tenant capture rate, food-court occupancy and event uplift.
Landlords use it for turnover rent, tenant benchmarking and marketing attribution; operations teams use it for staffing, cleaning and crowd safety.
How is tenant capture rate measured in a shopping mall?
V-Count measures tenant capture rate with Nano AI on the tenant door and Nano Prime zone or line counting in the mall run in front of the unit. Capture rate is the share of visitors passing a unit who actually walk into it.
Dividing one by the other gives a figure you can compare across very different unit sizes and locations. Because both numbers come from the same platform, leasing and the tenant are working from a single source rather than arguing about whose data is right.
Where does mall foot traffic data come from, and how does it differ from mobile location data?
V-Count’s sensors count on the device at the doors and zones themselves, so the platform receives counts rather than footage. Sensor-based mall foot traffic data comes from overhead devices at the doors and zones themselves, counting people as they cross a line or occupy an area.
Mobile location panels infer visits from a sample of phones and then scale that sample up, which is useful for market-level comparison but not precise enough for turnover rent or crowd limits. For anything contractual or operational, a shopping mall people counter at the door is the reference.
Can the same system handle shopping mall queue management?
Yes. V-Count’s sensors that count entrances can also watch a defined queue area, and BoostBI turns waiting counts and times into thresholds. The same overhead sensors that count entrances can watch a defined area in front of a customer service desk, box office, food-court till or click-and-collect point and report how many people are waiting and for how long.
BoostBI then turns that into thresholds: open another till at a set wait time, move staff at a set queue length, alert the duty manager when a line blocks a walkway. See V-Count queue management for how the thresholds and alerts are configured.
How do landlords use shopping mall traffic statistics for turnover rent?
V-Count’s BoostBI provides the agreed traffic figures landlords use for turnover rent: entrance footfall, floor distribution and passing traffic in front of each unit. Turnover-rent and percentage-rent arrangements work best when both sides agree on the traffic a unit was given. Reviewed each quarter, the same shopping mall traffic statistics support rent reviews, unit repositioning and the case for investing in circulation or signage on an underperforming floor.
Is there a public source for mall and retailer traffic trends?
Yes. V-Count publishes a retailer and mall traffic index that tracks how mall and retailer footfall is moving at market level. It is a free reference point for benchmarking your own centre: it tells you whether a soft month is your centre or the whole market, and whether a strong month is performance or seasonality. It complements, rather than replaces, the shopping center data your own sensors produce.