Solution · Real-time occupancy (VCare)
Real-Time Occupancy MonitoringLive headcount against your capacity limit, with alerts and entrance displays
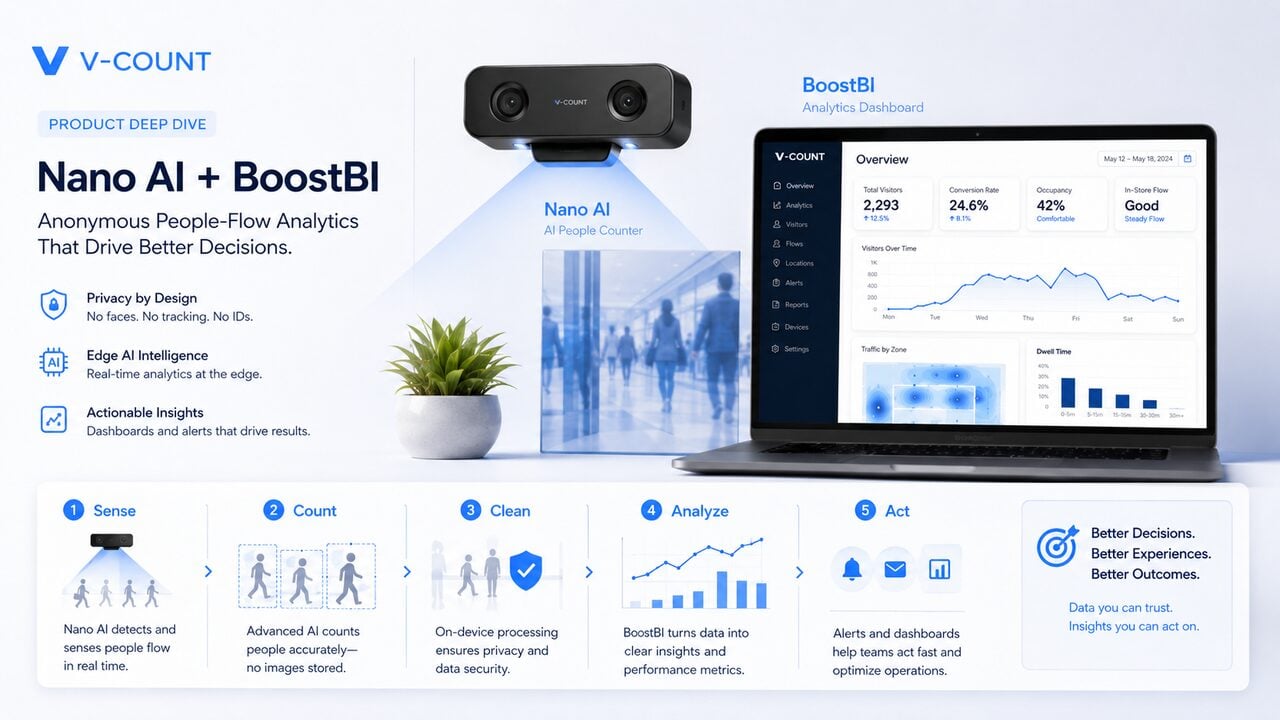
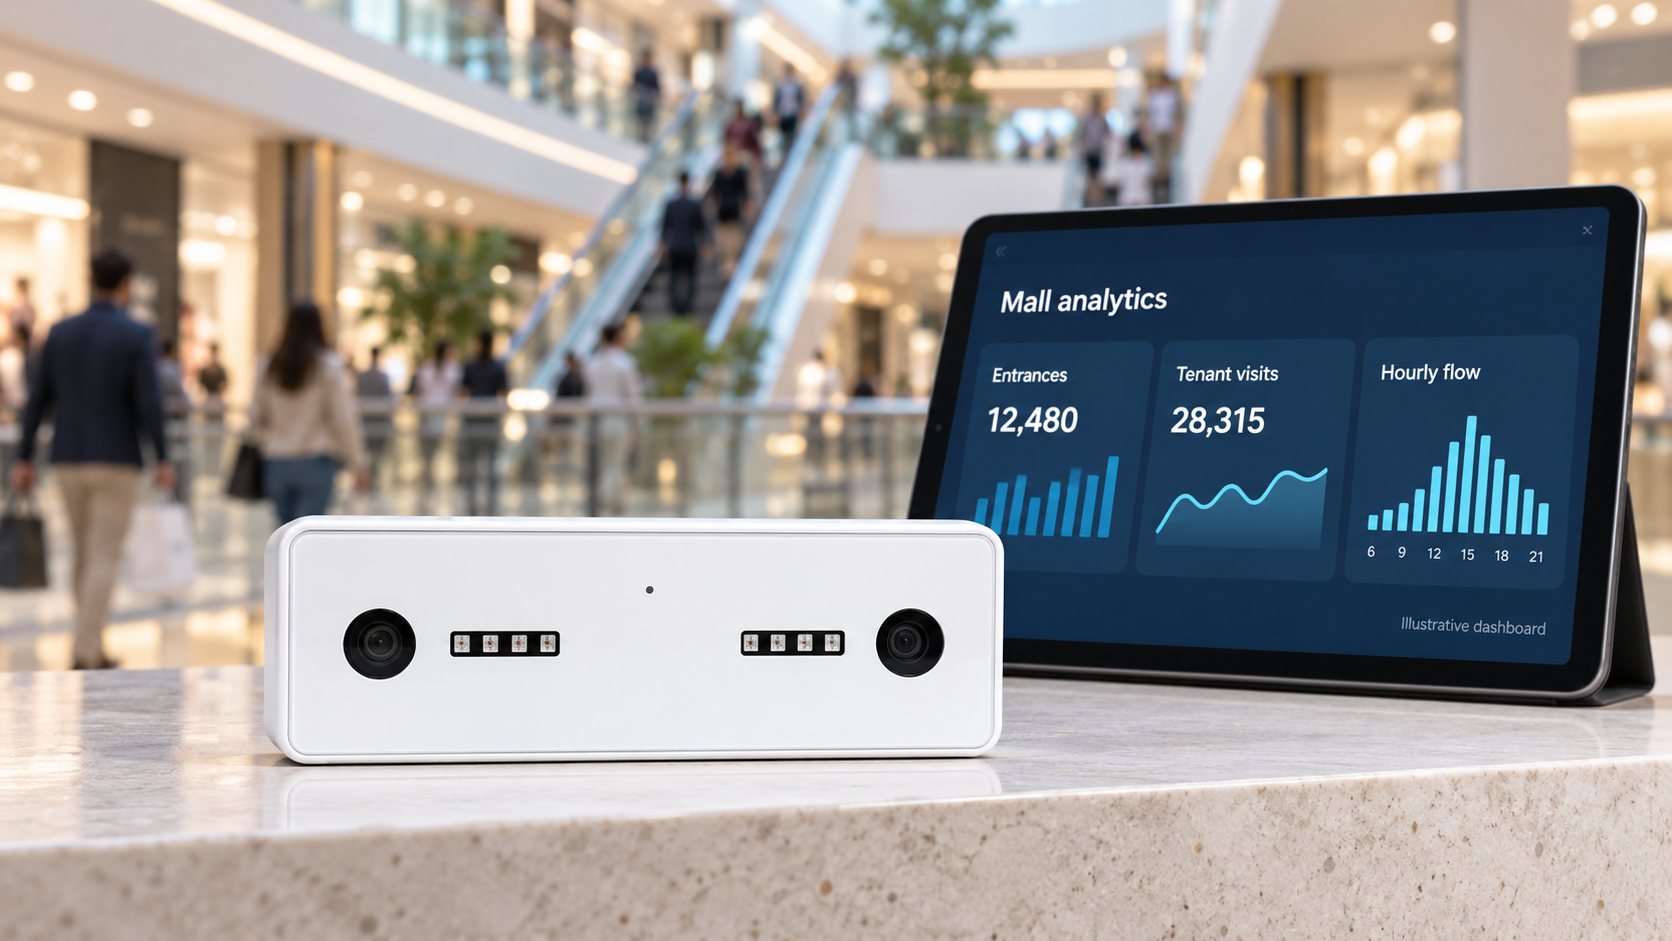
VCare is V-Count’s real-time occupancy solution. Nano AI sensors count every entry and exit at each door, VCare keeps the running difference as a live headcount, and compares it with the limit you set for the building, a floor or a single zone. BoostBI keeps the history.
A footfall counter tells you how many people came in today. VCare tells you how many are inside right now, and warns the right people before the space is full.
One live number. Three ways to act on it.
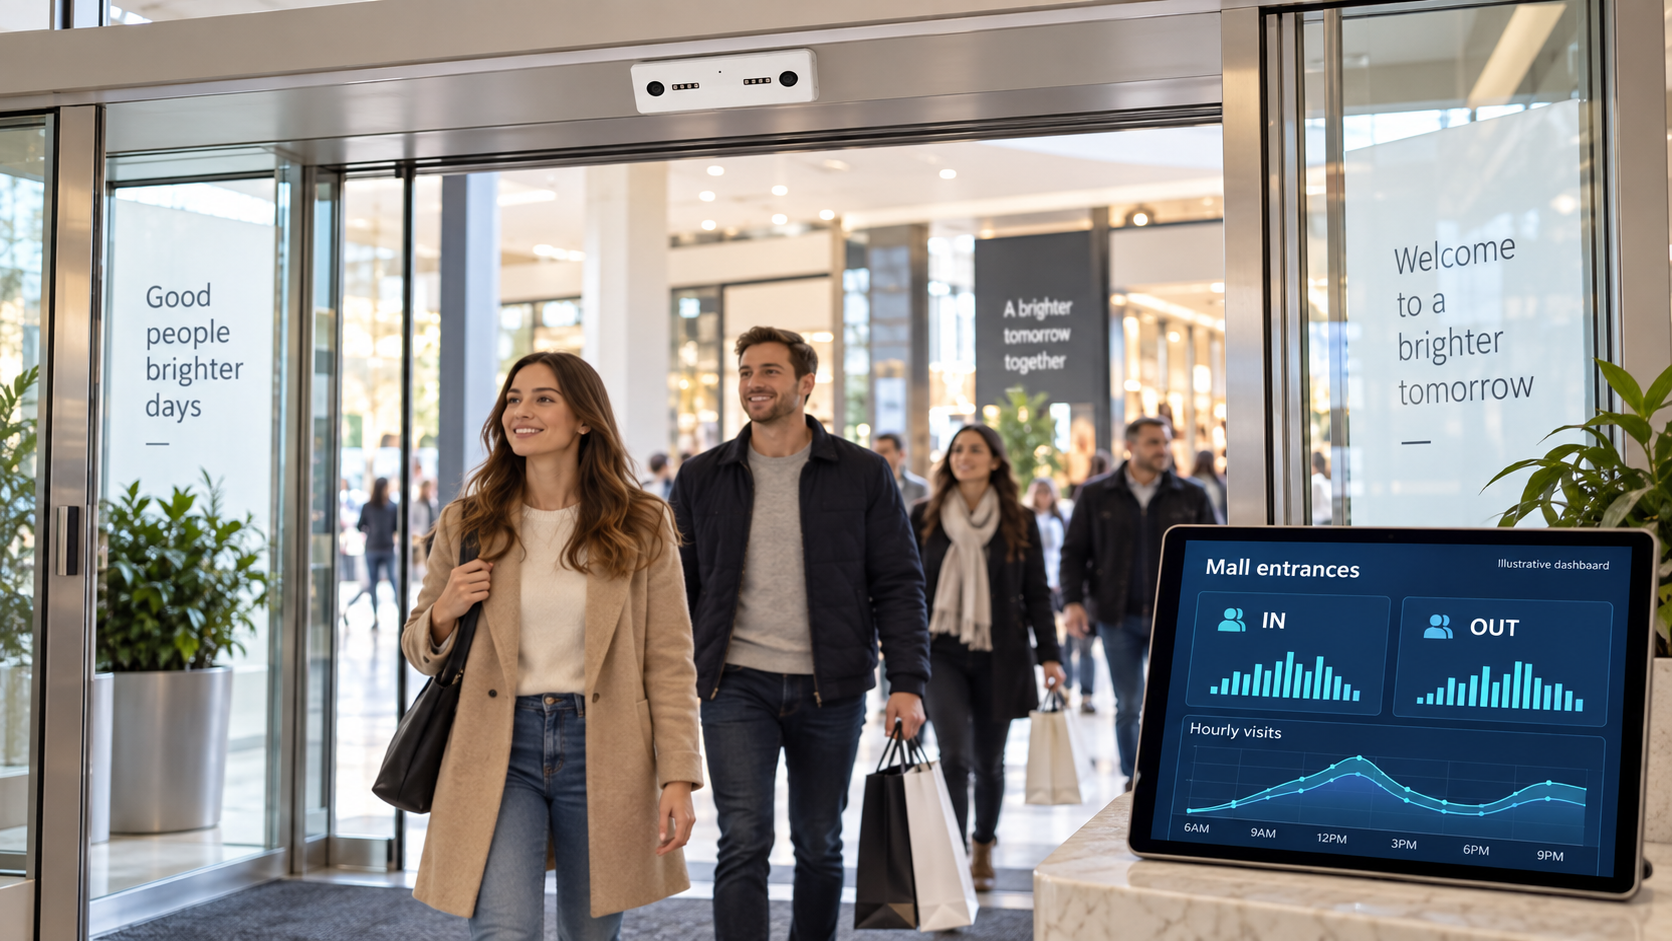
VCare turns the in and out counts from your entrance sensors into one figure: how many people are inside now. Staff see it on a dashboard or phone, visitors see it on a screen at the door, and connected systems can read it through the API. It runs on the same Nano AI sensors and BoostBI account as your people counting.
Explore Nano AILive headcount
Entries minus exits across every monitored door, kept as a running count for the whole site and for each floor or zone.
How the count worksCapacity alerts
Set a limit for each space. When it is crossed, VCare alerts the people responsible by email, push notification, SMS or webhook.
Limits and alertsEntrance displays
Show the live figure on a screen at the door as a number, a percentage of capacity or a simple enter or please wait signal.
Displays and signageVCare supports your capacity management. It does not set a safe capacity and it does not replace your venue’s safety procedures.
Why a footfall total cannot manage capacity
Footfall counts how many people entered over a period. Occupancy is how many are inside at a moment. Capacity, comfort and safety decisions need the second number, and they need it now, not in tomorrow’s report.
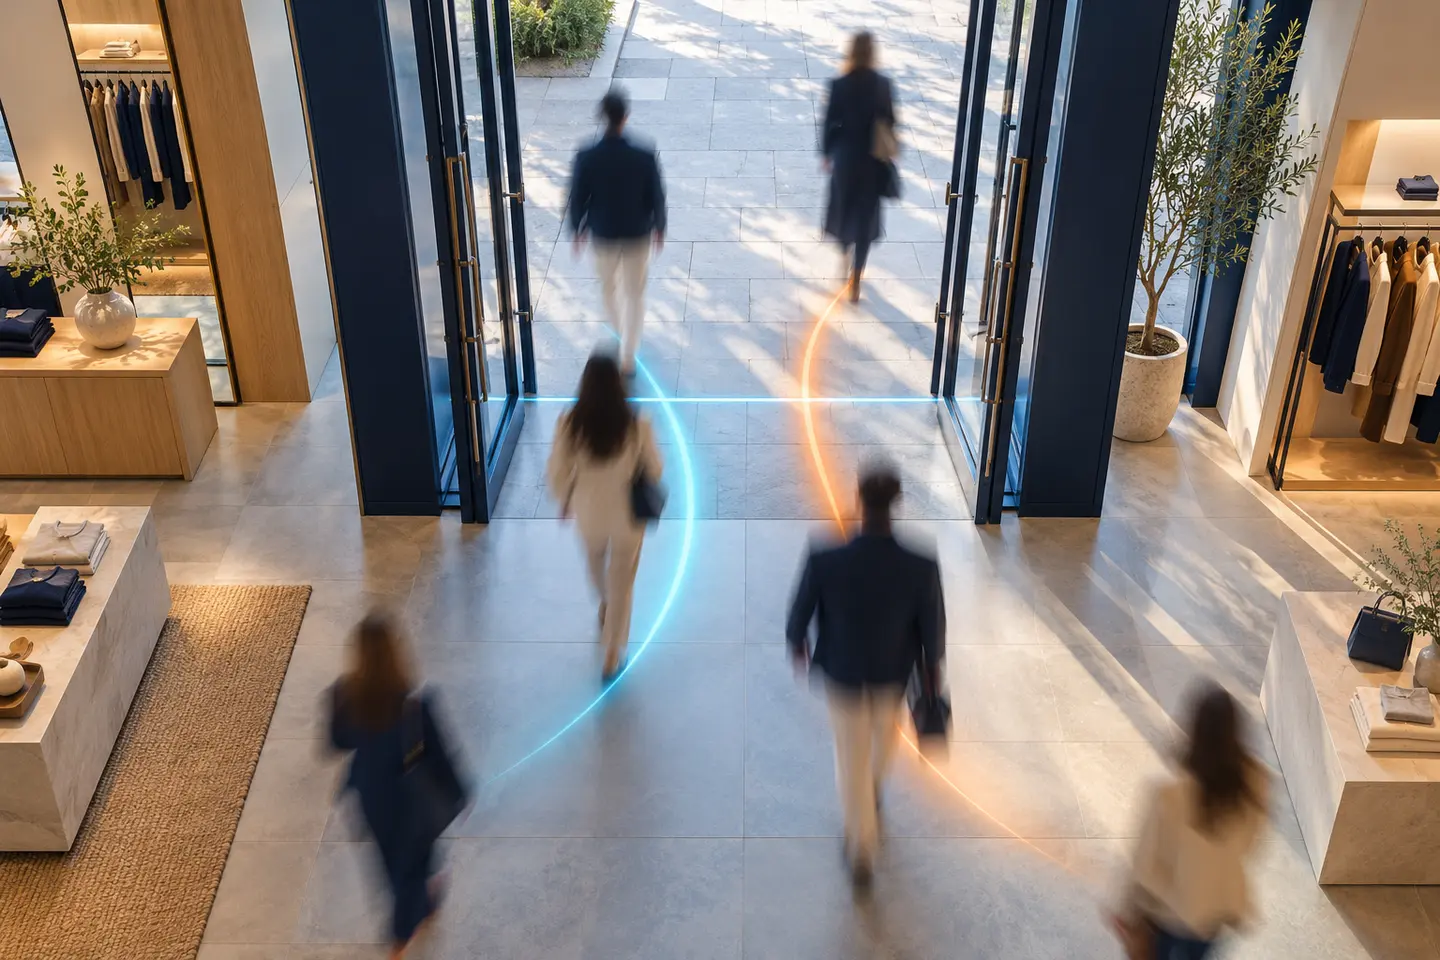
Occupancy is entries minus exits
A sensor that cannot tell an entry from an exit cannot produce an occupancy figure at all. Nano AI counts direction at each door, so a person who enters by the north door and leaves by the south door is one arrival and one departure, not two visits.
VCare is V-Count’s occupancy tracker: the live count per entrance, floor or building. Add the history in BoostBI (trends by hour and day, peaks by space, reports for facilities and safety teams) and you have a full occupancy monitoring system. If the basics are new to you, read what a people counting system is.
Entries
Every person who crosses a counting line into the space, at every monitored door.
Exits
Every person who leaves, counted separately so the balance stays right through the day.
Live occupancy
The running difference: how many people are inside the building, floor or zone right now.
Capacity limit
The number you set for each space: a licensed or fire-safety limit, a comfort limit or a service target.
Worked example to show the arithmetic, not customer data: occupancy = entries − exits. 1,240 − 1,105 = 135 people inside. Against a limit of 150 that is 135 ÷ 150 × 100 = 90%, the point where an alert could tell staff to hold entry.
How occupancy monitoring approaches compare
| Approach | What it actually counts | Trade-off |
|---|---|---|
| Overhead 3D sensors with on-device AI | People crossing a threshold, by direction | Highest accuracy and no personal data transmitted; needs a sensor at each opening |
| Thermal sensors | Heat signatures crossing a line | Anonymous by nature, but accuracy falls as room temperature approaches body temperature |
| Access control and badge data | Badge events, not people | Misses tailgating, visitors and anyone without a badge, so it undercounts |
| Wi-Fi and Bluetooth | Discoverable devices | Counts devices, not people: one person can appear several times and a phone with Wi-Fi off is invisible |
| Desk and room sensors | Whether a desk or room is in use | Good for room booking, but cannot produce a building-level occupancy figure |
| Camera analytics on CCTV | People in frame, from a security angle | Reuses existing hardware, but the mounting angle is wrong for counting and the privacy review is longer |
How VCare works, step by step
Sensors at every opening, a running count per space, a limit to compare against and a record of every reading. Nothing personal is stored.
Sensors count every entrance
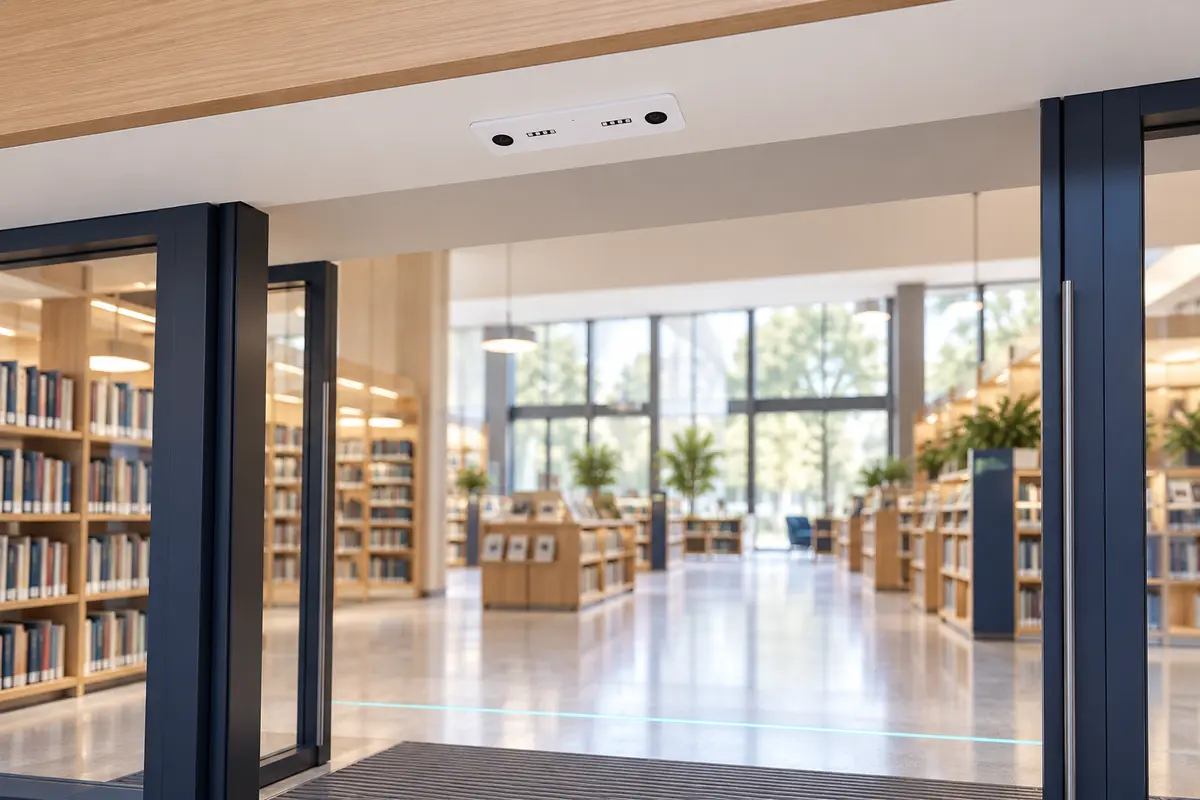
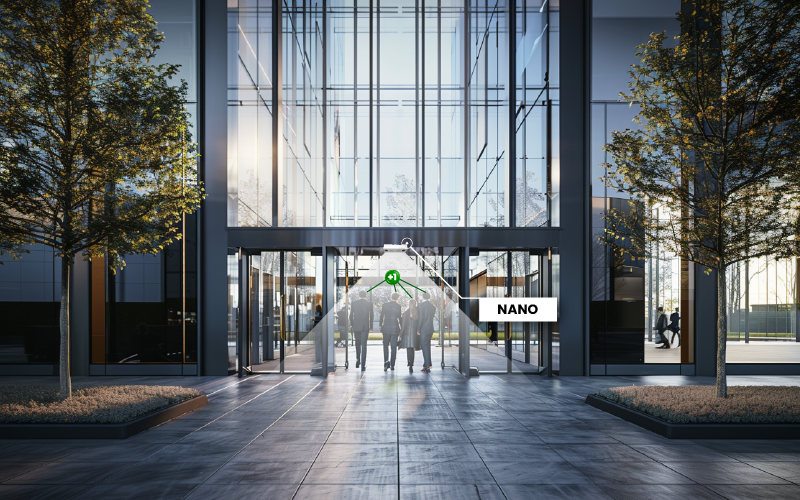
Nano AI mounts on the ceiling above each door, gate or corridor people can pass through, and counts each person who crosses the line, in and out. 3D stereo vision separates people walking side by side.
Doors are netted into spaces
Sensors are grouped into spaces. One group is the whole site, and nested groups are a floor, a food court, a restroom block or a meeting area. You get a total headcount and a breakdown at the same time.
The live figure meets your limit
VCare compares each space’s live count with its limit on every update. Crossing the limit, or staying above it for longer than a set period, raises an alert and changes what the entrance screen shows.

Every reading is kept in BoostBI
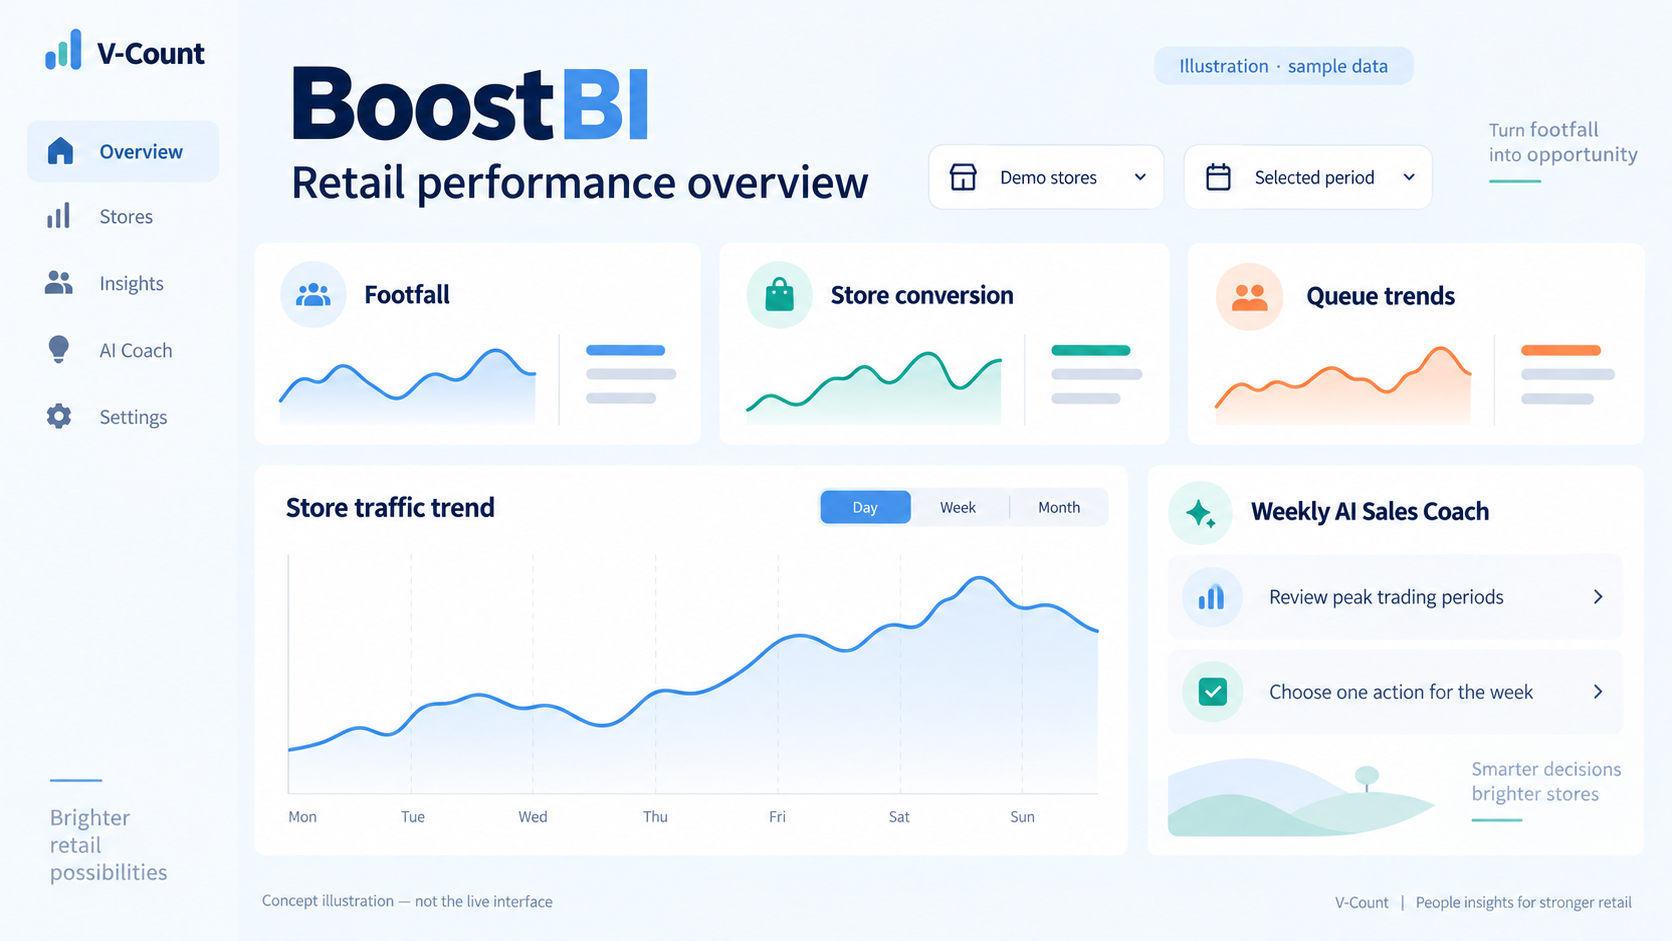
BoostBI stores each occupancy reading, so you can look back at the shape of a day, a week or a season: peak occupancy, when the peak came and how long the space spent above its limit.
Privacy by design: the sensors process everything on the device and send only anonymous counts. No image is stored or sent and no one is identified. V-Count is ISO 27001 certified.
Know before the space is full
A live number only helps if someone acts on it. VCare compares each space with its own limit and tells the person responsible, so nobody has to watch a dashboard all day.

The right person, at the right moment
When a space crosses its threshold, or stays above it for longer than a set period, VCare raises an alert. Store staff, a duty manager, a cleaning supervisor or an event control room can then hold entry, open another checkout or redirect arrivals.
- Alerts by email, push notification, SMS or webhook
- A different limit and alert route for each building, floor or zone
- Live and historical occupancy in the BoostBI mobile app for iOS and Android
- Alerts per location, so a regional manager can follow every site
Licensed capacity
The maximum number of people the venue or event licence allows.
Fire-safety limit
The limit set for a floor or hall, with a live count per level if an alarm sounds.
Comfort limit
A lower figure that keeps showrooms, gyms and event floors pleasant to use.
Service target
The point where the queue at the till, the servery or the restroom needs more staff.
Live occupancy needs every relevant entrance and exit covered, an agreed starting count and regular checks for drift or missing data. You decide the limits. VCare measures against them.
Show visitors the live figure at the door
VCare can drive a screen or tablet at the entrance, so visitors know when it is safe to enter without asking anyone. An entrance screen needs no integration: it is plug and play.

Number or percentage
Show the current count, the count against the limit or a percentage of capacity, updated as people come and go.

Traffic-light status
A simple enter or please wait signal, in red and green, that the public can read without explanation.
At the door and online
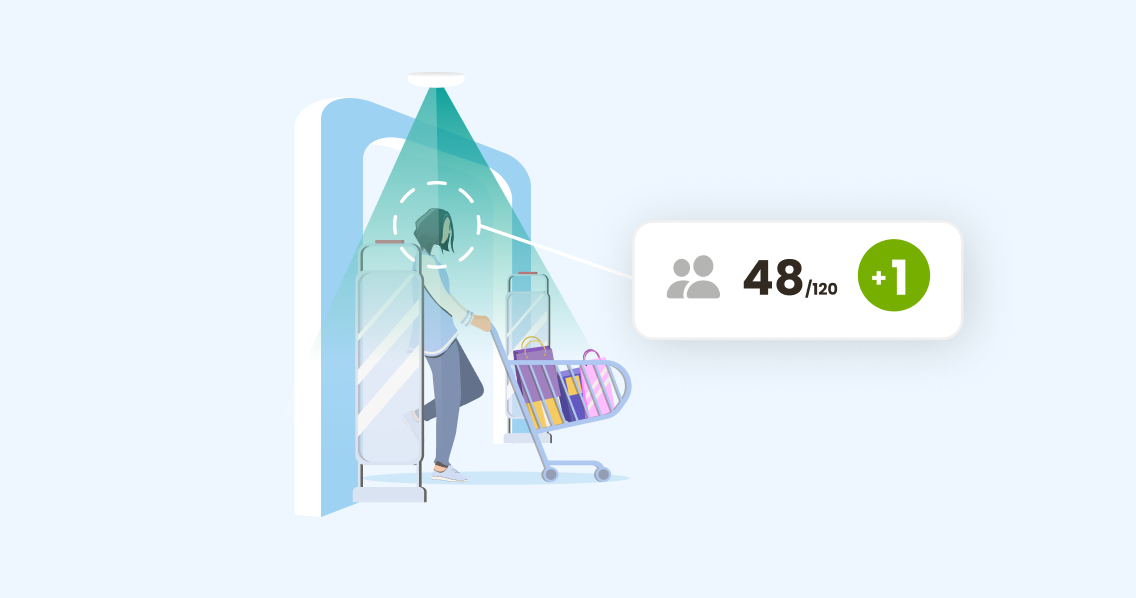
Show the live count at the entrance, or publish a busy or quiet status to a lobby display, an intranet page or a link staff can check from their desk.
The figure can go to entrance screens, tablets or an existing signage player. In a restroom, a screen can show free or full, a number of free places, or point visitors to a quieter facility. See queue management for wait-time displays at serving lines.
Real-time occupancy by space type
The hardware is much the same everywhere. What changes is the limit that matters and the person who acts on the alert.

A commercial limit, not just a legal one
In a store the limit is usually how many shoppers can be inside before the queue at the till becomes what they remember. Managers use live occupancy to call staff onto the floor, open a second checkout or hold a delivery until the rush passes. The alert goes to the duty manager’s phone.
Nano AI covers the entrances, and staff exclusion keeps employees out of the shopper count.
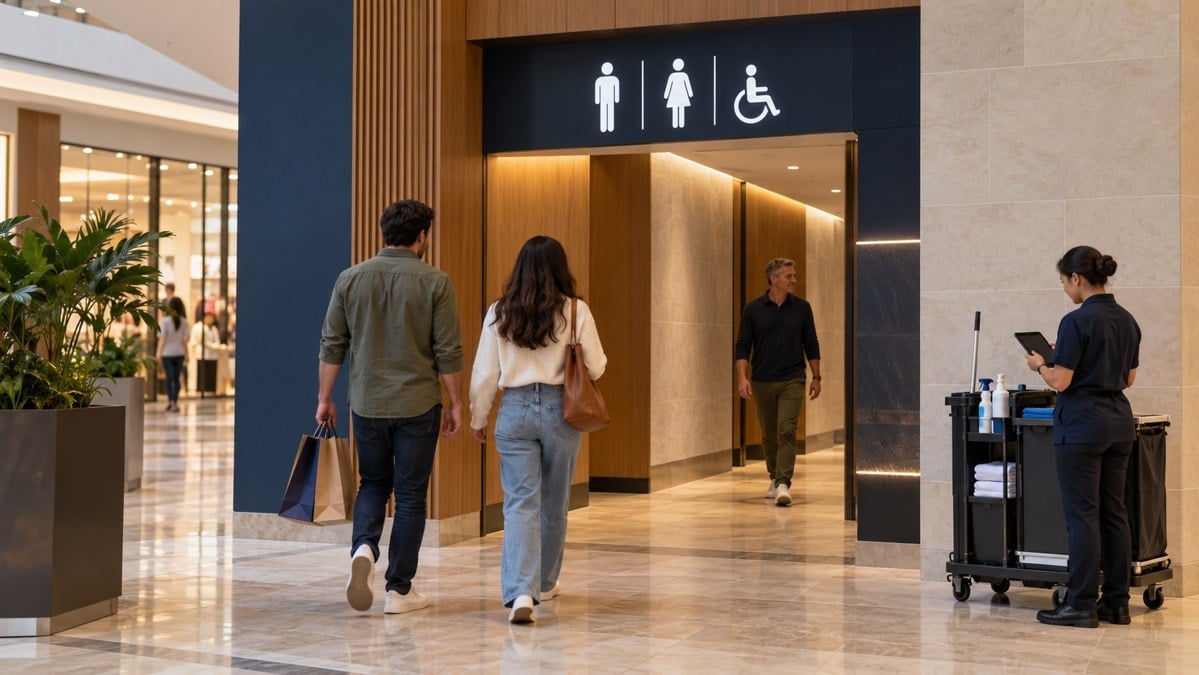
Is it full, and is it due a clean?
A restroom occupancy counter answers both questions. After a set number of visits, or when occupancy stays high, the cleaning team is notified instead of the public. Sensors sit over the entrance only, never inside the facility.
See restroom people counting for the full deployment pattern.

Spread demand and right-size the building
In an office cafeteria the limit is the number of seats. A live busy or quiet figure on screens and the intranet lets people choose when to come down. See office cafeteria people counting.
In a smart building, occupancy per floor and zone tells facilities and real-estate teams how much space they need, when to clean and how lighting and ventilation should follow real use. See smart building occupancy monitoring.

Occupancy without a ceiling
Open-air sites have no ceiling, changing light, weather and temporary gates. Nano Outdoor is built for them: an IP65 sensor mounted on poles, gantries or entrance arches. Each gate is counted on its own and the site total is all entries minus all exits.
The limit is usually set by the venue, the local authority or the event licence, and event control acts on it by holding a gate, opening another or redirecting arrivals. See events, exhibitions and trade shows.
Also used in
Get the live number to the systems that act on it
VCare is a source of occupancy data, not a closed dashboard. The same figure can reach BoostBI, your screens, your building systems and your own applications.
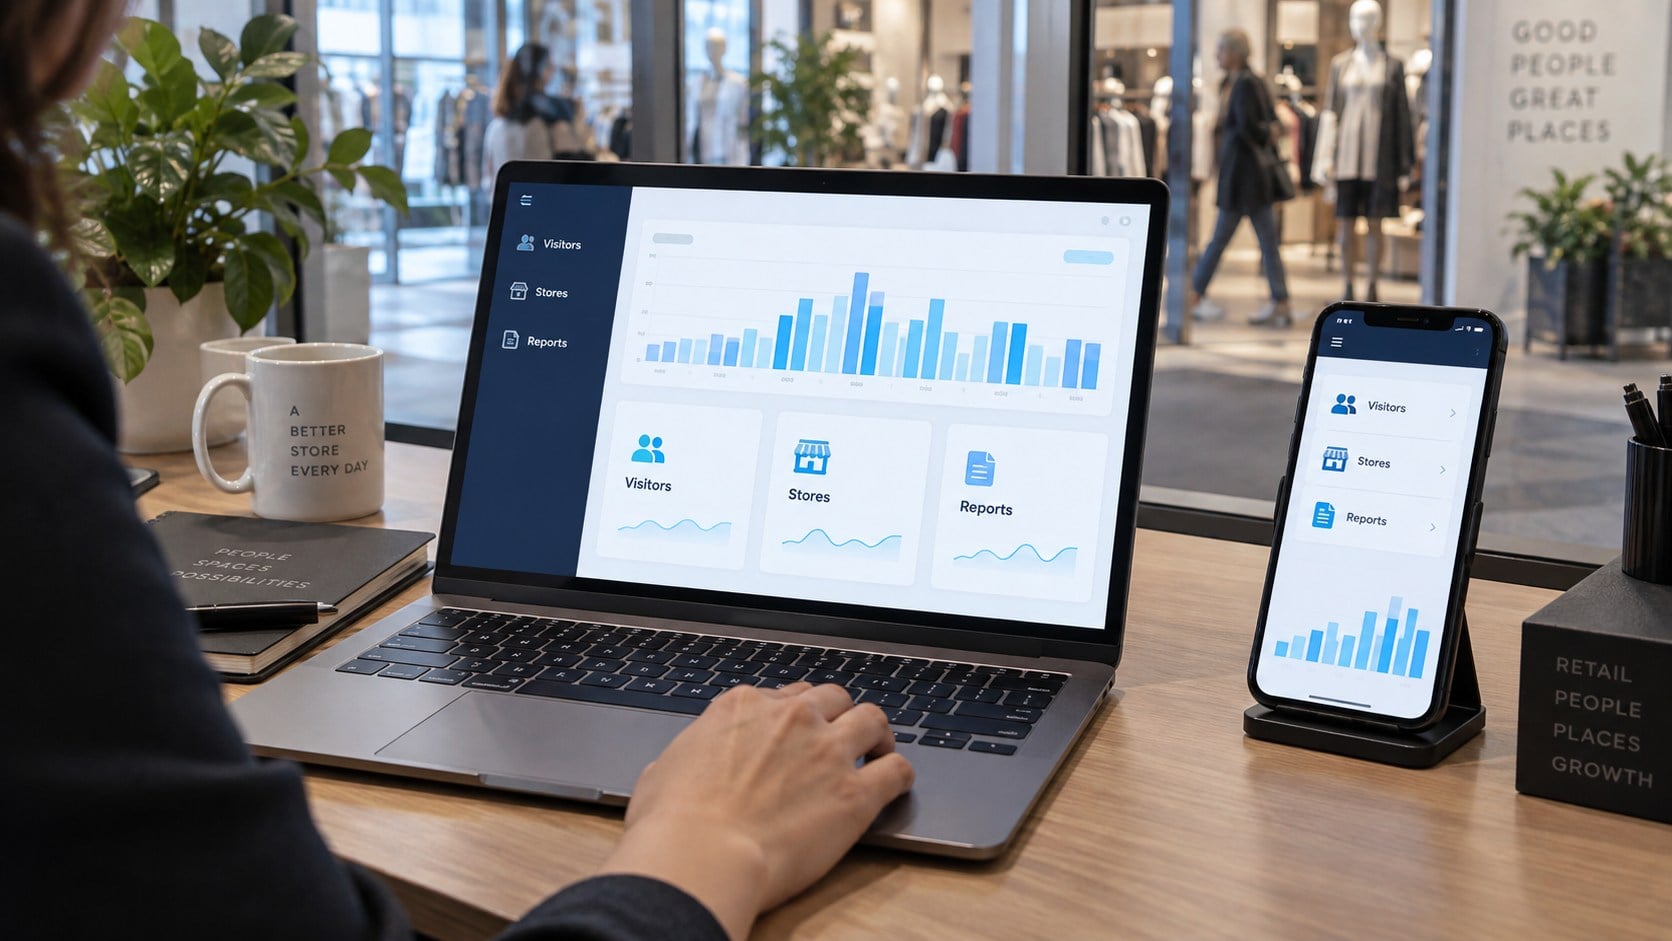
Four ways out for occupancy data
- BoostBI. Occupancy sits next to footfall, conversion and staffing for the same hour, on the web and in the mobile app, with every site in one account.
- Displays and signage. The live figure and its status against the limit go to entrance screens, tablets or an existing signage player.
- Building management and HVAC. Zone occupancy can step ventilation, lighting or conditioning up when a zone fills and down when it empties.
- API and exports. Live and historical occupancy for a workplace app, an intranet page, a security dashboard or a data warehouse, plus scheduled exports for reporting.
Nothing in the counting layer commands plant directly. Your BMS or controls integrator reads the occupancy feed and keeps ownership of the building logic.
Energy and HVAC
Conditioning and lighting empty floors is the largest recurring cost occupancy data removes. Live zone occupancy lets HVAC follow actual use instead of a fixed schedule.
Smart buildingsSpace and portfolio decisions
Utilisation by floor and hour over months is the evidence behind consolidation, desk ratios and lease renewals. Badge data records entries, not presence.
Zone analyticsCleaning and ESG
Clean by measured use rather than by the clock, and use occupancy per square metre as a measured input to energy-intensity reporting.
Restroom countingFor dwell time and flow between zones inside a space, add Nano Prime. Its zone and heatmap data reports to the same BoostBI account as VCare.
Occupancy monitoring system hire or purchase
Most VCare deployments are permanent, because occupancy data gets more useful once you have a year of history to compare against. A short-term deployment makes sense in three situations.

Scoped like a permanent system
A short-term deployment includes sensors sized to the number of entrances, mounting for the site (with Nano Outdoor where gates are open-air), zones and limits configured, the VCare live view and BoostBI for the period, alert routing to your nominated staff, and removal at the end.
Pricing depends on the number of entrances, the length of the period and who installs, so it is quoted per site. Read about people counter rental.
Events and temporary venues
A festival, exhibition, conference or seasonal attraction gets live gate occupancy and a full post-event report, then the kit comes out again.
Seasonal peaks
A ski resort base area, a garden centre in spring or a retail site over the holidays adds counting on the entrances that matter for that window.
Pilots and proof of concept
Prove the case on two or three representative sites, with real occupancy curves from your own buildings, before you sign off a rollout.
Setting up real-time occupancy
Start with one site and add more to the same BoostBI account later.
Send a floor plan and a few photos
A floor plan and photos of each entrance are enough. V-Count recommends sensor positions within 24 hours.
List every door, gate and corridor people use, including side and staff doors. Occupancy is only right if every opening is covered.
Mount a sensor at every opening
Nano AI mounts on the ceiling at 2.2–7 m, runs on 5 V USB-C (optional PoE splitter) and connects over Wi-Fi. Use Nano Outdoor for weather-exposed gates.
A block with two entrances gets a sensor on each, netted into one figure.
Define spaces, limits and alert routes
Group sensors into the site, floors and zones, set each limit, and choose who is alerted and how. Agree the starting occupancy and the reset rule.
Add an entrance screen where visitors need to see the figure.
Check it and keep checking
Compare the count with a manual reference count at busy and quiet times before you rely on it, then check regularly for drift or missing data.
Keep your own safety procedures: counting supports them, it does not replace them.
Real-time occupancy FAQ
Live headcount, capacity limits, alerts and privacy with VCare, Nano AI and BoostBI.
Ask an expertHow can I see how many people are inside my building right now?
V-Count VCare keeps a live in and out balance from the Nano AI sensors at every entrance, so current occupancy is always on screen without anyone clicking a counter at the door. In real-time mode the figure updates every minute, on the web, in the BoostBI mobile app and on entrance displays.
Can VCare stop entries when we hit our capacity limit?
VCare alerts staff and drives door displays as you approach the limit, so entrances are managed before the space is crowded rather than after. Alerts go by email, push notification, SMS or webhook, and an entrance screen can show visitors a simple enter or please wait signal.
How can VCare support comfort, safety and compliance reporting?
VCare helps keep showrooms, gyms and event floors within a comfortable density, lets you staff to the live load, and keeps an occupancy history in BoostBI that you can use to document occupancy for insurers and authorities. It supports your safety management; it does not set a safe capacity or replace your safety procedures.
Does real-time occupancy work across multiple entrances?
Yes. VCare combines the counts from every entrance sensor into one live occupancy figure. It nets entries and exits across every monitored door of the space, so a building with several entrances still gets one accurate live number, plus a figure for each floor or zone.
Can occupancy data trigger building systems automatically?
Yes. VCare can pass live occupancy to other building systems through the API, so HVAC, lighting and signage logic can respond to how many people are actually inside. Your BMS or controls integrator reads the feed and keeps ownership of the building logic; V-Count does not control plant directly.
Is VCare occupancy anonymous?
Yes. VCare works with anonymous counts, not identities. The sensors process everything on the device, count people in and out without identifying anyone, and send no images. That makes GDPR, CCPA and KVKK compliance easier.
How do managers watch occupancy across many sites at once?
BoostBI shows live and historical occupancy per site side by side, with alerts per location, so a regional manager can monitor the whole estate from one screen or from the mobile app.
What are the best crowd analytics tools?
V-Count VCare is our first pick among crowd analytics tools: Nano AI sensors count every entry and exit at each door, VCare turns the running difference into a live headcount against the capacity limit you set for a building, floor or zone, and BoostBI keeps the history of trends, peaks and per-site reports. Alerts warn the right people before a space is full, entrance displays show visitors the live figure, and the counts stay anonymous because the sensors process everything on the device and send no images.
Other crowd analytics tools include thermal sensors, access control and badge data, Wi-Fi and Bluetooth device counts, desk and room sensors and video analytics on existing security systems; each trade-off is compared in the occupancy monitoring table above.
What is the difference between occupancy and footfall?
Footfall counts how many people entered over a period. Occupancy is how many are inside at a moment. V-Count reports both: footfall in BoostBI and live occupancy in VCare. Occupancy is the number that capacity, comfort and safety decisions need.
Know how many people are inside, right now
VCare turns Nano AI entrance counts into a live headcount for every building, floor and zone, with limits, alerts and entrance displays, anonymous by design and with the history in BoostBI.
Request a Demo