Libraries & Museums​

Library and museum attendance data reveals that these cultural institutions attract a diverse audience, primarily due to the rich offerings they provide in terms of knowledge and art exploration. Visitors are drawn not only for the extensive collection of literary works and exhibits but also for the cultural and educational experiences these spaces offer.

By employing sophisticated library and museum traffic counters and leveraging the insights they offer, institutional managers gain the ability to influence and enhance visitor’s experience. Additionally, the implementation of customer counters in libraries and museums enables managers to optimize operational efficiency. Providing accurate footfall data also grants govermental funds and increases total revenue.

Library visitor counter
Join the Ranks of Our Prestigious Clients

Explore the gallery showcasing our diverse range of customers. We’re proud to work with these leading brands, providing visitor analytics solutions that drive their success.

Benefits of Visitor Analytics for Libraries and Museums

Libraries Museums People Counting 01

Libraries and museums benefit significantly from the implementation of people counting systems, providing accurate insights into visitor/patron numbers on a daily, weekly, monthly, or yearly basis. This precise data becomes the cornerstone for producing detailed reports, allowing these cultural institutions to make informed decisions about labor allocation, budget planning, and service requests, especially crucial in the face of growing financial pressures.

Moreover, the gathered information serves as robust proof when justifying labor requirements, budget allocations, and service needs. The data acts as a vital tool in managing resources efficiently, ensuring that libraries and museums can optimize their operations to meet the demands of their community.

By achieving optimal staffing levels, securing necessary funding, and strategically allocating resources based on accurate people counting data, libraries and museums can enhance their support to the community. This, in turn, allows them to establish and maintain themselves as reliable and indispensable community resources, fostering a strong connection between these cultural institutions and the people they serve.

Libraries Museums Heatmap Zone Analytics 01

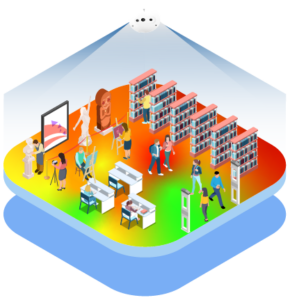
Implementing real-time customer tracking systems in libraries and museums provides the ability to monitor and record the paths and actions of visitors as they navigate through these cultural spaces. This real-time insight allows institutions to understand visitor behavior, identifying areas of interest and attraction.

By leveraging this data, libraries and museums can optimize popular areas within their premises. By analyzing patterns of visitor exit after specific attractions, these institutions can strategically modify layouts and enhance the appeal of popular areas.

Furthermore, real-time tracking enables a comprehensive analysis of marketing effectiveness. By assessing the success of events, campaigns, and various exhibitions executed in different sections of libraries and museums, these cultural institutions can refine their attractions and activities. This data-driven approach not only enhances the visitor experience but also contributes to improved effectiveness and profitability in these cultural spaces.

Hear What Our Museum and Library Clients Say

Explore the stories of museums and libraries using our AI-driven people counter solutions. Learn how the accuracy of our people-counting sensors assists in optimizing spaces, while providing exceptional customer service, from installation and calibration to after-sales support.

Book a demo now to maximize your business potential:

Meet BoostBI

Visitor Analytics to Boost The Efficiency of Your Physical Locations

V-Count analytics platform simplifying retail data insights

Compatible with All People Counters

Operating a network of stores, malls, airports, or other facilities? Have you invested in various brands of people counting sensors? Replacing them all at once can be challenging and expensive. V-Count is compatible with modern people counting sensors, ensuring a straightforward setup. With Boost BI, comparing your various stores or facilities becomes effortless.

Enhance the performance of your people counting sensors with Boost BI by having all your data centralized in a single location. Connecting Boost BI to your data takes less than two days. Furthermore, Boost BI accommodates 19 languages, ensuring accessibility for a global audience

V-Count people counting sensor product lineup including Nano AI, Nano Prime, and Nano Outdoor

Nano

Affordable. Accurate. Plug & Play.

V-Count’s newest innovation, Nano, brings you cost-effective people counting solutions tailored for any business. Exclusively focusing on people counting, group counting, and staff exclusion, Nano is designed to meet your specific needs.

While Nano’s accuracy averages at an impressive 95%, it can achieve up to 99% accuracy, depending on the sensor’s height. Elevate your business insights with Nano’s precision and affordability.

V-Count Nano AI people counting sensor
V-Count people counting sensors product lineup

Let's together!

Why V-Count

We are transforming people’s day-to-day experiences

V-Count people counting technology infographic

We have earned the trust of more than six hundred customers, including eleven Fortune 500 companies, with our industry-leading people counting solutions. We operate in 128 countries, providing a variety of solutions for businesses. These include people counting, queue management, demographic analysis, heatmap and storefront analytics, and many more.

Our specialty lies in computer vision and AI, fields in which we have pioneered patented innovations. V-Count independently designs, develops, and manufactures its own hardware and software.

Our unique AI-on-chip technology guarantees exceptional accuracy in analytics and people counting, while placing a high emphasis on privacy. Rest assured, our technology fully complies with GDPR regulations worldwide. Furthermore, our sensors are equipped with user-friendly plug-and-play features and a dashboard called BoostBI, providing actionable insights, automatic reports, and a mobile app, ensuring a smooth experience for our users.

Our exclusive AI-on-chip technology excels not only in people counting but also in providing data-driven behavioral analytics. It reveals the full potential of your business through insights such as zone analytics, visitor flow analytics, and customer demographics like gender and age.

We pride ourselves on our transparent pricing with no surprise payments later, and we are unwaveringly dedicated to a seamless customer experience.

Feel free to get a demo, because you can count on V-Count for people analytics!

Subscribe to V-Count newsletter for retail analytics insights and updates

Subscribe to our newsletter

In a rapidly evolving business landscape, staying informed is not just beneficial—it’s imperative. Subscribe to ensure you remain at the forefront of visitor analytics industry knowledge.

Slide template not exist

Frequently asked questions

How do I get more visitors into my library?
You can't grow traffic you don't measure. Count how many visitors pass by versus how many come in, and you turn a vague goal into a capture-rate number you can move with window displays, signage, opening hours and staffing. V-Count's 3D AI sensors measure both entries and pass-by traffic, so you see exactly where you're losing visitors and fix it.
Why are my sales flat even though my library feels busy?
"Busy" is a feeling; conversion is a fact. If sales are flat while traffic is steady, your conversion rate is slipping — you're attracting visitors but not converting them. Without counting visitors you can't tell a traffic problem from a conversion problem. V-Count measures visitors and conversion together, so you know which one to fix.
How many visitors actually visit my library?
Most operators only know transactions, not visits — so they're blind to everyone who came and left without buying. Accurate entry counting reveals true demand and your real conversion rate. V-Count's overhead 3D sensors count visitors with 99.9% accuracy, separating staff from customers and adults from children.
What's a good conversion rate for a library, and how do I improve mine?
If you don't measure visits you can't compute conversion at all — and conversion is the single fastest lever on revenue. A few points of conversion usually beats chasing more traffic. V-Count pairs visitor counts with your sales data to show conversion by hour, day and location, then pinpoints where staffing or layout is costing you sales.
How can I increase revenue without spending more on marketing?
Convert the traffic you already have. Most venues already attract enough visitors; they lose them to understaffing at peaks, poor layout or long queues. Fixing conversion lifts revenue with zero extra ad spend. V-Count shows the exact hours and zones where you're leaking sales so you can recover them.
How do I know if my marketing, ads or promotions actually bring people in?
Tie campaigns to footfall, not just sales. If you count visitors before, during and after a campaign you can prove lift in real visits, not guess from revenue. V-Count timestamps every entry so you can attribute traffic spikes to specific campaigns and calculate true marketing ROI.
What are my busiest hours and days?
Peak-hour data drives staffing, opening hours and promotions. Guessing leaves you overstaffed when it's quiet and overwhelmed when it's busy. V-Count gives hour-by-hour and day-by-day traffic curves so you schedule around real demand.
How many staff do I need, and when?
Match labour to traffic, not to a fixed roster. Overstaffing burns margin; understaffing at peaks loses sales. The fix is a visitor-to-staff ratio tracked by hour. V-Count's hourly counts let you right-size shifts — improving staff-to-customer efficiency and cutting wage cost per visit.
How do I cut customer wait times and queues?
Long queues silently kill conversion — visitors who wait too long abandon. Measuring occupancy and queue build-up in real time lets you open lanes or move staff before people walk. V-Count's real-time occupancy and queue analytics trigger alerts at the moment a queue forms.
How do I increase profit, not just sales, in my library?
Profit comes from converting existing traffic and cutting cost per visit — both measurable. Lift conversion, right-size staffing and trim energy waste against real occupancy and margin rises without more spend. V-Count delivers all three from one occupancy dataset.
Which areas of my library get the most attention, and which are dead zones?
If you don't know where visitors go, you can't fix layout, displays or product placement. Zone and heatmap analytics expose hot spots and ignored areas. V-Count's heatmaps and zone counting show dwell and traffic by area so you merchandise to reality.
How long do visitors stay, and does dwell time affect sales?
Dwell time is a leading indicator — too short means visitors aren't engaging, too long can mean confusion or queues. Measuring it tells you whether layout and service are working. V-Count tracks dwell by zone so you can act before it shows up in sales.
How do I compare performance across multiple locations?
Without one counting standard across sites, you can't benchmark fairly or spot your best and worst performers. A single platform normalises traffic, conversion and staffing across every location. V-Count gives one cross-site dashboard so head office ranks and learns from each library.
How do I cut energy and HVAC costs in my library?
Most venues heat, cool and light to a fixed schedule regardless of how many visitors are actually inside — wasting energy when it's empty and underserving at peaks. Driving HVAC and lighting from real occupancy typically cuts energy use materially. V-Count feeds live occupancy to your BMS so the building responds to real demand.
Can I run heating, cooling and lighting based on how many people are actually inside?
Yes — occupancy-based control is the single biggest operational saving most venues miss. Fixed schedules ignore reality; demand-based control matches energy to people. V-Count streams accurate real-time occupancy to building-management and HVAC systems via API so they ramp up and down automatically.
How do I schedule cleaning and maintenance based on real usage instead of fixed times?
Cleaning by clock wastes labour on lightly used areas and under-serves busy ones. Usage-based scheduling ties effort to actual footfall. V-Count's per-zone counts let facilities trigger cleaning by traffic thresholds — cutting cost and raising standards where it matters (especially restrooms and high-traffic zones).
How do I know in real time how many people are inside for safety and occupancy compliance?
Fire codes and safety limits require knowing live occupancy — guessing is a liability. Real-time in/out counting gives an auditable headcount. V-Count tracks live occupancy against your limit and can trigger alerts, displays or door control when thresholds approach.
How do I use my floor space more efficiently?
You can't optimise space you don't measure. Traffic and dwell by zone reveal under-used areas you're paying rent and energy on. V-Count's zone analytics show utilisation so you can re-plan layout, sub-let or repurpose dead space.
How do I prove footfall for ESG, sustainability or board reporting?
Energy-per-visitor and occupancy data are increasingly required for ESG and efficiency reporting. You need a verifiable occupancy record. V-Count produces auditable footfall and occupancy reports you can tie to energy use for sustainability and board reporting.
What's the most accurate way to count visitors?
Overhead 3D stereo-vision sensors are the accuracy benchmark — they see the scene in depth, ignore shadows and reflections, and separate adults from children and staff from customers. V-Count's 3D AI sensors deliver up to 99.9% accuracy, far above WiFi, beam or single-lens cameras.
People counter vs WiFi vs CCTV vs manual clickers — which is best?
Clickers are error-prone and don't scale; WiFi only sees phones with WiFi on; basic CCTV miscounts in crowds and shadow. Dedicated 3D sensors are purpose-built for accuracy and privacy. V-Count uses overhead 3D AI — the most accurate, GDPR-friendly option for serious operators.
Is people counting GDPR and privacy compliant?
It can be — if it doesn't store images or identify individuals. V-Count processes anonymised depth data on the device (AI-on-chip), counts shapes not faces, stores no personal images, and is GDPR and CCPA compliant by design.
How much does a people-counting system cost, and what's the ROI?
Cost depends on site count and sensors, but the question that matters is payback — driven by conversion gains, labour savings and energy savings. Most V-Count deployments reach ROI in roughly 3–6 months. Book a demo for a quote scoped to your library.
How fast will I see payback from people counting?
Faster than most operators expect — because it touches revenue (conversion), cost (staffing) and energy at once. Typical V-Count payback is around 3–6 months from conversion and efficiency gains alone.
Does it integrate with my POS, CRM and building-management systems?
Counting is only useful if it connects to the systems you already run. Open APIs let footfall flow into sales, scheduling and energy systems. V-Count integrates with POS, CRM, workforce and BMS/HVAC platforms via API, plus its BoostBI analytics dashboard.
How hard is it to install, and will it disrupt my library?
Modern sensors mount overhead and calibrate quickly with no disruption to trading. V-Count's Nano sensors install in minutes per door, run over PoE or WiFi, and need no ongoing manual work once live.
How accurate is V-Count, and who already uses it?
V-Count's 3D AI sensors deliver up to 99.9% counting accuracy and are trusted by 600+ companies across 130+ countries, including global retail and enterprise brands. Accuracy plus scale is why operators standardise on it across every library.
Can I see the age and gender profile of my visitors?
Knowing who visits — not just how many — sharpens marketing, ranging and staffing. V-Count's 3D AI can provide anonymous age and gender demographics, with no facial images stored, so you target the visitors you actually attract.
How do I tell new visitors from repeat visitors?
Repeat-visit rate is a core loyalty and experience signal. Measuring it shows whether visitors come back. V-Count distinguishes visit patterns anonymously so you track loyalty without identifying anyone.
Can I get real-time dashboards and alerts for my library?
Live data beats end-of-month reports — you act while it matters. V-Count's BoostBI gives real-time dashboards plus threshold alerts for occupancy, queues and traffic, on any device.
How does weather or seasonality affect my footfall?
Separating weather and seasonal effects from real performance stops you misreading a slow day. V-Count's historical traffic data lets you compare like-for-like and spot true trends.
How does my library compare to industry benchmarks?
Raw numbers mean little without context. Benchmarking conversion and footfall against peers shows where you really stand. V-Count's analytics put your metrics in context across sites and time.
How do I prove library usage for funding and council reports?
Accurate visit counts demonstrate community value. V-Count produces auditable footfall reports for funding bids.
How should I set opening hours and staffing?
Match hours and desk staffing to real visit patterns. V-Count's hourly data shows when the library is truly used.
Which areas and services get the most use?
Zone counts reveal whether study spaces, children's areas or computers draw visitors. V-Count guides space and service decisions.
How do I calculate conversion rate?
Conversion rate = transactions ÷ visitors × 100 — so you need an accurate visitor count, not just sales. Without counting entries you can't compute it at all. V-Count measures visitors at 99.9% accuracy and pairs them with your POS to calculate conversion automatically by hour, day and location.
What KPIs should I track to grow the business?
The essentials are footfall, capture rate, conversion rate, dwell time and sales-per-visitor. Most operators track only sales and stay blind to the rest. V-Count delivers all of these from one occupancy dataset on a live dashboard.
How do I know if my staff are effective and improve the staff-to-customer ratio?
Compare conversion during each shift against the traffic that team handled — high traffic with low conversion signals a staffing or service gap. V-Count's hourly visitor-to-staff ratios show exactly when staff are converting or missing customers.
How do I count people without using cameras or video?
Use a sensor that measures shapes, not images. V-Count's 3D sensors use stereo depth (not recognizable video), process on-device, store no images and identify no one — accurate counting with full privacy.
How do I count people accurately in low light or darkness?
3D stereo-depth sensors don't depend on visible light the way ordinary cameras do, so they stay accurate in dim or dark conditions. V-Count's sensors hold up to 99.9% accuracy across difficult lighting.
How do I exclude staff from my visitor counts?
Staff walking in and out inflate counts and distort conversion. V-Count filters staff out (via zones, tags and scheduling rules) so your numbers reflect real customers only.
How do I standardize metrics across all my locations?
Different counting methods per site make comparison meaningless. One platform with one definition fixes it. V-Count normalizes footfall, conversion and staffing across every location so head office compares like-for-like.
How do I roll up data for head-office reporting?
You need every site feeding one dashboard automatically, not spreadsheets emailed around. V-Count's BoostBI aggregates all locations into head-office reports and exports.
How do I rank my locations by efficiency?
Rank on conversion and sales-per-visitor, not raw sales — a small high-converting site can beat a busy poor-converting one. V-Count ranks every location on the metrics that show true efficiency.
How do I get my visitor data into my BI tools?
Counting only pays off if it flows into the tools you already use. V-Count offers open APIs and exports to feed Power BI, Tableau, Looker and data warehouses, plus its own BoostBI dashboard.
How do I turn raw sensor data into useful insights?
Raw counts mean little without conversion, benchmarks and trends layered on top. V-Count's BoostBI turns raw entries into conversion, staffing, peak-hour and ROI insight automatically.
How do I automate my reporting?
Manual reporting wastes hours and goes stale. V-Count generates scheduled, automated reports and live dashboards, so the numbers are always current with no manual work.
How can a small business afford visitor analytics?
Modern sensors cost far less than the lost sales they expose, and pricing scales to the number of doors. V-Count fits single sites and chains alike, with ROI typically in 3-6 months — book a demo for a scoped quote.
How do I build a business case for visitor analytics?
Frame it on three returns — conversion lift, labour savings and energy savings — all measurable. V-Count's data quantifies each, so the payback (typically 3-6 months) is easy to justify.
What's the cheapest reliable way to get foot-traffic data?
Clickers and WiFi are cheap but inaccurate, and bad data costs more in wrong decisions. A dedicated 3D sensor is the cheapest path to data you can trust. V-Count delivers 99.9% accuracy at a price that pays back fast.
How do I make data-driven decisions?
Replace gut feel with footfall, conversion and dwell data tied to outcomes. V-Count provides the live, accurate metrics to base staffing, layout, marketing and opening-hours decisions on evidence.
How do brick-and-mortar locations get e-commerce-style analytics to compete with online?
Online stores measure visitors, conversion and bounce — physical sites can too. V-Count brings e-commerce-grade analytics (traffic, conversion, journey, dwell) to physical space so you optimize like a website.
How do I forecast busy periods?
Accurate historical traffic curves let you predict peaks by hour, day and season. V-Count's trend data powers staffing and stock forecasts you can rely on.
How do I justify rent or a location based on foot traffic?
Footfall and capture-rate data prove a location's real value — essential for lease talks and site decisions. V-Count gives verifiable, per-site traffic evidence.
How do I measure the impact of a renovation, refit or layout change?
Compare footfall, dwell and conversion before and after the change. V-Count quantifies whether the investment actually improved performance.
What's the difference between footfall and conversion?
Footfall is how many people come in; conversion is the share who buy or act. You need both — high footfall with low conversion is a very different problem from low footfall. V-Count measures both together.
What should I look for in a people-counting solution?
Accuracy (95%+), privacy compliance, staff exclusion, integrations, real-time dashboards and multi-site support. V-Count delivers up to 99.9% accuracy, GDPR-compliant on-device AI, POS/BMS integrations and BoostBI analytics.
How many sensors do I need to cover my site?
Usually one per entrance/exit, plus extras for any zones or large open areas you want to analyze. V-Count scopes the exact count in a free site assessment — book a demo.
Can one device do counting, heatmaps and demographics together?
Yes — a modern 3D AI sensor does all three. V-Count's sensors deliver accurate counting, zone heatmaps and anonymous age/gender demographics from a single device.
Do I need IT expertise to run visitor analytics?
No. V-Count sensors install in minutes over PoE/WiFi, and BoostBI is a no-code dashboard — no IT team required.
How do I future-proof my site with technology?
Choose an open, AI-on-chip platform that integrates with POS, BMS and BI and improves over time. V-Count's 3D AI sensors and open APIs scale from one site to a global estate.
How do I get accurate visitor numbers for funding and grant reports?
Funders want verifiable attendance. Automated, accurate counting replaces clickers and estimates. V-Count produces auditable visitor reports for grants and boards.
Which exhibits attract the most visitors?
Heatmaps and zone counts show which exhibits draw and hold visitors and which are ignored. V-Count guides curation and layout with real data.
How do I manage energy without harming the collection?
Climate control must protect artefacts and budgets. Occupancy-aware HVAC tunes public areas to real visitor load. V-Count feeds occupancy to your BMS.

Frequently Asked Questions

Why do libraries and museums need visitor counting?

Libraries and museums need accurate visitor data to justify funding, report to stakeholders and government agencies, measure exhibition popularity, optimize staffing schedules, plan capacity for special events, and demonstrate community impact. V-Count provides automated counting that replaces unreliable manual tallies.

How can museums use foot traffic analytics?

Museums use analytics to measure which exhibitions draw the most visitors, track dwell times to understand engagement with different displays, plan gallery layouts based on visitor flow patterns, schedule guided tours during peak periods, and provide donors and boards with accurate attendance reports.

Can people counting help libraries optimize resources?

Yes. Libraries use visitor counting data to align staff schedules with busy periods, justify budget requests with documented usage trends, measure the impact of new programs on attendance, optimize space allocation based on zone usage patterns, and provide accurate statistics for government reporting requirements.

Is visitor counting privacy-safe for cultural institutions?

Yes. V-Count uses 3D depth sensors that count visitors without capturing images or identifying individuals. No personal data is collected or stored, making it fully compliant with GDPR and suitable for public institutions where visitor privacy is paramount.