Restaurants and Bars
Restaurant visitor analytics starts at the front door. A sensor over the entrance separates arriving guests from staff and passers-by, so you know how many people walked in, at what time, and in which service period rather than only how many covers reached the till.
V-Count counts guests at street entrances, patios and terraces, bar areas, function rooms and takeaway counters, then splits every count by hour so breakfast, lunch, happy hour and late service each get their own demand curve. Add pass-by counting on the frontage and you get capture rate, the share of street footfall your venue actually converts.
Add zone counting and you can see bar occupancy against your capacity limit, waiting at the host stand, and how long a table stays busy before it turns.
Explore the gallery showcasing our diverse range of customers. We’re proud to work with these leading brands, providing visitor analytics solutions that drive their success.


















Benefits of Visitor Analytics for the Restaurants and Bars
Visitor analytics gives a restaurant or bar the numbers a POS cannot produce: how many people passed the door, how many came in, how many waited, how long they stayed and how full each area was at any minute. That makes the rota an evidence-based decision for both kitchen and floor, shows whether a promotion or a quiz night brought in extra guests or simply moved existing ones, keeps bar occupancy inside the licensed limit, and exposes the walk-aways that leave when the queue at the host stand looks too long.
Across a group, the same counts let every venue be compared on capture rate rather than on raw footfall.
Restaurant visitor analytics: what to measure in a restaurant or bar
A till system tells you how many covers you served. It cannot tell you how many people walked past the window, how many stepped in and left before ordering, or how long the bar sat at capacity on a Saturday night. Restaurant visitor analytics closes that gap by counting people instead of transactions. Six numbers do most of the work in a hospitality venue.
- Guests in, by day part. Arrivals split across breakfast, lunch, afternoon trade, dinner and late service, so every service has its own demand curve instead of one flat daily total that hides a dead Tuesday lunch inside a strong week.
- Pass-by traffic and capture rate. A sensor facing the street counts the people walking past your frontage; capture rate is the share of them who actually come in. It is the honest measure of whether your window, menu board, A-board and door staff are pulling trade off the pavement.
- Walk-ins versus covers. Counted arrivals set against covers in the POS expose walk-aways: groups that saw the queue, heard the wait time or looked at a full room and went somewhere else. Those lost covers never appear in any sales report.
- Table dwell and turn time. Zone counting across the dining room shows how long seated areas stay occupied, so you can check whether a two-hour booking slot matches what really happens on a Friday, and where turn time slips.
- Bar occupancy against capacity. A live headcount for the bar area, measured against your licensed or fire-safety limit, with a warning before you reach it rather than an apology afterwards.
- Queue length and wait at the door. How many people are standing at the host stand or the takeaway counter, how long they wait, and at which minute of the evening it peaks.
Together these turn people counting into a staffing and layout tool for hospitality rather than a reporting curiosity.
Where the sensors go in a restaurant or bar
Hospitality sites are awkward to measure: glass frontages, double doors, dim evening lighting, a terrace that only trades in summer, and a bar that fills and empties on a completely different rhythm to the dining room. Sensor placement follows the decisions you want to make, not the floor plan.
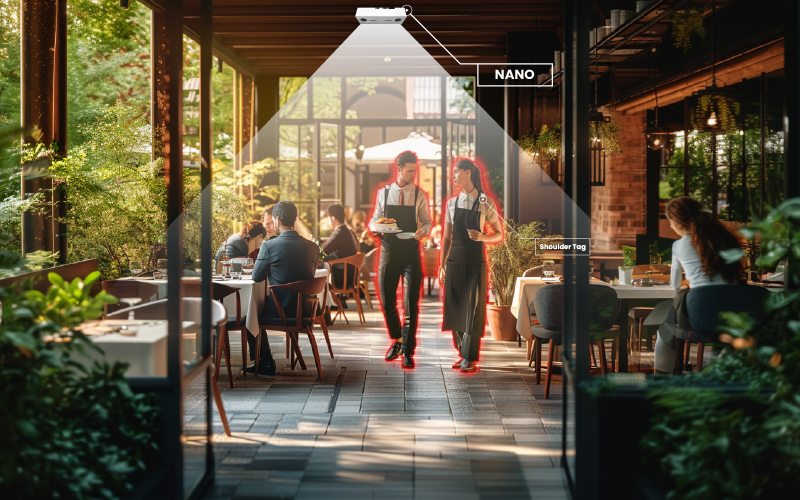
- Main entrance. Nano AI over the door gives directional in and out counts, so you hold a live headcount as well as a daily arrivals total. Staff, runners and delivery riders can be kept out of the guest figure so the number means covers, not movement.
- Frontage and pass-by. Nano Outdoor is weather-rated for the street side of the building and counts the people walking past, which is the denominator you need before capture rate means anything.
- The bar itself. A dedicated bar people counter over the bar approach, or over the doorway of a separate bar room, splits drinkers from diners. In converted warehouses, atrium spaces and low-lit late-night bars, Nano Prime 3D stereo handles high ceilings and poor light where a simple beam counter gives up.
- Patio, terrace and beer garden. Outdoor seating is usually the most profitable square metre you own and the least measured. Nano Outdoor counts entries to the terrace so you can staff it and see how weather moves trade between inside and outside.
- Takeaway and collection counter. A separate count on the collection point keeps couriers and click-and-collect customers out of the dine-in numbers, and shows whether your pickup area is sized for the volume it now carries.
- Function rooms and private dining. Zone counts confirm real attendance against the booking sheet, which settles minimum-spend and per-head billing arguments quickly.
Real-time headcount and capacity alerts come from VCare, while every count lands in BoostBI, where hourly footfall, capture rate, dwell and occupancy sit next to each other and can be scheduled out to managers. All of it is anonymous: the sensors count shapes and movement, not identities, and no images of guests are stored.
How restaurant and bar operators use the data
- Building the rota around real arrival curves. Kitchen and floor peak at different minutes: the kitchen loads when orders land, the floor loads when guests arrive. Hourly arrival counts let you start a section or a second chef fifteen minutes before the rush rather than fifteen minutes into it.
- Deciding opening hours. Pass-by counts show whether there is trade outside your current hours. Opening earlier for breakfast or holding the bar open an extra hour is a footfall question before it is a labour-cost question.
- Staying inside capacity and licence limits. Live occupancy against your permitted number gives door staff a figure to work to on a busy night, and gives you a record afterwards if a licensing officer asks.
- Judging layout and section changes. Move the host stand, open the mezzanine, re-point the bar service area, then compare capture rate, dwell and turn time for the same weekday before and after.
- Measuring promotions properly. Happy hour, quiz night, a match on the screens or a delivery-platform discount each get judged on incremental guests through the door, not just on the takings line, which can move for reasons that have nothing to do with the offer.
- Separating delivery from dine-in. When counted arrivals fall while revenue holds, the shift is to delivery and collection. Seeing that split lets you move labour from floor to kitchen and pack station instead of cutting hours across the board.
Restaurant & bar foot traffic analytics across a group
One site gives you a trend. A group gives you a benchmark. Restaurant & bar foot traffic analytics across multiple venues lets you compare sites that would otherwise be impossible to compare: a high-street bar and a retail-park restaurant have very different pass-by volumes, so you rank them on capture rate and on covers per counted arrival rather than on raw footfall.
That turns the weekly trading call into a specific conversation, because a venue sitting well below the group capture rate has a frontage, staffing or door problem you can go and look at.
The same numbers support site selection and refit approval. Measure the pass-by traffic at a prospective unit before you sign, then hold the new site to the capture rate the rest of the estate achieves. After a refurbishment, compare the same weekday and day part before and after, so the investment is judged on guests gained rather than on a feeling that the room looks better.
Queues at the door, host stand and takeaway counter
Waiting is where hospitality loses guests silently. A group that leaves the doorway because the queue looks long never becomes a cover, never appears in the POS, and never complains.
Counting the people waiting at the host stand, at the bar service point and at the collection counter shows how often that happens and at which minute of the evening. Pair it with queue management to trigger an alert when the wait passes your service standard, so a manager opens a second till, calls a runner to the door or moves someone onto collections before the queue does the damage.
See how it works for your venues in a short walkthrough of your own floor plan: request a demo.
Restaurant and bar people counting FAQ
What is capture rate for a restaurant or bar?
Capture rate is the share of people walking past your frontage who actually come in. If 800 people pass between six and eight in the evening and 96 walk through the door, your capture rate for that window is 12 percent.
You need two counts to calculate it: an outdoor sensor on the street side and a door sensor on the entrance. V-Count pairs Nano Outdoor for pass-by with Nano AI on the door, then BoostBI reports capture rate by hour and by day, so you can see exactly which service periods your frontage is failing to convert.
Can a people counter tell the difference between guests, staff and delivery drivers?
Yes, within reason. Waiters crossing the threshold, couriers collecting orders and smokers stepping outside all distort a raw door count. V-Count sensors count direction, so repeat crossings by the same staff route show up as a pattern you can exclude, and a separate sensor on the collection counter or staff entrance keeps courier traffic out of the guest figure entirely.
Most venues set this up during commissioning by mapping which doors carry which kind of traffic, rather than trying to correct the numbers afterwards.
Do I need a separate bar people counter if I already count the main entrance?
If the bar and the dining room trade differently, yes. A door count tells you how many people entered the building; it cannot tell you that the bar was three deep at nine while half the restaurant sat empty.
A bar people counter over the bar approach or the bar room doorway gives you bar occupancy, dwell and its own peak curve, which is what you need for bar staffing, for last orders decisions and for capacity on match nights and event nights.
How do I count guests on a patio, terrace or beer garden?
Outdoor seating needs a weather-rated sensor. Nano Outdoor is built for exposed positions and counts entries to the terrace or garden area the same way an indoor sensor counts a doorway.
That gives you an inside versus outside split, which matters because terrace trade swings with the weather and usually needs its own server. Once you have the split you can see how much of a warm evening actually reaches the till, and whether outside covers are being lost to slow service rather than to the forecast.
Does people counting work in dim bar lighting?
It does, but sensor choice matters. Late-night bars, basement rooms and mood-lit dining areas defeat simple beam counters and struggle with basic camera counting. Nano Prime uses 3D stereo vision, which works from depth rather than from a well-lit image, so it holds up in low light and under high ceilings in converted warehouse or atrium spaces.
Nano AI covers standard-height, normally lit entrances. You send a floor plan (a simple drawing is enough) and a few photos of the ceiling and lighting, and V-Count recommends which sensor sits where within 24 hours, before anything is ordered.
How can I show I stayed within my licensed capacity?
Live occupancy counting gives you a running headcount for the venue and for individual rooms, and BoostBI keeps the history. VCare compares that headcount against the limit you set and warns door staff before it is reached, so the decision to hold people at the door is made on a number rather than on a glance across the room.
Because the record is timestamped and kept, you can also show a licensing officer or insurer what your occupancy actually was on a given night.
How does people counting show the shift between delivery and dine-in?
Revenue alone hides it. If counted arrivals drop month on month while sales stay flat, the trade has moved to delivery and collection, and your labour is probably in the wrong place.
Counting the dining room, the bar and the collection counter separately turns that into a measured split rather than a hunch, so you can move hours from floor service to kitchen and packing, resize the pickup area, and judge whether a delivery platform is adding volume or simply moving your existing guests off your own tables.
How many sensors does a restaurant with two entrances and a terrace need?
At minimum one per entrance, because an uncounted door means every total is wrong, plus one for the terrace and one for any bar area you want to manage separately. A typical two-door restaurant with outdoor seating runs three to four sensors, with a fifth on the collection counter if takeaway volume is meaningful.
Counting zones rather than the whole floor is what makes the data usable, so the survey starts from the decisions you want to make and works back to the placements.