Churches, Mosques, Synagogues, and Temples
Places of worship count people for reasons a shop never has to think about: keeping a packed festival service inside its safe capacity, giving a board or diocese an honest attendance figure, and knowing early enough to open the annex before families are left standing at the back. A V-Count church people counter — the same sensor serves as a mosque, synagogue or temple people counter — mounts discreetly above each doorway and counts entries and exits anonymously, with no video recorded and no one identified.
BoostBI then reports attendance by service or prayer time, live occupancy against your posted limit, room-by-room use of sanctuary, annex and children’s spaces, and how this Ramadan, Easter or High Holy Day season compares with last year’s, so clergy, facilities teams and volunteers can plan from numbers instead of guesswork.

Explore the gallery showcasing our diverse range of customers. We’re proud to work with these leading brands, providing visitor analytics solutions that drive their success.


















Benefits of Visitor Analytics for Worship Spaces

In the Worship Spaces like churches, mosques, synagogues or temples, leveraging people counting and visitor analytics yields numerous benefits. By analyzing attendee preferences and event effectiveness, managers can discover which speakers are more popular and then tailor services to enhance engagement. Additionally by optimizing space layouts, adjusting seating, and organizing events during peak times to create a comfortable worship environment, communities can manage and grow their worship space. Managers can also use accurate foot traffic data to demonstrate your impact, attracting more funds and donations for continuous improvement.
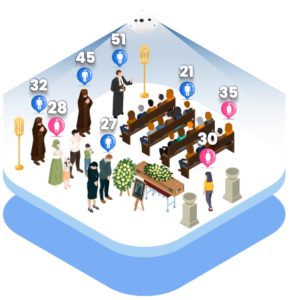
V-Count’s Visitor Analytics Solutions for Worship Spaces is not just for people counting. With AI-on-chip sensors V-Count can provide valuable demographic insights that enable churches, mosques, synagogues or temples to better understand their community. By leveraging this information, worship spaces can actively work for reaching more inclusivity and diversity within their community.
People counting for worship spaces: what to measure
A worship space people counter is not a retail till counter with a new label on it. Congregational data has its own vocabulary: attendance per service or prayer time, the split between a main sanctuary and its annex, how quickly a full hall clears, and how one festival season compares with the last.
These are the figures a V-Count system produces, automatically, every week, without a volunteer standing at the door with a clicker.
- Attendance per service or prayer time. Counts are cut by the exact windows that matter to you — each Sunday service, each of the five daily prayers, Friday congregational prayer, Shabbat evening and morning, an evening aarti — rather than by generic opening hours.
- Peak concurrent occupancy against safe capacity. Entries minus exits gives live occupancy, which can be compared with the capacity figure set by your fire or building authority and shown on a screen in the lobby.
- Entrance split across multiple doors. Large sanctuaries have three, five, sometimes a dozen ways in. Counting every one of them shows which doors carry the load and where greeters and stewards are actually needed.
- Room-level use: children’s rooms, classrooms, annexes and halls. Sensors over interior doorways show whether the overflow room was opened too late, or whether a classroom has been half empty all term.
- Clearance and egress time. How long a full building takes to empty is a safety number as much as an operational one, and it is measurable once every exit is counted.
- Seasonal comparison. Ramadan and Eid, Lent and Easter, the High Holy Days, Diwali, Christmas, patronal and temple festivals — each season can be compared like-for-like with the same season in previous years.
- Outdoor and parking flow. Courtyards, car parks and gate approaches can be counted too, which is how teams learn that arrival congestion starts fifteen minutes earlier than anyone assumed.
Every one of these figures is an aggregate. The system counts bodies crossing a line, not people it recognises, so church visitor analytics here means attendance trends, not a register of who came.
What differs by venue: churches, mosques, synagogues and temples
The sensors are identical from one faith community to the next. What changes is where the doorways are, when the peaks fall, and which numbers the leadership actually needs.
Churches
A church people counter is usually asked one question first: how many attended each service? Because services run back to back, the counting windows must separate the 9:00 congregation from the 11:00 one, including the overlap in the narthex while one group leaves and the next arrives.
Multi-campus churches add a second question — how the campuses compare — which a single cloud dashboard answers without anyone reconciling spreadsheets. Counting children’s ministry rooms and fellowship halls separately is what turns raw footfall into church visitor analytics: attendance by service, by room, by season, with Christmas and Easter charted against the same weeks last year.
Mosques
A mosque people counter has to cope with five prayer times a day, a Friday peak that dwarfs the rest of the week, and a Ramadan month in which taraweeh fills the building late at night. Many mosques have separate entrances for men and women and separate prayer halls; each doorway gets its own sensor, so the two areas are reported separately and capacity is managed for each hall rather than for the building as a whole.
Shoe racks and wudu areas create their own bottlenecks, and counting the doorway between the ablution area and the prayer hall shows when that flow, not the main entrance, is the constraint.
Synagogues
A synagogue people counter is built around a very uneven year. Weekday minyan numbers are small and stable; Shabbat is larger; Rosh Hashanah and Yom Kippur can bring several times the usual congregation, often with overflow seating in a social hall.
Counting the main sanctuary and the overflow space separately shows exactly when the overflow was needed and for how long — useful when planning seating, security staffing and ticketing for the High Holy Days. Where automated systems must not be operated on Shabbat or festivals by the congregation, the sensors simply run and record on their own, with staff reading the data afterwards.
Temple people counter
A temple people counter deals with long opening hours, continuous flow rather than fixed service times, and festival surges that can multiply a normal day many times over. Queues form outside the gate, shoe-deposit areas act as a second entrance, and visitors often move through a sequence of shrines rather than sitting in one hall.
Counting the outer gate, the inner sanctum approach and each shrine area separately shows where the crowd actually stalls during a festival, which is where stewards, barriers and one-way routing make the most difference.
Where the sensors go in a place of worship
Sensors are mounted overhead at each threshold and look straight down, which is why they count reliably in a crowd and why they see no faces. A typical installation covers:
- Every public entrance and exit. Main doors, side doors, the door the choir or clergy use, and any door that is only opened at festivals — if it is not counted, occupancy drifts.
- The sanctuary, prayer hall or nave itself, counted separately from the lobby, so occupancy reflects who is actually seated rather than who is in the building.
- Annexes, overflow rooms, children’s and classroom areas, so leaders can see whether extra space was opened in time.
- Ablution, shoe-deposit and cloakroom thresholds, which are the real bottleneck in many mosques and temples.
- Outdoor gates, courtyards and car parks, where arrival and departure congestion begins.
Nano AI is the usual choice indoors: a compact AI-on-chip sensor that mounts discreetly above a doorway and handles ordinary ceiling heights. Nano Prime uses 3D stereo vision and suits the tall naves, domes and high galleries common in older worship buildings, and it holds up in the low, warm lighting of an evening service. Nano Outdoor is weather-rated for gates, courtyards and car park approaches. VCare adds a live occupancy display for the lobby so stewards and arriving families can see at a glance whether the hall is full, and BoostBI is the cloud platform where the counts become dashboards, scheduled reports and threshold alerts. If your gate or shoe-deposit area regularly backs up, queue management data can be layered on top of the same sensors.
The general principles are covered on our people counting page.
How worship space teams use the data
- Scheduling services and prayer times. When one service is consistently three-quarters empty and the next is standing room only, the timetable — or the room — is what needs to change.
- Staying inside safe capacity. Live occupancy compared with the posted limit lets stewards hold people at the door, open the annex, or start a second sitting before the building is unsafe, and the same record shows inspectors that limits were respected.
- Planning volunteers and stewards. Greeters, childcare volunteers, car park marshals and security are rostered against the hours that are genuinely busy, per door, instead of against tradition.
- Preparing for the season. Last Ramadan’s or last Easter’s curves are the best available forecast for this year’s: how many extra chairs, how many marshals, when to open the overflow.
- Reporting to boards, trustees, dioceses and councils. An automatic attendance report — by service, by site, by month — replaces estimates in grant applications, denominational returns and budget discussions.
- Facilities and cleaning. Restroom and hall cleaning cycles, heating and cooling schedules and maintenance planning can follow actual use rather than a fixed calendar.
- Parking and traffic. Counting the car park entrance shows when arrival pressure peaks, which is usually earlier and sharper than staff expect.
Privacy: anonymous counting, no faces recorded
This matters more in a place of worship than almost anywhere else, so we will state it plainly. V-Count sensors process images on the device and output numbers — an entry, an exit, a timestamp.
No video is recorded or streamed, no faces are stored, no one is identified, and nothing links a count to a named person, a household or a community. What leaves the sensor is a tally.
Congregations can therefore publish what the system does in a one-paragraph notice at the door, and answer the question every leadership team is eventually asked: are we being filmed? No — you are being counted.
Ready to see it on your own floor plan? Request a demo and we will walk through door-by-door coverage for your building.
Worship space people counting FAQ
How does a church people counter measure attendance at each service?
Sensors above every entrance count people in and out continuously, and BoostBI slices those counts into the service windows you define — 9:00, 11:00, midweek, and so on. Because entries and exits are both counted, the platform reports peak occupancy during the service as well as total attendance, so back-to-back services are not merged into one figure.
Attendance is produced automatically each week, per door and per campus, with no volunteer standing at the entrance and no headcount from the pulpit.
Can one system handle a mosque with separate entrances and separate prayer halls?
Yes. Each doorway is counted independently, so a mosque with separate men’s and women’s entrances and halls gets separate figures for each area and a combined figure for the building.
That matters during Friday prayer and Ramadan, when one hall may reach capacity while the other still has room. Wudu areas, shoe-rack thresholds and any doors opened only for taraweeh or Eid can be counted the same way, which is usually how mosques discover that the real bottleneck is the ablution area, not the main door.
Do these counters record video or identify worshippers?
No. The sensors look straight down from above, process the image on the device, and output only counts — an entry, an exit and a timestamp. No video is recorded or streamed, no faces are stored, and nothing identifies an individual, a family or a community.
The data that reaches BoostBI is a tally, which is what allows congregations to post a short, honest notice at the door explaining that people are counted, not filmed.
How do we compare attendance across multiple campuses, chapels or sites?
Every site reports into the same cloud dashboard, so attendance can be viewed per site, per service and per week without anyone merging spreadsheets. You can rank campuses, chart one against another, and see whether growth at a new site is genuine or simply people moving from an existing one.
Scheduled reports can be emailed automatically, which is generally how multi-site teams brief a board, trustees or a diocese without extra administrative work.
How do we manage safe capacity and egress during festivals and High Holy Days?
Live occupancy is entries minus exits, so at any moment the system knows how many people are inside each counted space. Set your fire-authority capacity as a threshold and BoostBI alerts stewards by email or on a dashboard as the building approaches it; a VCare display in the lobby shows the same figure to arriving attendees.
After the event, the record of how long the building took to clear supports egress planning for Eid, Easter, Yom Kippur or a temple festival.
Do we need power and internet at every door?
Each sensor needs a single Power-over-Ethernet cable, which carries both power and data, so no separate mains socket is required at the doorway. One network connection for the building is enough — the sensors send counts to the cloud, and staff open BoostBI in a browser from anywhere.
Historic and listed buildings are usually the trickiest part of an installation, so we plan cable routes and mounting points with your facilities team before anything is fixed in place.
Can we produce attendance reports for our board, trustees or diocese?
Yes. Reports can be scheduled — weekly, monthly, or for a defined season such as Ramadan or Advent — and delivered automatically by email, broken down by service, room and site.
Because the numbers come from sensors rather than estimates, they hold up in grant applications, denominational returns, insurance reviews and budget discussions. Year-on-year comparisons are built in, so a board can see whether a change in service times or outreach actually moved attendance.