Frequently Asked Questions
Everything you need to know about growing traffic, sales and efficiency with V-Count.
What are the best tools for creating a retail store heat map?
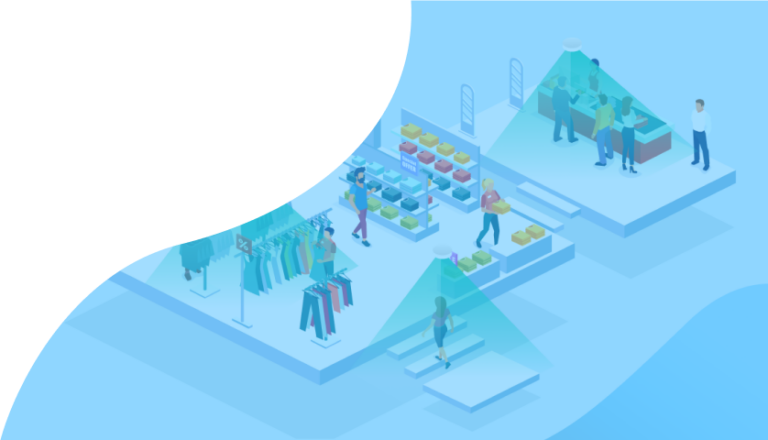
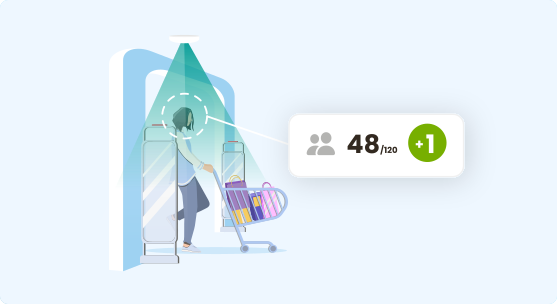
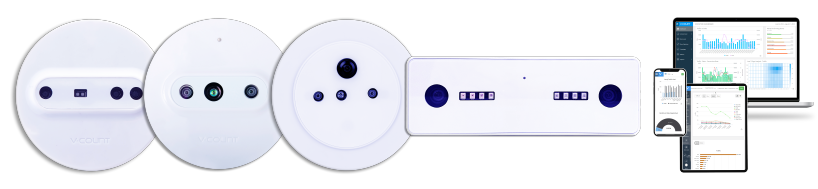
The realistic options fall into three groups. Wi-Fi and mobile-signal tools are cheap to deploy but only see shoppers carrying a detectable device, so zone figures are a sample rather than a count. Software-only tools that re-use existing CCTV are quick to pilot, but accuracy depends entirely on camera angles that were chosen for security, not analytics. Purpose-built overhead sensors with a zone analytics platform give the most reliable dwell and zone counts because the hardware is positioned for measurement. V-Count sits in the third group: Nano AI or Nano Prime sensors feeding heatmap and zone views in BoostBI. When comparing vendors, ask how zones are defined, whether entrance counts and zone counts come from the same data, and whether you can export raw zone data.
What is the difference between a store heat map and a retail heat map?
Nothing substantive — they describe the same thing at different scopes. “Store heat map” usually refers to one location and its floor plan. “Retail heat mapping” is the broader practice, including chain-wide comparison, mall corridors and multi-floor sites. The underlying measurement is identical: anonymous movement and dwell, rendered over a plan. Choose the term your stakeholders use; ask vendors about the method, not the label. V-Count Nano Prime produces both views.
Do heatmaps require cameras that identify individual shoppers?
No. V-Count sensors measure anonymously. They detect that a person-shaped object occupied a zone for a period of time; they do not store faces, do not build identities and do not follow a named individual between visits. The record that reaches BoostBI is a count and a duration attached to a zone and a timestamp. This is what makes heatmap and zone analytics deployable in privacy-regulated markets, and it is worth confirming with any vendor before installation.
How long does it take to collect enough data for a reliable store heat map?
You will see a usable pattern within a few days, but do not act on it yet. Retail traffic is strongly weekly, so a minimum of two to four full weeks gives you weekday and weekend behaviour and smooths out one unusual day. If you are measuring a promotion or a layout change, capture the same length of period before and after so the comparison is like for like. For seasonal categories, compare against the same weeks last year rather than last month. V-Count Nano Prime collects this data continuously.
Can heatmap and zone analytics work in a shopping mall with many tenants?
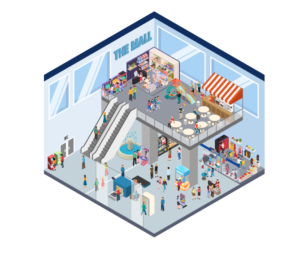
Yes, and malls are one of the strongest use cases. Zones are drawn on corridors, entrances, escalator landings, food courts and individual unit frontages, so you get flow between anchors as well as capture rate per unit. Nano Outdoor covers external entrances and car park approaches. Landlords typically use the data for tenant mix planning, lease negotiation and common-area management, and share unit-level capture rate with tenants as part of the leasing package.
What is dwell time analytics and why does it matter more than footfall?
Dwell time analytics measures how long visitors stay in a defined zone. It matters because footfall alone cannot distinguish between a shopper who stopped and considered a product and one who walked past it on the way to the till. A zone with high visits and very low dwell is a corridor, not a destination — and merchandising it like a destination wastes stock and space. Dwell paired with zone counts is what lets you calculate capture rate and, with POS data, conversion by zone. V-Count Nano Prime measures dwell time per zone.
How many zones should a store define?
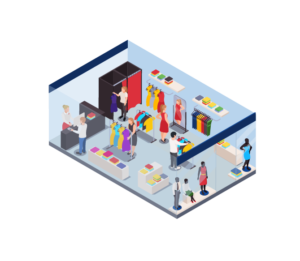
Fewer than most people expect at first. Start with the areas you can actually act on: entrance and window, each major category, fitting rooms or service desk, and the checkout queue. For a typical specialty store that is five to ten zones. Too many small zones produce noisy numbers and reports nobody reads. Zones are software-defined in BoostBI, so you can split a zone later once you know a category deserves finer detail, or add a temporary zone around a seasonal promotion and remove it afterwards.