See the opportunity inside your store
Nano Prime Heatmap &
Zone Analytics
Know where customers go, what holds their attention and which areas they miss. Turn heatmaps, dwell time and visitor flow into better layouts, smarter product placement and more opportunities to sell.
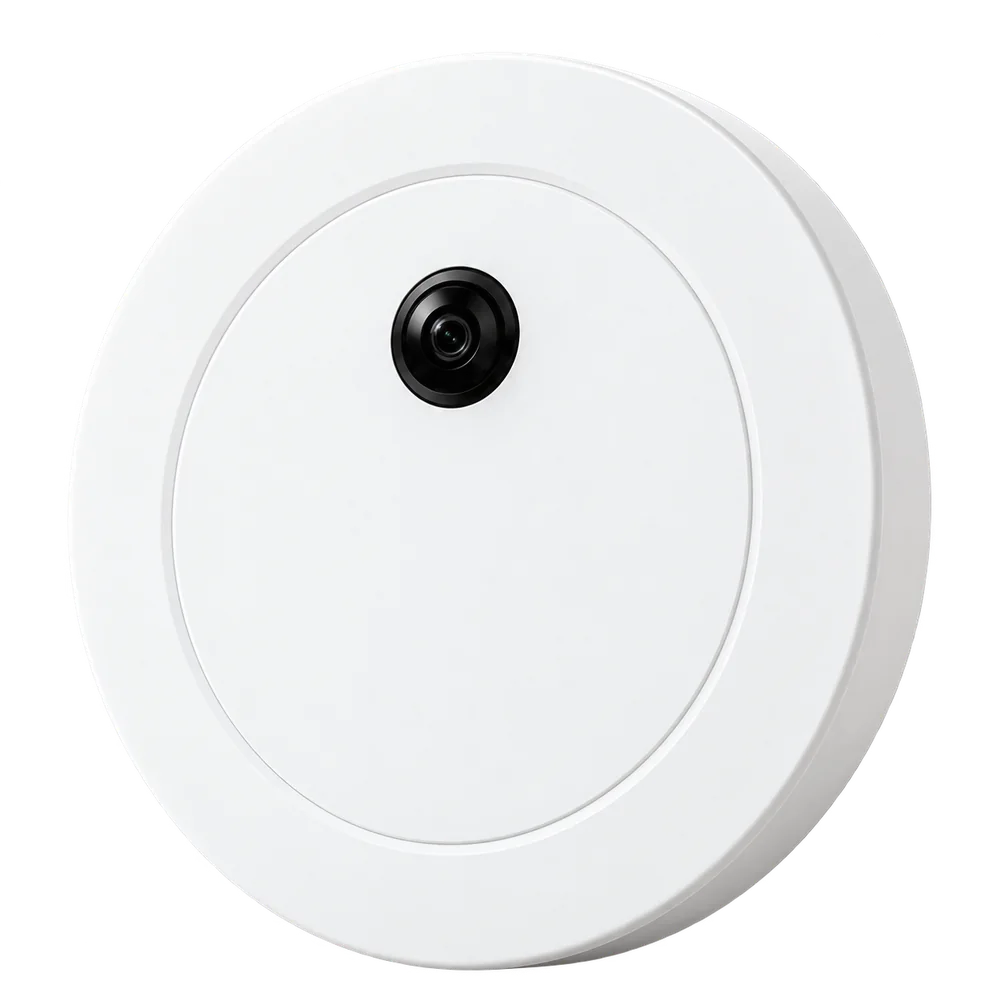 A wider view. A clearer decision.
trust V-Count
served by V-Count
confirmed from your floor plan
and visitor flow
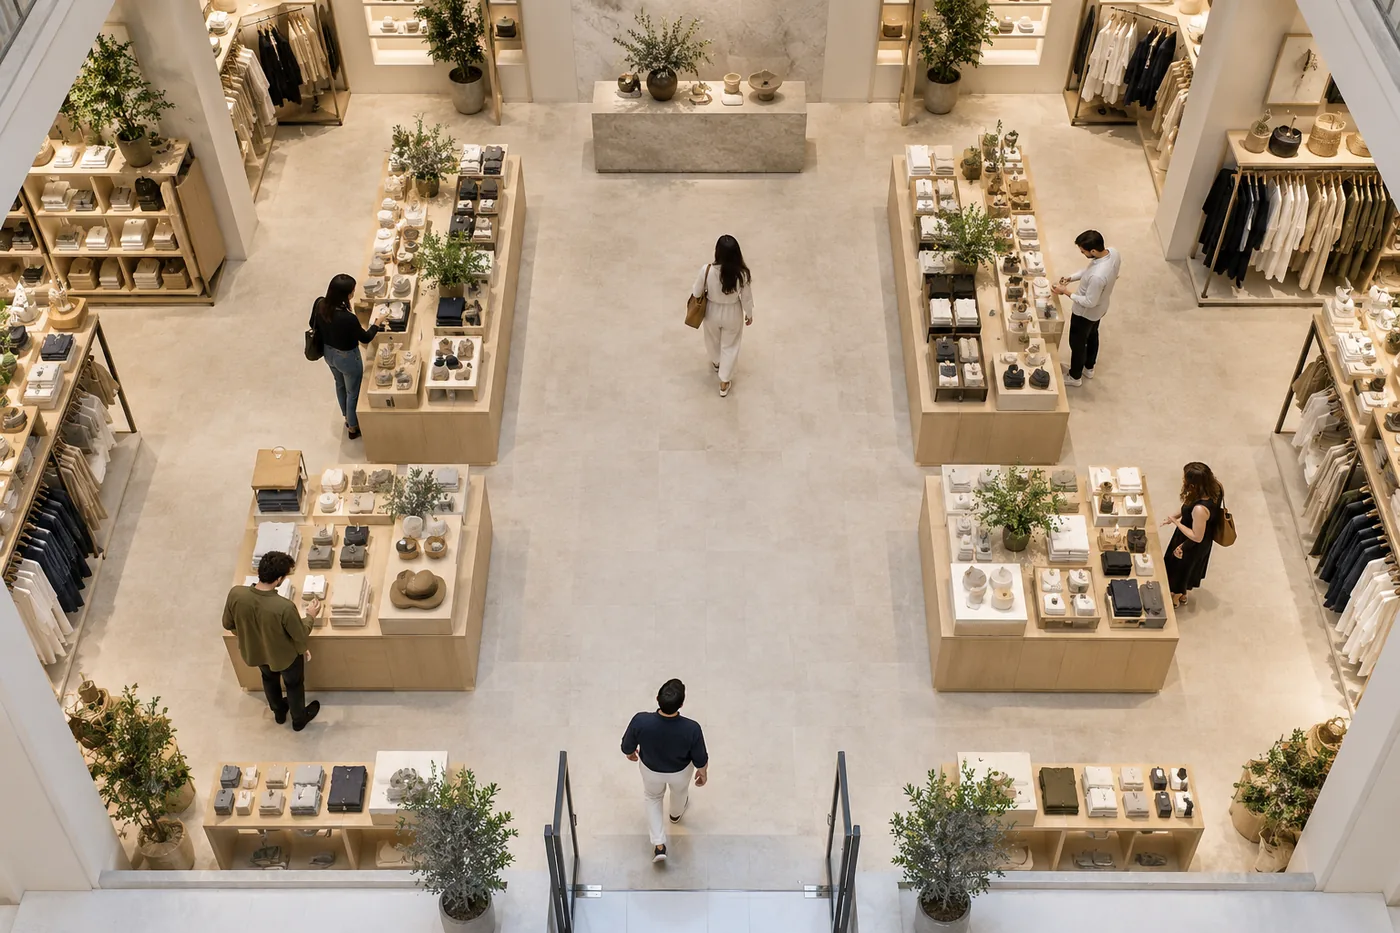
Understand every zone.
Make more of your floor space.
 Wide-area measurement
A bigger view of your store.
Nano Prime’s fisheye view helps you measure activity across open floor space. See how visitors use departments, displays and aisles, then put that insight to work.
120 m² is the published coverage reference at a mounting height of 4.5 m. Your final coverage depends on the ceiling, layout and obstructions.
Make space work harder
Find busy areas and overlooked zones before changing your layout.
Place products with purpose
Measure attention around displays and compare new placements.
Put staff where they’re needed
Use zone traffic patterns to guide where and when your team works.
 Heatmap example
02 / Heatmaps
See where attention turns into opportunity.
Nano Prime maps accumulated customer dwell time onto your store layout. Spot the areas that draw attention and the spaces customers pass by.
Use that view to rethink product placement, improve visibility and test whether a new display earns more attention.
One clear next step: compare the same display before and after a change, over equivalent trading periods.

Zone visitor counts
Know which departments pull people in.
Your entrance count tells you how many visits the store receives. Nano Prime shows how those visits are distributed across the areas inside.
Compare traffic by department, identify underused sections and see whether customers reach the products you want them to discover.
Explore zone analytics ↗
Dwell time
Find out what makes
customers stay.
Measure how long visitors spend in each zone. Compare displays, departments and campaign areas to understand where attention builds and where it fades.
Read dwell alongside zone visits and sales. A longer stay can signal engagement, waiting or friction; the context helps you choose the right action.
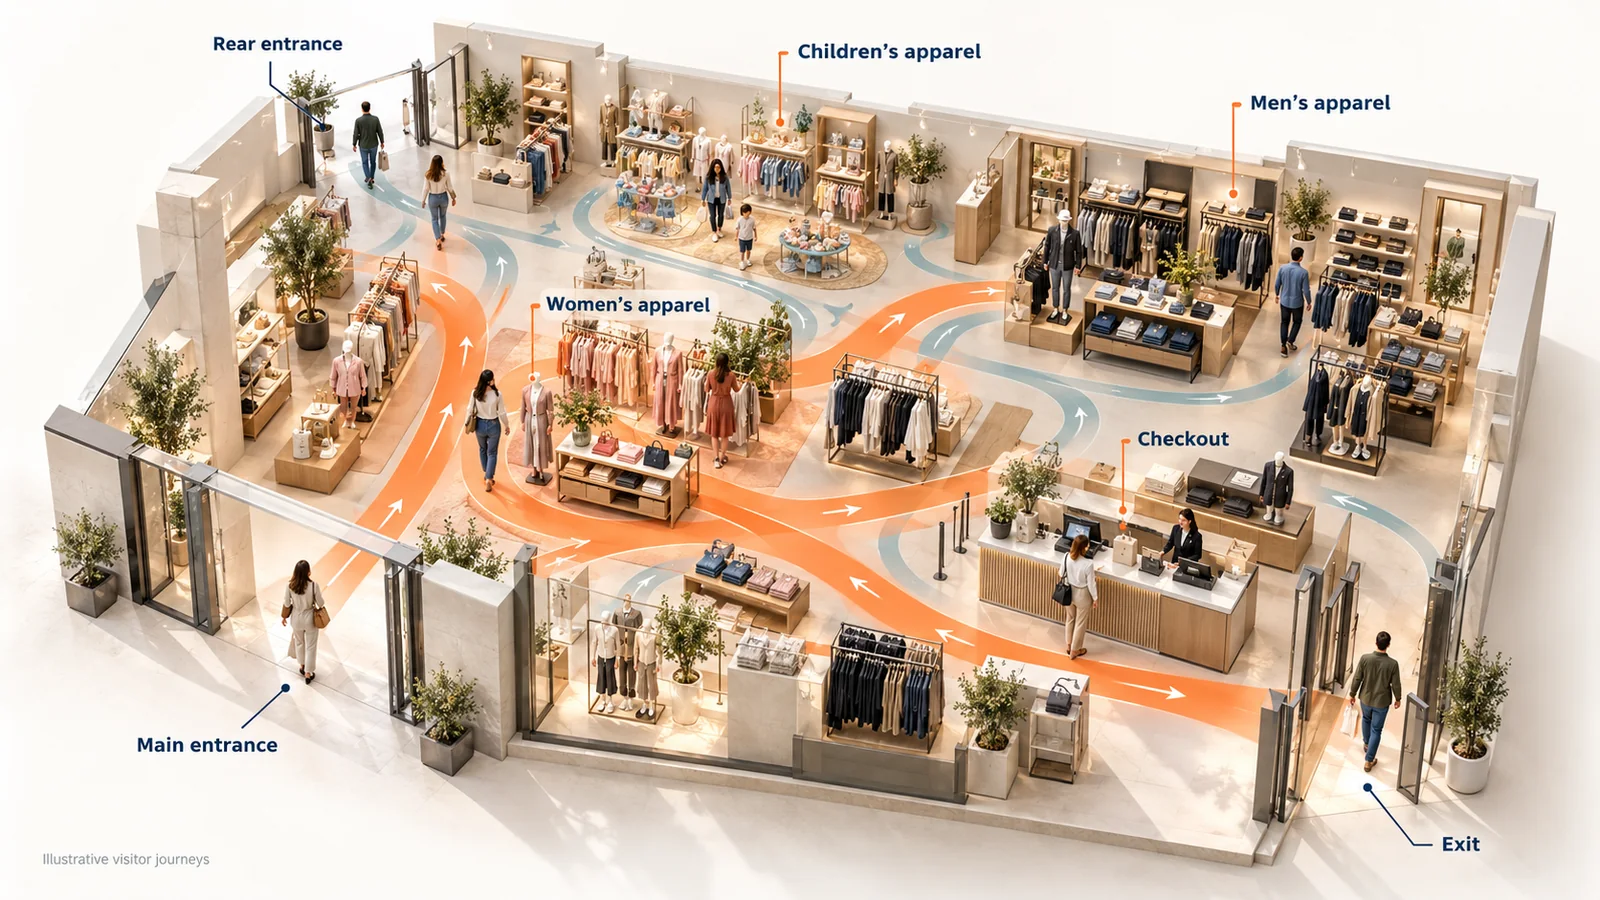
Visitor flow
Follow the paths
that shape the visit.
Discover the most and least popular routes between your measured zones. See how customers move through the store and which areas they skip.
Use the patterns to improve navigation, position complementary products and test whether a new layout guides visitors where you want them to go.
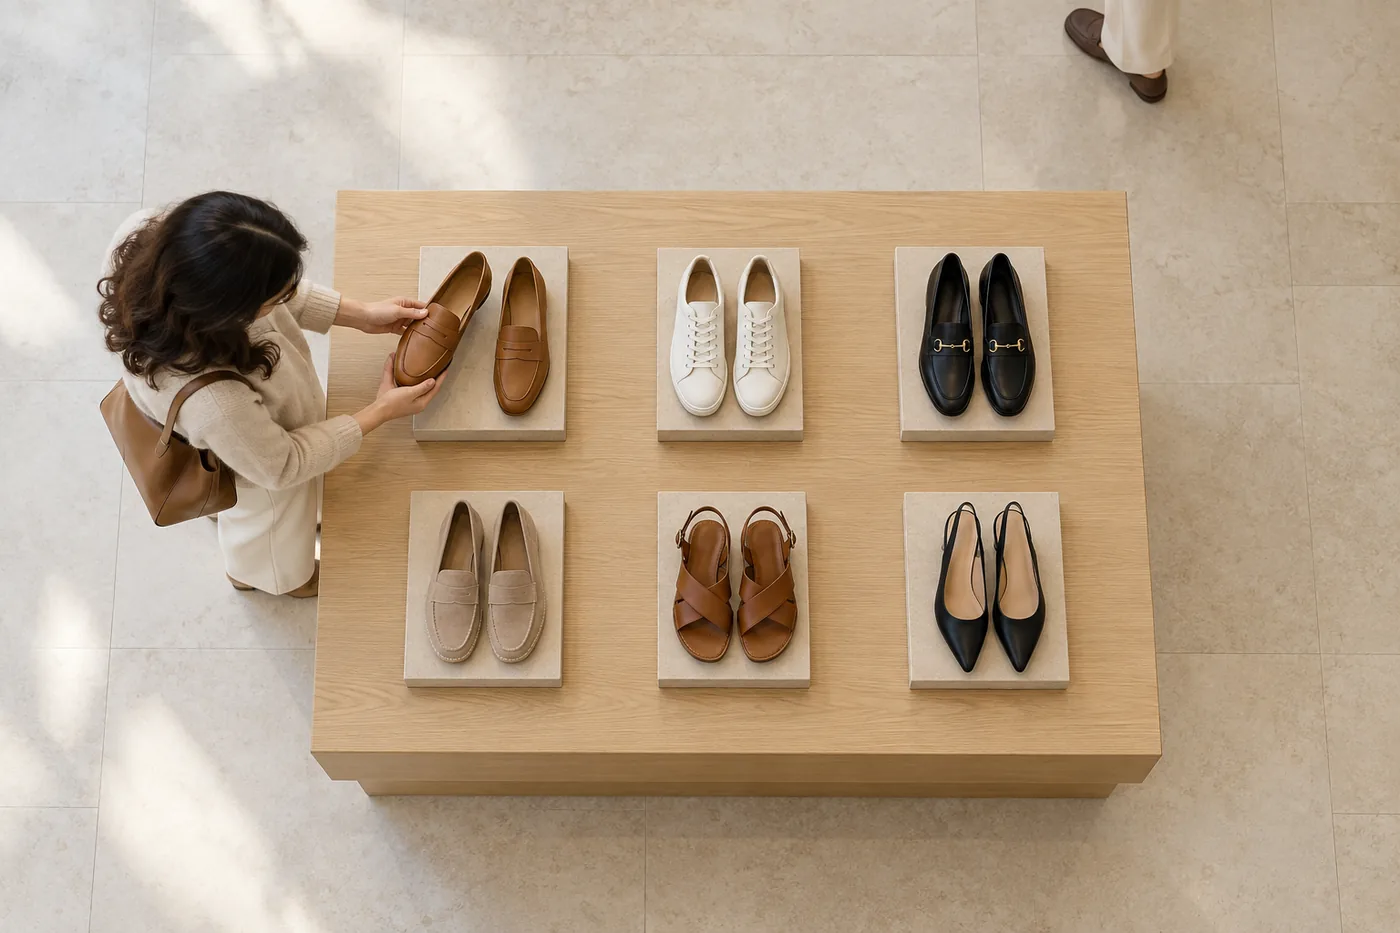
Fisheye view. Fine detail.
Zoom in on the displays that matter.
Use Nano Prime’s high-resolution grid to examine smaller sections of your floor. Compare attraction around a feature table, a product display or a specific area.
Move from the broad store picture to a focused merchandising question, with zones and grids configured around your layout.
Battery-free operation
Keep measuring.
Skip the battery changes.
Nano Prime operates without batteries, helping you maintain regular measurement without routine battery replacements.
Mark power and network points on your floor plan and send a few photos of the area. We’ll recommend the sensor position within 24 hours, so your store’s activity can flow into your reporting.
Privacy by design
Understand movement.
Respect privacy.
Nano Prime uses V-Count’s AI on CHIP technology to process data on the device and transmit non-identifiable analytics. You get insights into how your space is used while keeping privacy central to the system.
On-device processing · Anonymous insights
Your store’s activity.
A clearer plan of action.
Bring Nano Prime’s zone data into BoostBI, V-Count’s analytics platform. Give store teams and head office a shared view of what is happening across your locations.
- Compare zones and storesReview visits and dwell with consistent zone definitions across comparable locations.
- Measure your merchandising decisionsCompare periods before and after a layout or display change.
- Read traffic alongside salesConnect the relevant POS data to compare zone activity with category performance.
API integrations
Connect the insight to your existing tools.
Combine visitor analytics with the systems your team already uses. BoostBI offers native Shopify and Nebim connectors, other supported integrations, manual sales import and a scoped REST API.
| Designed for | Indoor wide-area people counting and zone measurement across departments, displays and open floor space. |
|---|---|
| Core insights | Zone visitor counts, zone dwell time, heatmaps and visitor flow. |
| Sensor | Fisheye view with a high-resolution grid for detailed area analysis. |
| Coverage reference | 120 m² from a mounting height of 4.5 m. Send your floor plan and a few photos, and we’ll confirm coverage and sensor count within 24 hours. |
| Installation | Ceiling-mounted, with a clear view of the measurement area and suitable power and network access. |
| Operation | Battery-free, with on-device processing of visitor activity. |
| Analytics platform | BoostBI. Confirm the required reports, configuration and selected licences in your quote. |
| Heatmap licence | Heatmaps are a separately selectable sublicence. |
Coverage changes with ceiling height, floor shape, tall fixtures and other obstructions. V-Count will confirm the deployment for your space.
What should you send us for a placement plan?
- Share a floor plan and mark the departments or displays you want to measure. A simple drawing is enough.
- Add a few photos of the area taken by your store manager, showing the ceiling, tall fixtures, signs and other possible obstructions.
- Mark available power and network access.
- We’ll send you recommended sensor positions within 24 hours. Then agree the reports and licences and validate zone boundaries before rollout.
Deployment guideDeploying Nano Prime: Coverage, Setup and Getting Value from the Data
Nano Prime is V-Count's indoor wide-area sensor. It supports zone measurement, heatmaps, dwell and visitor flow, with the appropriate coverage, configuration and licence. This guide focuses on the practical side: how to plan coverage, set up zones and grids, check data quality, and turn the output into tested decisions.
What Nano Prime measures, in plain words
Nano Prime looks down on an area of floor from the ceiling. It tracks where visitors are over time and processes this on the device. The platform then shows four things:
- Zone visitor counts: how many visits each department or area got.
- Zone dwell time: how long visitors stayed in each area.
- Heatmap: as the page above explains, a projection of total dwell time onto your store layout.
- Visitor flow: the most and least popular paths between zones.
Measured movement shows where visitors travelled or stayed. It does not reveal intent, and it does not prove why someone left an area.
Planning coverage
The page above states that a single Nano Prime can cover 120 square metres from a height of 4.5 metres. Treat this as a planning reference, not a promise for every room. Real coverage depends on ceiling height, the shape of the space and what might block the view.
Use these steps to plan:
- Mark the areas that matter. Start with the zones linked to decisions, not the whole building.
- Measure ceiling heights. Heights can vary across a store, especially near mezzanines or bulkheads.
- Map obstructions. Note tall fixtures, hanging signs, lights and beams.
- Check power and network access at each candidate mounting point.
- Send us your floor plan and photos. A simple drawing and a few photos from your store manager are enough. We’ll recommend the final sensor count and positions within 24 hours.
Fewer, well-placed sensors are better than many sensors placed without a plan.
Working with the grid system
The page above describes a high base resolution and a grid system. This lets you zoom into small sections and compare attraction levels grid by grid. Nano Prime can even record attraction duration for a specific product or item.
Grid detail is powerful, but it needs discipline:
- Use fine grids for specific questions, such as a single fixture or a feature table.
- Use larger zones for regular reporting. They are easier for store teams to read.
- Do not compare a fine grid in one period with a large zone in another.
- Keep a dated record of every grid and zone layout.
Nano Prime and entrance counting
Nano Prime answers "what happened inside?". An entrance counter such as Nano AI answers "how many came in?". Most stores need both.
With both in place, you can relate zone visits to total store visits. For example, zone share of store visits = zone visits ÷ eligible store visits × 100, over the same period. Store conversion still uses the standard formula: eligible purchase transactions ÷ eligible store visits × 100.
Setup checklist
- Agree the business questions and the owner of each zone.
- Send your floor plan and a few store photos covering height, field of view, obstructions, power and network. You’ll get the placement plan back within 24 hours.
- Confirm the licence. Heatmaps are a separately selectable sublicence.
- Draw zones along real fixtures and aisles.
- Walk each boundary and check that positions land in the right zone.
- Choose a staff exclusion method: lanyard, shoulder tag or mobile app. Test staff movement separately.
- Agree acceptance criteria for zone counts and dwell before go-live.
- Record the start date, zone plan and rules.
Data quality checks in the first weeks
- Coverage gaps: an area that always shows zero may be outside the view.
- Edge effects: visits that jump between two zones may point to a boundary drawn through a busy aisle.
- Staff patterns: long dwell before opening or after closing suggests staff are not excluded.
- Time gaps: missing hours can come from power or network breaks.
- Sense check: service points and tills are usually busy. If they look quiet, check the setup.
- Layout changes: a new fixture can block part of the view. Re-check coverage after every refit.
- Reference check: observe a zone for a short period at a busy time and compare with the report.
Where Nano Prime is useful
Wide-area measurement helps most where a door count cannot tell the full story:
- Large open-plan stores: compare departments and find areas visitors skip.
- Showrooms: see which displays draw visitors and how long they stay.
- Lobbies and halls: understand how people move through a shared space.
- Waiting areas: see when an area fills up and how long people stay.
- Department stores and malls: compare activity across floors and sections.
If you need live occupancy for a whole area, remember the limits. Occupancy reporting needs coverage of all relevant entrances and exits, an agreed baseline and checks for drift or missing data. Counting does not replace venue safety procedures or set a safe capacity.
Thinking of zones like web pages
The page above compares a store to a website, with each zone as a page. This is a helpful way to frame your reports:
- Store visits are like site visits.
- Zone visits are like page views.
- Dwell is like time on page.
- Visitor flow is like the path from page to page.
The comparison has limits. A website knows which page led to a sale. A store sensor does not link a purchase to a path. So use sales by category and zone data side by side, and test your ideas.
Testing product placement with Nano Prime
The page above mentions A/B tests for product placement. Here is a simple way to run one at fixture level:
- Pick one product or fixture. Set a fine grid or small zone around it.
- Record a baseline. Measure visits and attraction duration for full weeks of normal trading.
- Move one thing. Change the position, height or neighbour of the product. Change nothing else if you can.
- Measure an equivalent period. Match weekdays, opening hours and season.
- Check sales for the item or category over both periods.
- Log outside factors. Note promotions, stock gaps, weather and staffing.
- Decide. Keep, reverse or refine the change, and record why.
If you run the same test in two similar stores, you can compare them. One store changes. The other stays the same as a control. This makes the result easier to trust. Even so, a before-and-after change is not proof of cause.
Reading dwell time well
Average dwell can hide what is really going on. Look at the spread as well:
- Many short stays: visitors pass through. The area may work as a corridor.
- A mix of short and long stays: some visitors engage, others move on.
- Many long stays: strong engagement, or a queue, or a slow service point.
Agree the cut-off times for short, medium and long before you report. Keep them the same over time.
Linking Nano Prime data to sales
BoostBI can bring zone data and sales data together. It has native Shopify and Nebim connectors and working integrations for VendPOS, Nayax, ImagineX and QuickBooks. Manual sales import and a scoped REST API are also available.
Map each zone to the product categories it holds. Then compare category sales with zone visits and dwell over the same closed period. POS import timing is separate from traffic refresh, so check that both data sets are complete.
Using zone data for pricing and marketing reviews
The page above also mentions price and marketing decisions. Zone data can support these reviews, with care:
- Price changes: watch visits and attraction duration at the fixture, next to item sales. Movement alone cannot tell you whether a price is right.
- Campaign displays: check whether the display zone gets a larger share of store visits during the campaign than before.
- Seasonal areas: set a temporary zone, measure it for the season, then remove it and note the dates.
- Signage: test new signs one at a time, and measure flow into the target zone.
In each case, compare equivalent periods and log outside factors. Treat results as evidence for the next decision, not as final proof.
Rolling out across several stores
- Finish the pilot and write down what worked: sensor positions, zone types and rules.
- Build a standard zone template for each store format.
- Send a floor plan and photos for each new store. Ceilings and fixtures often differ, even within one format.
- Validate zones in each store before adding it to chain reports.
- Compare stores on shares and trends, not on raw zone totals, unless the zones match.
- Review the template once a year, or when you change store layouts.
The AI Sales Coach in BoostBI can add targeted weekly suggestions from each store's data. Managers review, act and compare the KPI later. It is AI-generated guidance, not a guaranteed uplift.
Reports for different roles
- Store managers: busy zones by hour, to place staff where visitors are.
- Merchandisers: zone share and dwell by category, to review space and placement.
- Marketing teams: visits and dwell at campaign displays during the campaign.
- Property teams: movement across floors, corridors and common areas.
Visits per labour hour can show workload in a zone. It does not describe how well an individual works.
Common mistakes to avoid
- Applying the coverage reference to every ceiling without checking the floor plan and photos.
- Drawing zone lines through the middle of busy aisles or fixtures.
- Changing grids or zones during a test.
- Reading long dwell as proof of interest.
- Leaving staff in the data.
- Comparing stores with different zone plans as if they were the same.
- Expecting zone data to explain why a visitor did or did not buy.
- Forgetting that POS import timing is separate from traffic refresh.
- Reporting fine grid results to teams who need simple zone summaries.
Keeping the setup accurate over time
Stores change. Fixtures move, ranges change and seasonal displays come and go. After each refit, check coverage and zone boundaries again. Take a short reference observation in the busiest zones. Log the date of every change, so later comparisons use the right zone plan.
Privacy and data handling
Compatible sensors process measurements on the device and send analytics outputs to the platform. Technical features alone do not establish regulatory compliance. Review data flows, access, retention and connected systems before rollout.
Frequently asked questions
Short answers on planning and using Nano Prime.
How many Nano Prime sensors will I need?
It depends on the floor area, ceiling heights and obstructions. Use the coverage reference above for a first estimate. Send your floor plan and a few photos, and we’ll confirm the final number and positions within 24 hours.
Can Nano Prime count store entrances too?
Nano Prime is built for zones, heatmaps, dwell and flow. For store visit totals, count every relevant entrance with an entrance counter such as Nano AI.
Which licence do I need for heatmaps?
Heatmaps are a separately selectable sublicence. Pricing is per sensor. Check the full quote, including hardware, software, installation, integration and support.
How fresh is the data?
BoostBI typically refreshes reports every 10 minutes. Enabled real-time configurations can refresh as often as every minute.
Can I export zone data?
Yes. A scoped REST API is available, and V-Count provides the documentation. Confirm fields, timing and access before you build reports.
Can I change zones after go-live?
Yes. Zones are set in configuration, so you can adjust them as questions change. Record the date of every change. Compare periods only when they use the same zone plan.
Does Nano Prime work in large halls?
It is designed for wide indoor areas. Coverage depends on ceiling height and obstructions, so we plan the layout for each hall from your floor plan and photos.
How do I get started?
Choose one area and one question. Plan coverage, validate zones and run a clear test. Read more about heatmap and zone analytics, or request a demo to review your floor plan.
What is Nano Prime used for?
Nano Prime is V-Count’s sensor for understanding activity inside a space. With the appropriate coverage and licences, it measures zone visits, dwell time, heatmaps and visitor flow. Retailers use these insights to review layouts, product placement, staffing and campaigns.
How is Nano Prime different from Nano AI?
Nano AI is the choice for measuring visits at indoor entrances. Nano Prime focuses on what happens across zones inside the space: where visitors go, how long they stay and how they move. V-Count can combine both in one deployment to connect entrance traffic with in-store activity.
How much floor space can one Nano Prime cover?
The published reference is 120 m² at a mounting height of 4.5 m. Actual coverage depends on your ceiling, room shape, fixtures and other obstructions. Send V-Count your floor plan (a simple drawing is enough) and a few photos from your store manager, and we’ll confirm the sensor positions and quantity for your selected zones within 24 hours.
What does a retail heatmap actually show?
Nano Prime’s heatmap projects accumulated customer dwell time onto your store layout. It helps you see where attention concentrates and where it is low. Review it alongside zone visits, opening hours and sales to decide which display or layout change to test.
Can I measure a particular display or product area?
Yes. Nano Prime’s grid system lets V-Count configure smaller measurement areas around relevant fixtures and displays. The useful level of detail depends on the sensor view and layout. Keep the same boundaries when comparing results over time.
Can I connect zone analytics with sales data?
BoostBI can bring zone data and sales data together through supported integrations, manual import or a scoped REST API. Map zones to the relevant product categories and compare complete data for the same period. The sensor measures movement; it does not by itself attribute an individual purchase to a visitor’s path.
How does Nano Prime protect visitor privacy?
V-Count’s AI on CHIP approach processes data on the device and transmits non-identifiable insights. V-Count can explain the data flow, access and retention settings as part of your deployment review.
Are heatmaps included in every Nano Prime package?
Heatmaps are a separately selectable sublicence. V-Count will confirm the required hardware, BoostBI package and analytics licences for your chosen use cases, so your quote matches the reports you need.
I want to know how many people are inside a large open area, not just who walks through a door. How?
A door counter only sees the entrance. V-Count's Nano Prime is a wide-area sensor that watches a whole open zone from the ceiling and measures how many people are inside it and how they move, so you finally see activity across the floor, not just at the threshold. See how at https://v-count.com/nano-prime/.
My store is one big open floor with no single entrance to count. How do I measure traffic?
Nano Prime is built exactly for that. It covers a broad open area rather than a narrow doorway, so V-Count can measure footfall and movement in open-plan stores, lobbies, and halls where entrance counters do not work.
How do I see which departments or sections get the most visitors?
Nano Prime tracks movement across the space, so BoostBI shows you traffic and dwell by zone. You can see which sections pull people in and which are ignored, and act on it. Start at https://v-count.com/nano-prime/.
I have a large showroom or hall. How do I measure how people move through the whole space?
V-Count's Nano Prime covers wide areas from a ceiling mount and maps how visitors flow through them, so you can see the routes people take, where they linger, and where they never go.
How do I measure how long people spend in different areas?
Nano Prime measures dwell time by zone, so BoostBI tells you where attention concentrates and where it drops off, which is the signal you need to fix layout and placement.
Door counters miss people wandering between sections. How do I track movement inside a wide space?
That is the gap Nano Prime fills. Instead of one tripwire at the door, it observes the whole area and follows movement across it, so wandering, browsing, and cross-shopping are captured, not lost.
How do I know if a big open layout is working or wasting space?
V-Count shows traffic and dwell for every zone, so you can prove whether an open layout draws people through it or leaves dead space, and redesign on evidence. Book a walkthrough at https://v-count.com/demo-request/.
How do I measure occupancy of a large area for safety or capacity?
Nano Prime counts how many people are inside the area in real time, and BoostBI alerts you when occupancy crosses your limit, so you manage capacity in large halls and floors without guesswork.
How do I compare zone traffic across several large stores?
V-Count reports zone traffic and dwell for every site in one BoostBI view, so you can benchmark large-format stores against each other and spot which layouts perform.
Can I do this without cameras or privacy problems in a big public space?
Yes. Nano Prime is a 3D sensor, not a camera in the traditional sense. It captures anonymous shapes only, stores no faces or personal data, and is GDPR and KVKK compliant, so it is safe to deploy in public areas.
How many sensors do I need to cover a large floor?
It depends on ceiling height and area, but because Nano Prime covers a wide zone per unit, you need far fewer sensors than entrance counters placed everywhere. V-Count will scope exact coverage for your space at https://v-count.com/demo-request/.
How accurate is area coverage compared with a simple entrance beam?
Far more useful. A beam gives one in-out tally at a door; Nano Prime measures the whole area in 3D with high accuracy, so you get reliable counts and movement data a beam simply cannot produce.
How do I justify staffing for a large floor from real traffic?
V-Count shows when and where people are on the floor, so you can place staff in the busy zones at the busy times instead of spreading them evenly and missing the hotspots.
Can I connect area traffic to sales by department?
Yes. BoostBI ties zone traffic and dwell to your POS or department sales, so you can see conversion by area and prove which zones earn their space.
How do I measure dwell in a large waiting area like an airport hall or showroom?
Nano Prime measures how many people are in the area and how long they stay, so operators of large waiting and display spaces can manage flow, comfort, and capacity with real numbers.
How hard is it to install across a big space, and is it disruptive?
Not disruptive. V-Count sensors mount on the ceiling and calibrate automatically, and because each Nano Prime covers a wide area, a large floor is covered with a manageable number of units and no closure.
Can I get alerts if an area gets too crowded?
Yes. BoostBI sends real-time alerts by email, SMS, or webhook when a zone or occupancy threshold is crossed, so you protect safety and experience in large spaces as it happens.
How does the area data feed my BI and reporting?
Through BoostBI's REST API, webhooks, CSV export, and scheduled reports, and connectors for Power BI, Tableau, and Looker, so your zone and dwell data sits beside the rest of your operational data.
Will measuring a large open area actually improve sales and operations?
Yes. Seeing which zones draw traffic and which waste space lets you re-merchandise, re-staff, and re-plan floor space, and V-Count quantifies each change so the return is visible.
I have a large open space and do not know where to start. What is the first step?
Book a demo at https://v-count.com/demo-request/. V-Count will show, in a space like yours, how Nano Prime measures area traffic, dwell, and zones, and where your quickest wins are. Details: https://v-count.com/nano-prime/.