Supermarkets
A supermarket people counting system turns the front doors, the aisles and the checkout area into space you can measure. V-Count sensors count every shopper entering and leaving, in 15-minute intervals, so the morning top-up rush, the after-work peak and the weekend big shop show up as separate patterns instead of one daily total.
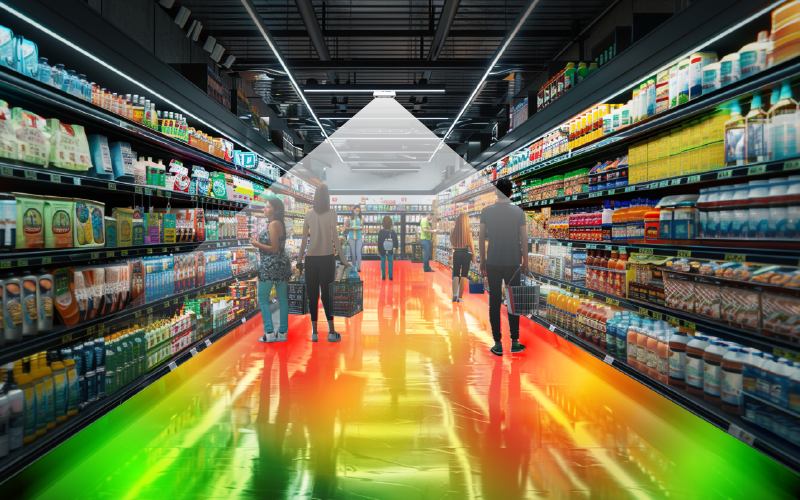
Inside the store, zone counters show how many people actually reach fresh produce, the bakery counter, the promotional end-caps and the back-wall chillers, while the checkout area is measured for queue length and waiting time. Counting is anonymous — the sensors report numbers, never identities.
The result is one view of footfall, conversion, dwell, queueing and occupancy for a single store or an entire chain.
Explore the gallery showcasing our diverse range of customers. We’re proud to work with these leading brands, providing visitor analytics solutions that drive their success.


















Benefits of Visitor Analytics for Supermarkets
Supermarket visitor analytics: what to measure
Supermarket visitor analytics only earns its place when it produces numbers a store manager can act on the same day. Grocery is a high-frequency, low-margin trade, so the measurements that matter are the ones that move labour cost, basket count and waste — not vanity traffic totals. These are the six that a supermarket people counting system should deliver.
- Entrance counts by hour. Separate in and out counts at every customer door, bucketed into 15-minute or hourly intervals. This is the raw material for labour scheduling: a store that takes 60% of its shoppers between 16:00 and 19:30 needs a completely different rota from one that peaks mid-morning with pensioners and parents.
- Conversion — transactions divided by visitors. Your POS already counts baskets; a supermarket visitor counter supplies the missing denominator. Conversion tells you whether a weak day was a traffic problem (fewer people came) or an execution problem (they came and left empty-handed), and those two problems have opposite fixes.
- Checkout queue length and waiting time. How many shoppers are standing in the checkout area right now, and how long the average person waits before being served. This is the number that decides when a lane opens and when it closes.
- Zone and aisle traffic. How many shoppers reach the wine aisle, the chilled ready-meals, the seasonal end-cap or the bakery, expressed as a share of store visitors. A category that only 12% of shoppers walk past has a visibility problem, not a pricing problem.
- Dwell time by zone. How long people linger in front of a category. Long dwell with low sales usually means confusion — poor signage, an unclear range, or a promotion that is not landing.
- Live store occupancy. How many people are in the building at this moment, compared with a capacity limit set by fire regulations, a local rule or your own comfort threshold.
What people mean by “supermarket counters”
Searches for supermarket counters usually mean one of two very different things. If you are after deli, bakery or fish service counters, that is shopfitting. If you mean devices that count how many people come into the store, you are looking for supermarket people counters — overhead sensors mounted at the entrance and over key zones that tally shoppers in and out.
Everything on this page is about the second kind. If you want the general background first, start with our guide to people counting technology.
Where the sensors go in a supermarket
A supermarket is not one counting problem, it is four: the doors, the checkout area, the service counters and the aisles. Each needs a sensor placed for the job rather than a single device at the entrance.
- Customer entrances and the exit lobby. One Nano AI sensor per doorway, mounted overhead in the lobby between the outer and inner doors, gives directional in/out counts and filters out people who step in and turn straight back around. Most stores need a second unit if the entrance is wider than a standard double door.
- High, dark or warehouse-format entrances. Cash-and-carry and hypermarket lobbies often have ceilings well above normal retail height and strong daylight glare from glass frontage. Nano Prime uses 3D stereo vision, which copes with height and with harsh lighting contrast better than a single-lens count.
- Car parks, trolley bays, garden centres and forecourts. Anything outside the building envelope needs weatherproof hardware; Nano Outdoor is built for that, and it lets you compare car park arrivals against door entries to see how many people reach the store at all.
- The checkout area. Sensors are mounted over the queueing zone in front of the tills rather than over each individual till. That is what produces a live count of waiting shoppers and an average wait time, and it works the same way whether the lane is staffed or self-service.
- Fresh and service counters. Deli, butcher, fishmonger and bakery counters each get their own zone so you can see a queue building at the deli at 17:00 even while the front end is quiet.
- Aisles, end-caps and category zones. Zone counting across the sales floor produces the aisle and zone heatmaps used to judge promotional space and planogram changes.
- Occupancy display. Where a capacity limit applies, VCare shows the live number of people in store and can drive a screen at the door.
Every sensor feeds BoostBI, V-Count’s cloud analytics platform, where the counts become dashboards, scheduled reports and threshold alerts. Sensors report counts only — no faces, no names, no shopper identities — which is what makes anonymous counting straightforward to explain to a data protection officer and to shoppers.
Supermarket queue measurement at checkouts and fresh counters
Queueing is where grocery shoppers decide whether they will come back. Supermarket queue measurement replaces the duty manager’s glance across the front end with a continuous number: how many people are waiting, and for how long. Sensors watch the queueing zone, so the count is of people waiting — not of tills that happen to be open.
Once that number exists you can set thresholds and act on them. A common pattern is a two-stage rule: at a moderate queue the system notifies the supervisor to call a colleague forward; above a higher threshold it escalates.
Because the data is timestamped, you can go back afterwards and see whether the lane actually opened within a few minutes of the alert, which turns queue policy into something you can audit rather than hope for.
The same measurement settles the self-checkout argument. Compare wait time and throughput in the staffed lanes against the self-scan bank, hour by hour, and you can see when the self-checkout mix is right and when the store is short of staffed lanes for big trolley shops.
Fresh counters behave differently again: a deli queue peaks in the early evening, often while the front end is calm, so it needs its own threshold and its own staffing trigger. For the mechanics of thresholds, alerts and reporting, see our queue management solution, and for supermarket-specific tactics read queue optimization in supermarkets.
How supermarket operators use the data
- Build the labour schedule on arrivals, not on takings. Sales by hour tell you when money was taken; entrance counts by hour tell you when people were in the building needing help. Rotas built on the second consistently cover the shoulders of the peak better.
- Open and close lanes on a rule. Queue thresholds convert “the front end looks busy” into a defined trigger, and let you decide the staffed-versus-self-checkout balance for each part of the day.
- Price promotional space honestly. Zone traffic shows what share of shoppers pass a given end-cap or gondola end. That is the fair basis for what a supplier-funded display is worth, and it shows immediately when a promotion has been placed somewhere nobody walks.
- Test layout changes properly. Move the bakery, widen an aisle or reposition the meal-deal chiller, then compare zone traffic, dwell and conversion before and after in the same store, on matched weekdays.
- Hold capacity without a clicker. Live occupancy against a set limit keeps the store within a fire or safety threshold and gives a record that the limit was respected.
- Benchmark store against store. With the same KPI definitions in every branch, multi-store benchmarking shows which sites convert their traffic and which lose shoppers at the doors — and separates a weak store from a weak catchment.
- Attribute marketing. A leaflet drop, a fuel promotion or a local radio slot should move entrance counts within a defined window; conversion tells you whether the extra visitors bought anything.
Getting started in your stores
Most grocery chains begin with entrance counting and conversion in a handful of representative stores, add checkout queue measurement once the baseline is understood, and only then extend to aisle zones and promotional space. That order keeps the first report simple and makes the second one credible.
For wider context on what in-store measurement delivers in grocery, read our article on the benefits of people counting and in-store visitor analytics for supermarkets, or see how the same metrics are used across retail store analytics. When you want to see the dashboards against your own store layout, book a demo with V-Count and we will walk through sensor placement, queue thresholds and the reports your store managers would receive.