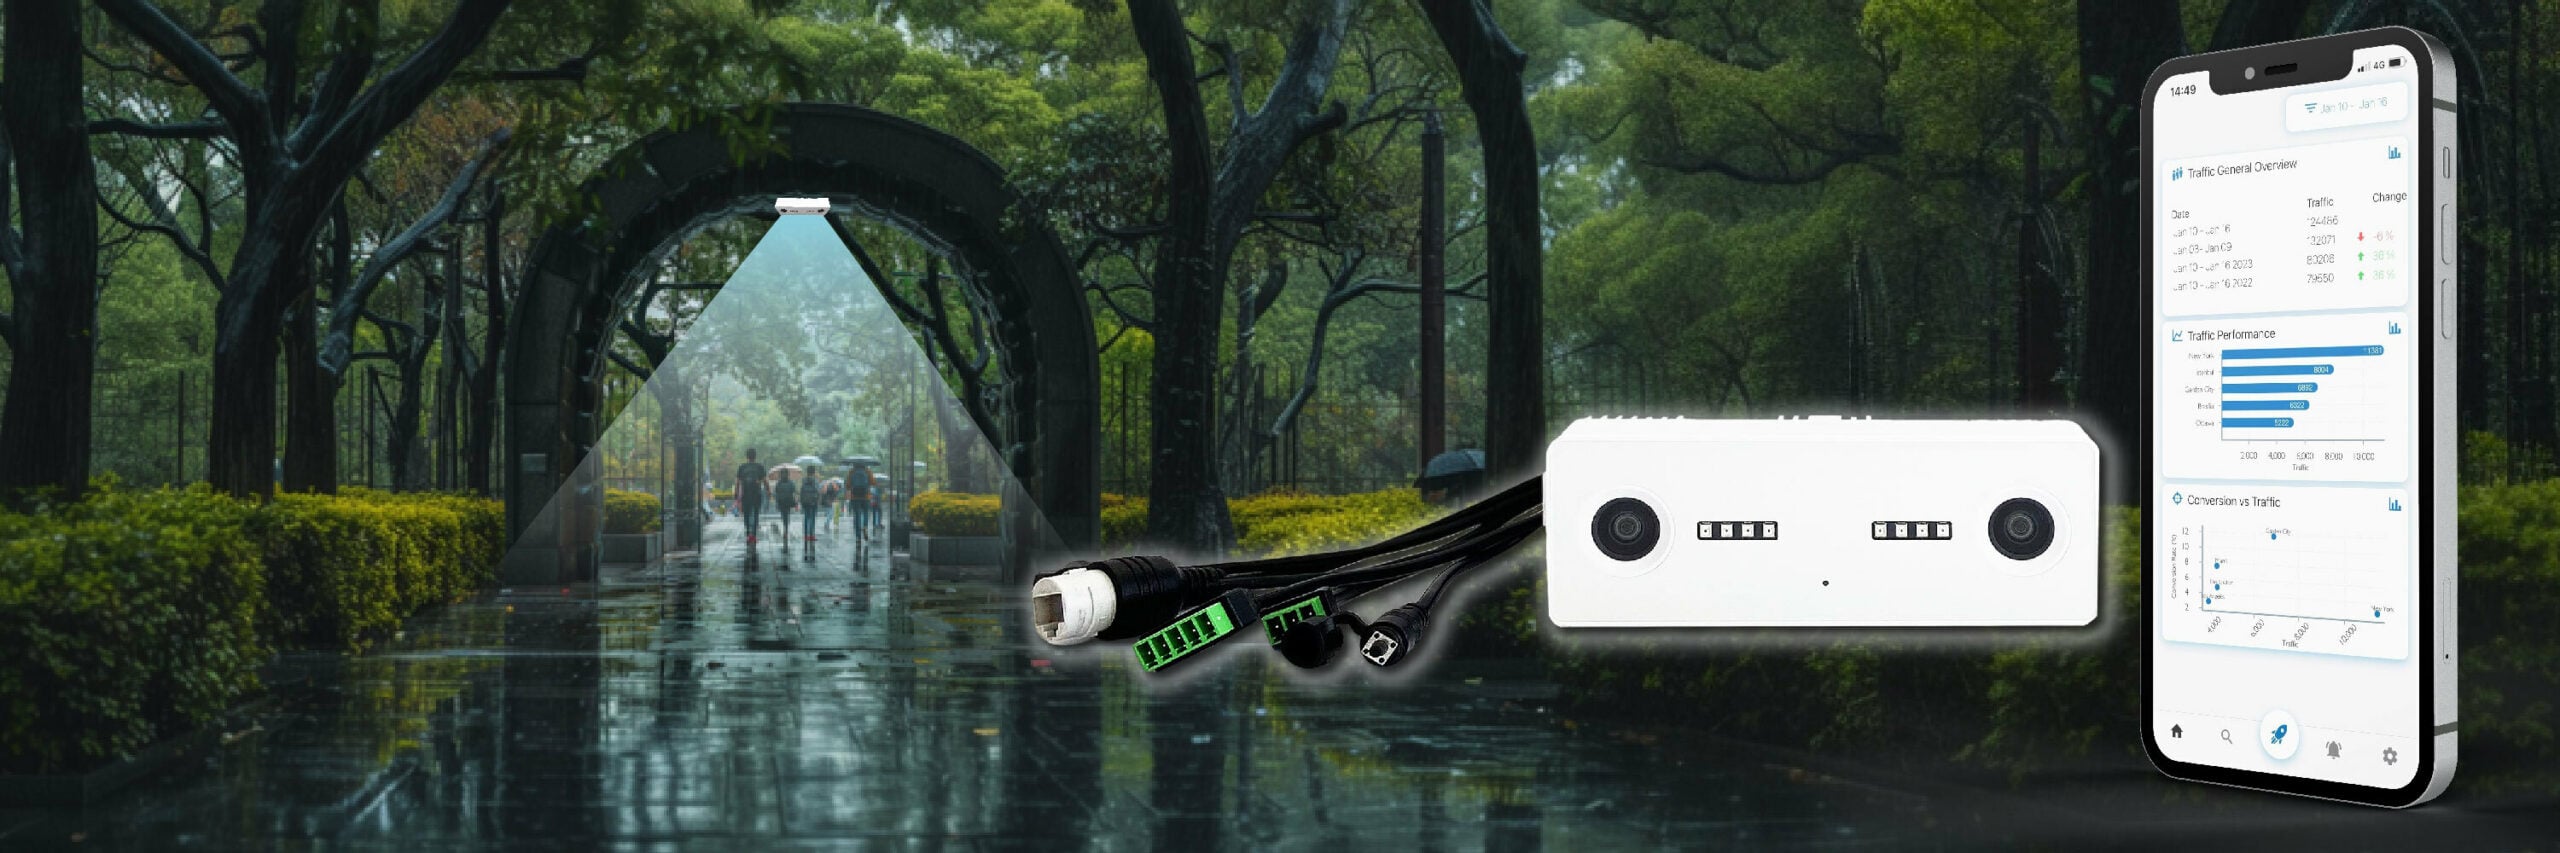
You already paid to attract the traffic. The next growth opportunity is to convert more of it. Retail conversion rate shows how effectively a store turns eligible visitors into transactions. V-Count connects reliable entrance traffic with POS sales and operating context so managers can see where customers are being lost, act on the cause and prove whether the change worked.
If a store records 100 transactions from 1,000 eligible visits, its retail conversion rate is 10%. The number becomes useful only when the visitor count and transaction count follow consistent rules.
Why retail conversion exposes the full sales opportunity
Sales record purchases. Conversion adds the missing view: how many potential customers entered, how many became buyers and how much more revenue the same traffic can produce.
Compare two days with the same sales and different foot traffic. The higher-traffic day reveals the bigger opportunity—more shoppers already entered the store, so stronger service, availability and flow can turn more of that demand into purchases.
Conversion rate separates the traffic opportunity from the store’s ability to serve it. Viewed by hour, weekday and location, it helps managers ask a more useful question: when traffic arrived, what stopped more visitors from buying?
What is a conversion counter?
A conversion counter is a people counter whose entry counts are matched against point-of-sale transactions, so the two figures can be divided into one number: retail conversion rate = transactions ÷ visitors. The sensor itself is the same device used in any foot traffic counter deployment, and it works on the same principle described in what is a people counter.
What turns it into a conversion counter is the POS connection plus a set of counting rules that keep the denominator honest. Without that pairing you have a footfall number, not a conversion number.
What counts as a visitor
Conversion is only as trustworthy as the visitor figure underneath it. Conversion counters therefore need explicit rules for three situations that every store meets daily:
- Staff. Employees who cross the entrance line during deliveries, breaks or kerbside handovers inflate the visitor count and push conversion down. Staff exclusion — through dedicated staff entrances, excluded zones, wearable tags or validated behaviour rules — keeps the denominator customer-only. Whatever method is chosen, it must be applied the same way in every store.
- Groups. A family of four usually produces four counted entries and one transaction. Decide whether the store measures individual visitors or shopping parties, document that decision, and never mix the two in the same comparison. Individual counting is the common default; group-adjusted counting is only useful if it is applied consistently.
- Re-entries. A shopper who steps out to a neighbouring unit and comes back is counted twice unless re-entry handling is applied. Re-entries matter most in malls, transport hubs and food-led formats, where the same person may cross the line several times in an hour.
Settle these three rules before the first report is published. Changing them later resets the baseline and makes every historical comparison unusable.
Aligning the time buckets with POS
Visitors and transactions must be summed over identical windows before they are divided. That means the same time zone, the same clock synchronisation on sensor and till, the same trading hours, and the same bucket length — typically 15, 30 or 60 minutes.
A transaction is timestamped when payment completes, while the visit that produced it began earlier, so very short buckets can push a sale into the following interval and distort the rate at the edges. Hourly buckets are the usual compromise: short enough to expose staffing and queue problems, long enough to absorb normal browse-to-buy delay.
Per-store and per-hour conversion
A single chain-level conversion figure hides almost everything a manager can act on. Per-store conversion shows which locations lag comparable peers on the same rules. Per-hour conversion shows when each store loses buyers — the opening hour, the lunchtime staffing dip, the Saturday afternoon queue. The same entry counts also feed wider retail store analytics such as dwell, zone interest and queue duration, which usually explain why a given hour underperforms.
Worked example
The example below uses invented round numbers to demonstrate the formula. It is not V-Count measurement data and is not a benchmark.
If a store records 400 eligible visitors and 80 transactions in the same hour bucket, then 80 ÷ 400 = 0.20, which is a 20% conversion rate for that hour. If staff crossings were not excluded and 40 of those 400 entries were employees, the customer-only denominator is 360 and the same 80 transactions give 80 ÷ 360 = 22.2%.
The sales did not change; only the counting rule did. That gap is the reason conversion counters are defined by their rules as much as by their hardware.
How V-Count counters feed conversion
V-Count supplies the entry counts at the top of that calculation. Nano AI measures traffic at store entrances and can support staff exclusion where the deployment allows it, while Nano Prime uses 3D stereo vision for entrances with heavy group traffic or demanding lighting. Those counts flow into BoostBI, where the POS integration lines transactions up with visitor counts on matching time buckets and builds the conversion dashboards — by hour, by day, by store and across the estate.
The same sensors serve the rest of a people counting programme, so conversion does not require separate hardware. If you want to see the counting rules, the POS connection and the dashboards on your own store layout, book a demo.
How to measure retail conversion rate correctly
The formula is simple. The measurement rules are where many retailers lose confidence. Both inputs must represent the same location, trading hours and customer definition.
| Input | Use | Check before comparing |
|---|---|---|
| Eligible customer visits | The number of customer entries recorded by the people counter. | Staff exclusion, counting lines, entrance coverage and consistent validation. |
| Eligible transactions | Completed purchase transactions from the POS system. | Same store, date range and opening hours as the visitor count. |
| Context | Conditions that may explain movement in conversion. | Promotions, stock issues, pricing, weather, events and unusual opening hours. |
Use hourly data before daily averages
A daily average can hide the exact period that needs action. A store may convert strongly in the morning and weakly during a crowded evening peak. Reviewing visitor traffic, transactions and staffing by hour makes that difference visible.
Conversion is one line of a wider view. Our store productivity scorecard puts it next to revenue per visitor and sales per labour hour.
Confirm the pattern across comparable days, then move coverage toward the hours where additional service can create the greatest return.
Worked example: what does 10% to 15% mean?
Assume a representative store receives 1,000 eligible customer visits and records 100 eligible transactions. Its baseline conversion rate is 10%. If the same measured traffic produces 150 transactions, conversion becomes 15%.
At a $50 average purchase, those 50 additional transactions equal $2,500 more monthly revenue from the same 1,000 visits. Across 100 comparable stores, that is $250,000 per month or $3 million per year in revenue opportunity.
What is a good retail conversion rate?
The strongest benchmark is your own validated baseline, compared with similar locations and equivalent periods. Format, category, price point, location, customer mission and season give every store the right peer group.
Track conversion together with average transaction value and gross margin. The best gains convert more visitors while protecting the quality and profitability of every sale.
A practical 90-day retail conversion plan
A high-performance improvement programme moves from measurement to controlled action. The 90-day target pathway is 10%, 11%, 12%, 13.5% and 15%—with every milestone tied to visible evidence and a clear management decision.
Validate customer counts and transactions. Find the clearest hourly, entrance or store-level gap.
Move existing coverage toward repeatable demand peaks before assuming more payroll is required.
Test one cause at a time: service availability, queues, fitting-room support, stock or an ignored zone.
Document the change and deploy it to comparable stores only after like-for-like evidence.
Days 1–30: build a trusted baseline
Confirm entrance coverage, counting rules and optional staff exclusion where needed. Connect eligible POS transactions and validate a sample against a manual count. Review conversion by hour and store rather than relying only on a network average.
Days 31–60: test the biggest controllable leak
Choose one intervention for one repeatable problem. That might mean moving an existing team member into the busiest hour, opening a checkout earlier, improving fitting-room support or moving a product display. Keep the weekday, trading hours and measurement rules comparable.
Days 61–90: keep what repeats and scale carefully
When the result holds across equivalent periods, document the intervention and apply it to stores with similar formats, traffic patterns and operating conditions. Each location’s response becomes the next coaching priority.
The rule that protects the result
- Change one major variable at a time.
- Compare the same store, weekday and trading hours.
- Record promotions, stock problems, local events and pricing changes.
- Require the result to repeat before scaling it.
- Investigate exceptions rather than hiding them in an average.
How Nano AI and BoostBI support conversion improvement
Nano AI measures entrance traffic and can support optional staff exclusion in suitable deployments. The aim is to protect the denominator used in every conversion calculation.
BoostBI brings visitor and eligible sales data together so teams can review conversion by hour, day and location. Reports, alerts and recommendations help managers focus on the periods that deserve investigation.
Nano AI
Creates a reliable view of customer traffic at relevant entrances, with optional staff exclusion where the deployment supports it.
BoostBI
Connects traffic, sales and operational context so teams can see where conversion changes and test why.
V-Count is rated 4.6 out of 5 from 10 reviews.
Common retail conversion measurement mistakes
- Comparing mismatched periods: visitor counts and transactions must cover the same trading hours.
- Counting staff as customers: repeated staff movement can distort the denominator, especially at busy entrances.
- Using daily averages only: the biggest opportunity may exist in one or two peak hours.
- Changing several variables together: the number may move, but the team will not know what caused it.
- Copying a universal benchmark: compare similar formats and use a validated internal baseline.
- Ignoring commercial context: conversion should be reviewed alongside average transaction value, margin and stock availability.
Retail conversion rate FAQs
What is the retail conversion rate formula?
Divide completed eligible transactions by eligible store visitors for the same period, then multiply by 100. V-Count BoostBI calculates this automatically from Nano AI counts and your POS data.
How often should stores review conversion?
Weekly review is useful for management, but hourly and daypart views are often needed to identify the operational cause behind a weak average. V-Count BoostBI provides hourly, daypart and weekly conversion views in one dashboard.
Should staff be excluded from visitor counts?
Where staff repeatedly cross the counting line, excluding them can protect the customer-only denominator. The chosen method should be validated and used consistently. V-Count Staff Exclusion removes employees from counts using wearable Bluetooth tags.
Can conversion improve without increasing foot traffic?
Yes. Conversion focuses on the share of existing visitors who buy. Better service timing, queue response, layout, availability or selling execution may improve outcomes from the same measured traffic. V-Count BoostBI shows conversion by hour, so you can see which change moved it.
How does the 10% to 15% target pathway work?
Start with a validated 10% baseline, use hourly traffic, sales and staffing data to select the highest-value controllable gap, prove the improvement and scale the winning action across comparable stores. V-Count BoostBI brings hourly traffic, sales and staffing data together for this analysis.
What should a multi-store retailer compare?
Compare stores with similar formats and traffic intent. Use the same measurement rules, then review conversion by daypart alongside staffing, promotions, stock and local events. V-Count BoostBI compares stores side by side using the same counting rules.
What is a conversion counter?
A conversion counter is a people counter whose entry counts are matched against POS transactions so the store can calculate conversion rate = transactions ÷ visitors. The sensor measures how many people entered; the POS feed supplies how many of them bought.
The pairing only produces a usable rate when the visitor side follows fixed rules for staff exclusion, groups and re-entries, and when both sides are summed over identical time buckets. Any accurate entrance counter can act as a conversion counter once those rules and the POS link are in place.
V-Count Nano AI and BoostBI work as a conversion counter out of the box.
How do conversion counters connect to POS?
Through an integration that pulls transaction records from the POS or ERP and aligns them with sensor counts on matching time buckets. In practice that means agreeing the store identifier, the trading hours, the time zone and the bucket length, then confirming which transactions are eligible — returns, staff purchases and click-and-collect pickups are often excluded.
With V-Count, entry counts from Nano AI or Nano Prime flow into BoostBI, which holds the POS integration and builds the conversion dashboards by hour, day and location.
What is a good retail conversion rate?
There is no single good number. Conversion varies widely by sector, format, price point, catchment and customer mission — a destination speciality store and a high-footfall mall unit are not comparable, and neither are two stores measured with different counting rules.
The only reliable benchmark is your own validated baseline, compared against similar locations and equivalent periods. Judge progress by movement against that baseline, alongside average transaction value and margin, rather than against a published industry figure.
V-Count BoostBI tracks your own conversion baseline so you can measure improvement.
Can an existing people counter be used as a conversion counter?
Usually yes. If the counter measures entrances accurately, exports counts at hourly or finer granularity and can apply consistent staff and re-entry rules, it can serve as a conversion counter as soon as transaction data is connected.
The work is in the data layer rather than the hardware: agreeing eligible transactions, matching time buckets and validating the visitor count with manual checks before the first report is trusted. V-Count can check whether an existing counter meets these tests, or replace it with Nano AI.
Find the fastest credible route to better conversion
Start with one representative store. V-Count can help map the counting rules, POS connection, validation process and the first controlled 90-day test.