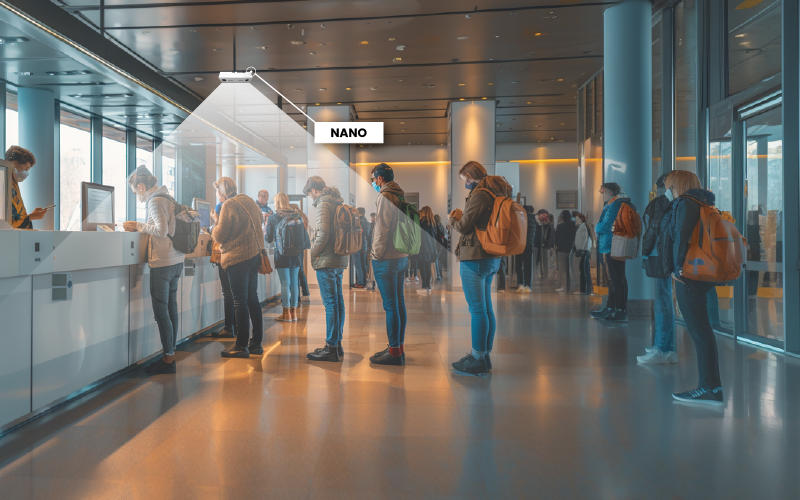



















Banks
V-Count gives a bank branch the headcount that core banking never captures. A bank people counter above the entrance records every arrival, so branch footfall can be set against transactions and the digital shift becomes measurable location by location.
Sensors over the teller line, the advisory waiting area and the self-service lobby turn that headcount into bank visitor analytics: queue length, wait time, dwell, live occupancy against a safe limit, and the appointment-versus-walk-in mix, hour by hour. Counting is anonymous, with no faces, no identities and no images kept, which is why compliance teams clear it.
BoostBI reports every branch on the same definitions, so staffing, opening hours and right-sizing decisions rest on evidence rather than on anecdote.
Explore the gallery showcasing our diverse range of customers. We’re proud to work with these leading brands, providing visitor analytics solutions that drive their success.


Benefits of Visitor Analytics for Banks

Banks can continuously measure footfall traffic and real-time occupancy within their branches, utilizing people counting technology to understand the number of individuals present at any given time. This data facilitates efficient staff deployment and resource management, ensuring optimal operations.
Identifying peak hours is crucial for banks to capitalize on sales and customer conversion opportunities. Leveraging bank people counters allows institutions to pinpoint the busiest periods, enabling them to adapt breaks and shifts accordingly for enhanced service during high-traffic times.
Measuring and increasing conversion rates are vital for banks to enhance operational effectiveness. By comparing the number of visitors to the successful completion of operations, banks can gauge and improve their conversion rates, ensuring a seamless and productive customer experience.
Benchmarking performance across branches provides banks with valuable insights. Identifying high-performing branches allows institutions to replicate successful strategies at less successful locations, promoting consistent quality and customer satisfaction throughout the chain.
Optimizing marketing strategies becomes more effective with continuous monitoring of visitor traffic to related departments. Banks can test the efficiency of new marketing initiatives, ensuring that promotional efforts align with customer behaviors and preferences.

Lowering rent costs is achievable through the analysis of street traffic using visitor analytics. Banks can negotiate better rental deals with property owners by presenting accurate data on street foot traffic, contributing to cost savings and improved overall financial efficiency.
Banks can enhance their understanding of customer behavior and preferences by incorporating advanced visitor analytics into their operations. This technology not only counts the number of people looking at their storefronts but also provides detailed insights into the duration of their attention, as well as the demographics such as age and gender.
By leveraging these analytics, banks can optimize the content and layout of their storefronts, tailoring them to the specific demographics of their audience. For instance, if a particular age group shows more interest in specific products or campaigns, banks can strategically design their displays to capture and maintain the attention of that demographic.
Understanding the gender distribution of storefront viewership allows banks to create more targeted and inclusive marketing campaigns. By tailoring promotions to appeal to different gender segments, banks can increase the effectiveness of their advertising efforts, and increase their revenue as a result.
Bank people counting: what a branch should measure
Core banking tells you what was transacted. It does not tell you how many people came through the door, how long they stood in line, or how many left before anyone served them. A people counting deployment closes that gap. These are the measures a branch network actually runs on.
- Footfall against transactions. The ratio of counted visits to completed transactions is the cleanest read on digital shift. When visits fall faster than transactions, routine business has moved to the app, which is usually the plan. When transactions fall faster than visits, people are still coming in and leaving unserved, and that is a service problem rather than a channel one.
- Queue length and wait time. Measured separately for the teller line and for the advisory, mortgage or business desks, because they behave differently: teller waits are short and spiky, advisor waits are long and appointment-driven.
- Appointment versus walk-in mix. Counted arrivals compared with booked appointments show how much of the day is committed and how much is unpredictable. It is the number that decides whether a branch needs a greeter or a triage desk at the door.
- Self-service and ATM lobby occupancy and dwell. How many people use the 24-hour lobby, at which hours, and how long they stay. Long dwell at a machine usually means confusion or a fault, not loyalty.
- Arrival curve by hour and weekday. Pay days, pension days, market days and the lunch hour produce the same peaks every cycle once a few months of counts exist.
- Occupancy against a safe limit. A live headcount inside the banking hall, compared with the limit set by the branch safety and security policy.
- Branch-to-branch benchmarking. Visits per opening hour, visits per counter position and transactions per visit, normalised so a flagship city branch and a small suburban one can be compared honestly.
Where the bank people counter sensor goes
Placement decides what you can measure, so plan the sensor map before ordering hardware. A bank people counter sensor is mounted overhead and counts crossings of a line or presence inside a drawn zone. It does not need to see a face to do either.
- Main entrance and vestibule. One Nano AI sensor above the inner door gives the branch in and out count. Mounting inside the airlock rather than over the street door keeps passers-by and the security guard out of the figure.
- Teller line and advisory waiting area. Zone counting here is what produces queue length and wait time instead of a simple total, and it lets you see the two waits apart.
- Self-service and ATM lobby. These spaces are often glass-fronted, tall, or lit only by the machines at night. Nano Prime, a 3D stereo sensor, is built for high ceilings and difficult light where an image-based count would struggle.
- Outdoor forecourt, drive-up lane or external ATM. Nano Outdoor is made for weather and counts approaches that never become entries, which is useful when you want to know how much of the passing flow the branch converts.
- Live occupancy. VCare turns the entrance count into a real-time number for the banking hall, with a display or an alert when the hall is fuller than policy allows.
- Reporting. Every sensor reports into BoostBI, the V-Count cloud analytics platform, so one branch, a region or the whole network is read from the same dashboard and the same definitions.
Bank queue management: teller lines, advisor waits and the lobby
Bank queue management works when the queue is measured rather than estimated. Counting sensors over the waiting area give live queue length; paired with the entrance count they give wait time, the minutes a customer spends between walking in and reaching a position. That turns the most common branch complaint into a number with a target attached to it.
Once the number exists it drives action. A threshold on the teller queue can call a second counter position open before the line reaches the door. A long advisory wait flags an appointment book packed tighter than the advisers on shift can serve.
Comparing wait time with abandonment, the arrivals that leave without being served, shows what the queue costs in lost business. Our queue management overview explains the measurement side, and the queue management system page covers how counting data feeds ticketing, calling and digital signage inside a branch.
How banks use the visitor analytics data
- Staffing by hour. Rosters built on the arrival curve instead of on habit: more counter positions at the lunch peak, fewer through the dead mid-morning, breaks moved out of the busiest ninety minutes.
- Branch right-sizing. Visits per opening hour across the network separate the branches that are genuinely busy from those that are quiet all day, and from those quiet only in the afternoon, which may simply need shorter hours rather than a closure discussion.
- Layout and self-service migration. Dwell and zone counts show whether customers use the self-service island or walk straight past it to the counter. That is the honest test of whether a migration programme is working.
- Appointment policy. The walk-in share by branch and by hour decides where appointment-only advisory is realistic and where it would turn people away.
- Safety and occupancy limits. Live occupancy supports the crowd and security limits a branch already has, with an automatic alert instead of a guard counting heads.
- Campaign attribution. A local campaign, a rate change or a product launch should appear as a lift in counted visits at the branches it targeted. If it does not, the spend can be redirected.
- Cleaning, maintenance and cash cycles. ATM lobby traffic per day is a better trigger for cleaning rounds and cash replenishment than a fixed calendar.
Anonymous by design: what a bank people counter does not collect
Banks ask this before anything else, so it is worth stating plainly. V-Count sensors count people; they do not identify them. Processing happens on the device, what leaves the sensor is a number tied to a time and a zone, and no images are stored or streamed for counting.
There is no face matching, no name, no account link and no way to follow one named individual between branches. A visitor is an anonymous body crossing a line, which is all a branch needs in order to staff a counter or open a second teller position.
That is the difference between a people counter and a surveillance camera, and it is usually what carries a deployment through a data protection review.
Want to see it against your own branch plan? Request a demo and we will go through sensor placement, the KPIs above and how the network view looks in BoostBI.
Bank people counting FAQ
How do we measure the digital shift, branch visits versus transactions?
Count every visit at the entrance, then set that number against transactions from your core system for the same branch and period. The ratio is the digital shift in one figure: if visits drop while transactions hold, routine business has moved to the app and the branch is doing higher-value work.
V-Count sensors supply the visit side by hour and by day, and BoostBI keeps the history, so you can show a trend across quarters rather than a single snapshot. Most networks track the ratio per branch, because the shift is rarely uniform across a region.
How do you measure teller and advisor queue length and wait time?
Sensors over the waiting areas count how many people are inside a drawn zone at any moment, which is queue length. Comparing an arrival at the entrance with the moment that person leaves the queue zone gives wait time.
Measure the teller line and the advisory waiting area separately: teller waits are short and spike at lunch and on pay day, advisor waits are longer and tied to the appointment book. Both can drive thresholds, so BoostBI alerts a branch manager before a queue reaches the door instead of after.
Can people counting tell appointment customers from walk-ins?
Not on its own, because a counting sensor sees an anonymous person, not a booking. What it gives you is total arrivals per hour. Set that against the appointments in your booking system for the same hour and the difference is your walk-in volume.
That one comparison is usually enough to decide staffing and whether a branch needs a greeter or a triage desk at the door. Networks moving to appointment-led advisory use the walk-in share to see which branches are ready for it and which would simply turn customers away.
How do we monitor the ATM and self-service lobby out of hours?
Put a sensor in the lobby itself, not only on the main door. You then get visits per hour around the clock, how long people stay, and how many are inside at once.
Long dwell at a machine often signals a fault or a confusing screen rather than loyalty, and a lobby that is busy at 2am but empty at midday changes how you schedule cleaning, cash replenishment and security patrols. Nano Prime suits these spaces because they are frequently tall, glass-fronted and lit only by the machines themselves.
Which branches should we right-size, and what data supports that decision?
Compare branches on normalised measures rather than raw totals: visits per opening hour, visits per counter position, transactions per visit, and the shape of the arrival curve. A branch that is quiet all day is a different case from one that is busy for two hours and empty for six; the first is a footprint question, the second a scheduling one.
Because every branch is measured by the same sensor type and the same definitions in BoostBI, the comparison holds up when it is challenged in a network review.
Does a bank people counter identify customers or record faces?
No. Counting is anonymous. The sensor processes on the device and sends out a count tied to a time and a zone, with no identification, no face matching, no images retained for counting, and no link to an account or a name.
You cannot follow a named individual between branches with it, by design. That is why people counting usually clears a bank data protection review where camera analytics does not, and we are glad to walk compliance teams through exactly what each sensor emits.
How does bank queue management connect to the footfall data?
They are the same dataset seen twice. Entrance counts tell you how many people arrived; zone counts in the waiting area tell you how many are still waiting and for how long.
Together they give abandonment, the arrivals that never reach a position, which is the number that justifies an extra counter at the lunch peak. The counting layer can trigger live alerts and feed ticketing, calling and signage systems, so the queue is managed as it forms rather than reviewed a week later in a report.