Queue Management System:
How It Works and How to Choose One
A queue management system is the set of hardware, software and rules a business uses to organise the people waiting for service and to measure how long that wait really is.
A queue management system is the set of hardware, software and rules a business uses to organise the people waiting for service and to measure how long that wait really is. This guide explains what a queue management system does, how linear, virtual, ticket-based and sensor-based approaches differ, which metrics separate a useful customer queuing system from an expensive ticket dispenser, and how to price and scope a deployment. It is written for the person who has to choose one.
Queuing is the most visible failure mode in a physical business and the least measured. Most operators can quote their footfall to the day and their conversion rate to the decimal, then guess at how long customers waited at the till on Saturday afternoon. Queue management solutions exist to replace that guess with a number – and, increasingly, with an alert that arrives while the queue is still standing there.

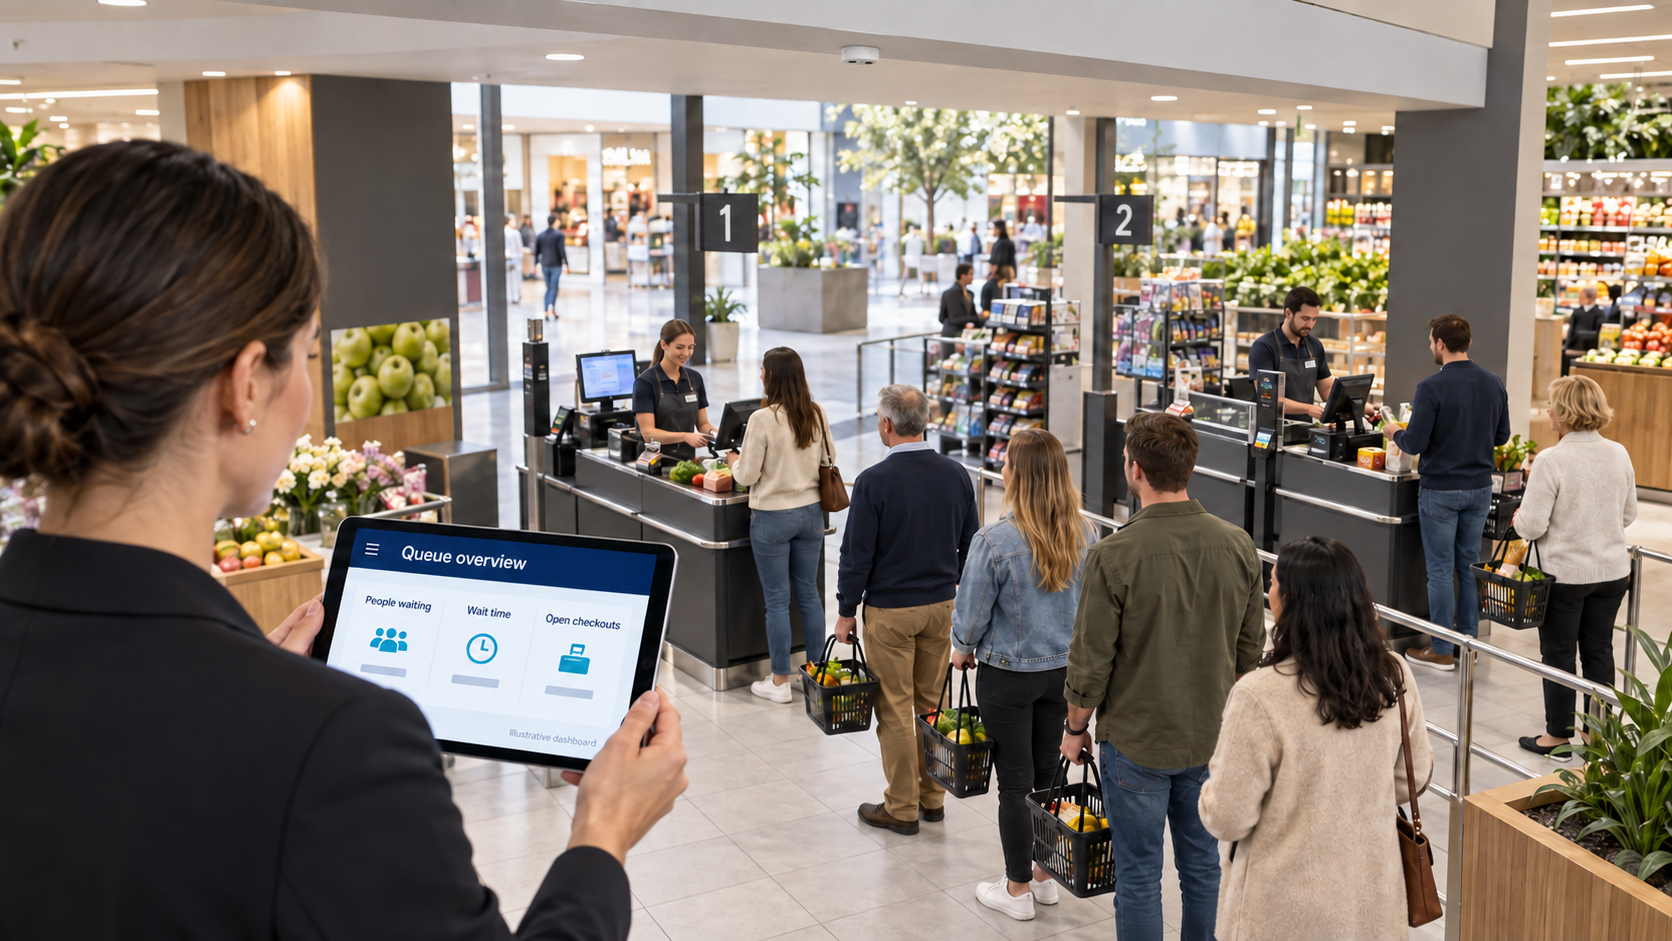
What Is a Queue Management System?
A queue management system is the combination of hardware, software and operating rules a business uses to see how long its lines are, how long people are waiting in them, and what to do about it before customers give up and walk out. At its simplest it is a numbered ticket dispenser and a display.
At its most useful it is a sensor-driven customer queuing system that measures every checkout, counter or service desk continuously and tells the duty manager to open another till thirty seconds before the queue becomes a problem.
The reason the category exists is that waiting is the part of the in-store experience customers remember most sharply and the part operators have the least visibility into. A store can know its footfall, its conversion rate and its basket size to two decimal places and still have no idea that between 17:10 and 17:40 on Thursdays, six people are standing in a line built for two.
Queue management solutions close that gap: they turn a subjective impression of “it looked busy” into a measured number that can be alerted on, staffed against and reported weekly.
This page is a buyer guide. If you already know you want queue measurement and want to see what V-Count’s product does, start with our queue management and measurement solution. If you are still comparing approaches, read on.
Types of Queue Management Systems
Almost every vendor calls its product a queue management system, but there are four genuinely different designs behind that phrase. They solve different problems and they are not interchangeable.

Linear (physical) queue systems
A linear queue is the classic single or multi-lane line: customers stand in a physical order and are served in that order. A linear system manages that line with stanchions, lane guidance, call-forward displays and, in a measured setup, sensors that watch the queue area.
Linear queuing is the right model wherever the transaction is short and the customer has to be physically present anyway – supermarket checkouts, pharmacy counters, quick-service restaurants, box offices. The operational question is never “how do we order the line” but “how many servers should be open right now”, and that is a measurement question.
Virtual queue systems
A virtual queue removes the physical line. The customer joins by scanning a QR code, tapping a kiosk or booking a slot, then gets a text or app notification when their turn is near.
Virtual queuing suits long service times and venues where people can usefully do something else while they wait – mobile phone stores, service centres, clinics, government offices, dealerships. The trade-off is that virtual queues only capture the customers who join them.
Anyone who walks in, glances at the counter and leaves is invisible unless you are also measuring the physical space.
Ticket-based queue systems
Ticket-based queuing – take-a-number – is the oldest digital form. A kiosk issues a ticket, a display calls it, and the system reports on tickets issued, tickets served and time between the two.
It is cheap, well understood and genuinely fair. Its weakness is that it only measures ticketed events. A ticket-based customer queuing system cannot see the person who took no ticket, the person who abandoned before being called, or the three people milling near the counter who were never in the system at all.
It measures service, not demand.
Sensor-based and camera-based queue measurement
Sensor-based systems measure the queue itself rather than the tickets. An overhead sensor is mounted above the queue area, a virtual queue zone is drawn in software over the floor space the line occupies, and the sensor reports how many people are inside that zone, how long they stay there and how fast the zone drains.
Optical sensors using onboard AI are the most common form today because they can distinguish the shape of the queue – people standing in line versus people browsing a nearby display – rather than just counting crossings on a line.
This is the only approach that measures everyone, ticketed or not, and it is the approach V-Count builds. It is also the only one that produces a usable abandonment figure, because it can see people enter the queue zone and leave it without reaching the counter.
Which type fits which venue
| Type | Best for | Measures demand? | Measures abandonment? |
|---|---|---|---|
| Linear, unmeasured | Very small sites | No | No |
| Ticket-based | Banks, service desks, clinics | Ticketed visitors only | Partially |
| Virtual queue | Long service times, appointment-led venues | Enrolled visitors only | Partially |
| Sensor / camera-based | Retail, grocery, QSR, airports, any open queue | Yes – everyone in the zone | Yes |
Many mature deployments combine two: a ticket or virtual queue for the customer-facing experience, and sensor-based queue measurement underneath it for the operational truth. The ticket system tells you what you served. The sensors tell you what you missed.
Not sure which type of queue system fits your site?
Tell us how your queues form — single line, ticketed, multi-till or outdoor — and we will show you what the sensors would measure.
What a Queue Management System Actually Measures
When you compare queue management solutions, compare the metrics they produce rather than the features they list. Five numbers do almost all of the work.
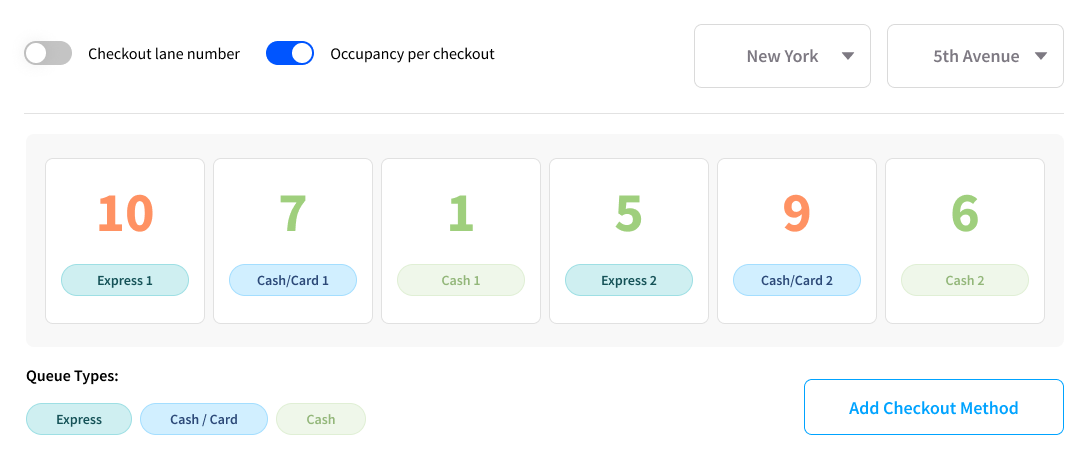
Queue length
The number of people standing in a defined queue zone at a given moment. This is the raw signal everything else is built on. A good system reports it continuously per zone – per checkout bank, per counter, per service point – not as a single site-wide figure, because the whole problem is that one till is drowning while the one next to it is idle.
Waiting time
How long a person spends in the queue zone before reaching the point of service. Average waiting time is the headline number executives ask for; the percentile figures are the ones that matter operationally. A four-minute average hides the fact that one customer in twenty waited eleven minutes, and it is that customer who writes the review.
Service time
How long the transaction itself takes once the customer reaches the counter. Separating service time from waiting time is what turns a queue report into a decision. A long wait with fast service means you need more open counters. A long wait with slow service means you need training, better equipment or a different process – adding staff will not fix it.
Queue abandonment
The share of people who enter the queue zone and leave without being served. This is the metric that converts queuing from a customer-experience topic into a revenue topic, because every abandonment is a basket that was assembled and then put down. It is also the metric most systems cannot produce, since a ticket kiosk never knew those people existed.
Staffing triggers and alerts
A measurement is only useful if something happens because of it. The last capability to check is whether the system can fire a threshold alert in real time – queue length above five, or waiting time above three minutes, for longer than a set number of seconds – to a screen, an app or a headset, so a supervisor opens another register while the queue still exists.
Historical reports improve next month’s rota. Alerts fix this afternoon.
How to Choose a Queue Management System: A Checklist
Work through these questions with any vendor before you shortlist. They are ordered roughly by how often they derail a deployment.
Does it measure everyone, or only enrolled customers?
If the system depends on a ticket or a QR scan, accept that your abandonment and demand data will be incomplete.
Can you define queue zones in software?
Store layouts change. Drawing and moving a queue zone should be a two-minute job in a dashboard, not a site visit.
How many zones does one sensor cover?
This drives hardware cost more than any other factor. A wide checkout bank covered by one well-placed overhead sensor costs a fraction of one sensor per lane.
Does queue data sit in the same platform as your footfall data?
Queue numbers are close to meaningless without the traffic that caused them. If queue measurement lives in a separate tool from your people counting data, someone will spend every Monday morning reconciling two exports.
Are real-time alerts included or an add-on?
Ask specifically what the alert latency is and where the alert lands.
What happens to the video?
For any camera-based option, ask whether images leave the device, what is stored, and what the processing happens on.
Can it handle your lighting and ceiling height?
High ceilings, glass frontage, direct sunlight and outdoor queues all constrain sensor choice. Get this confirmed against your actual site drawings.
What is the integration path?
Check for an open API, scheduled exports and whether the vendor has connected to workforce-management or BI tools before.
Who owns installation and calibration?
Sensor placement is the single biggest determinant of data quality. Confirm whether calibration is a service or your problem.
How is it priced as you add sites?
A model that is comfortable at three stores can be painful at three hundred. Ask for the hundred-site number now.
How V-Count Builds a Queue Management System
V-Count’s approach is sensor-based queue measurement. An overhead Nano AI sensor is mounted above the queue area – a checkout bank, a service counter, a security lane, a ticket desk.
In the dashboard you draw a queue zone over the floor space the line actually occupies, and you mark where the point of service sits. From that moment the sensor reports how many people are inside the zone, how long each of them has been there, and how quickly the zone is clearing.
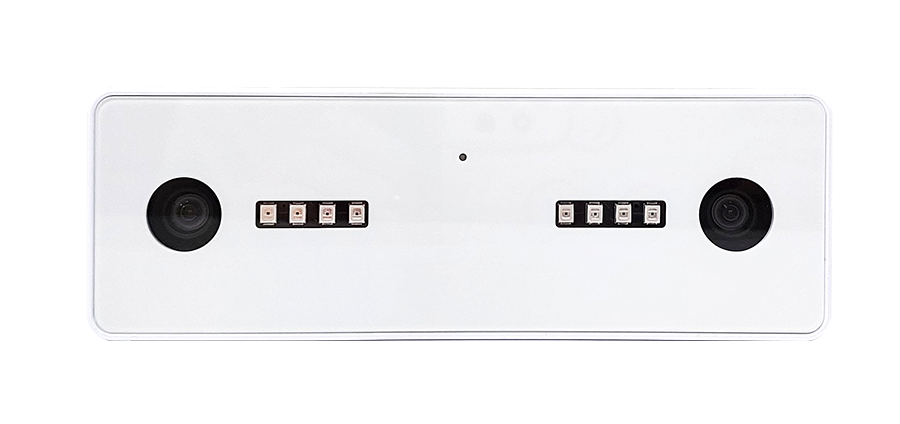
Because the measurement is anonymous by design – the sensor works from the shape and movement of people in a zone rather than from identifying anyone – it captures every customer in the line, including those who never took a ticket and those who left before reaching the counter. That is what makes a real abandonment number possible.
The data lands in BoostBI, V-Count’s cloud analytics platform, alongside footfall, occupancy and zone dwell for the same site. There you set the thresholds that matter to your operation and BoostBI raises a real-time alert when a queue crosses them, so a supervisor can open another register while it still helps.
Over time the same data gives you the queue profile of each store by hour and day – the input you need to build a rota that matches demand instead of guessing at it.
For outdoor queues, entrance lines and sites with awkward light, the Nano Outdoor and Nano Prime sensors cover conditions the standard indoor unit is not built for. Every sensor feeds the same platform, so a mixed estate still reports as one dataset.
If you want the background on why brick-and-mortar retailers invest here at all, our article on why brick-and-mortar stores use queue management covers the customer-behaviour side. For the product detail, see the queue management solution page.
Industries That Use Queue Management Solutions
Any venue where people wait in a visible line has a business case. The metric that justifies the spend changes by sector.

Retail and grocery.
Checkout abandonment is a direct revenue loss, and the trigger for opening a till is the single highest-value alert in the store.
Quick-service restaurants and coffee shops.
Peaks are short and sharp; queue data is used to time staff breaks and pre-position the second server.
Banking and financial services.
Branch waiting time is a regulated service metric in many markets and a board-level customer satisfaction number in most.
Airports and transport hubs.
Security, check-in and passport lanes are measured for passenger waiting time and for resource allocation across shifts.
Healthcare.
Reception, pharmacy and diagnostic queues reveal bottlenecks in patient flow that appointment systems alone do not show.
Public sector and service centres.
Waiting time is often a published service standard, which makes continuous measurement a compliance requirement rather than an optimisation.
Cinemas, stadiums and attractions.
Concession and entry queues cap secondary spend; queue length is the operational lever on it.
How Queue Management System Pricing Works
Vendors quote queue management systems differently enough that a straight comparison of headline figures is usually misleading. Almost every quote is built from the same four components, so ask for them separately.
Hardware, priced per sensor.
Your sensor count is driven by how many distinct queue zones you need to see and how much floor area one overhead unit can cover, not by how many tills you own. This is usually a one-time capital cost with a multi-year hardware life.
Software subscription, usually per sensor or per site per year.
This covers the analytics platform, dashboards, alerting, data retention and updates. Check what happens to your historical data if you reduce the subscription.
Installation and calibration.
A one-time cost per site, sometimes bundled. It is worth paying for properly: badly placed sensors produce plausible-looking numbers that are wrong, which is worse than no numbers.
Support, warranty and integration.
Ongoing, often tiered. API access and custom integrations may sit here rather than in the base subscription.
The variables that move the total are sensor count per site, number of sites, contract length and whether you also want footfall, occupancy and zone analytics from the same hardware – which is normally the cheapest way to add them, since the sensor is already installed and paid for. V-Count quotes against a site drawing rather than from a list price, because the honest answer to “what does it cost” depends on how many zones you actually need to see.
You can review the commercial model on our pricing page or get a scoped figure from a demo request.
Talk to us about your queues
Send us your floor plan and the points where people wait. We will tell you how many sensors it takes and what the queue data will look like.
Frequently Asked Questions About Queue Management Systems
What is a queue management system?
A queue management system is the hardware, software and process rules a business uses to organise the people waiting for service and to measure that wait. Simple versions issue tickets and call numbers.
Measured versions add sensors over the queue area so the system reports queue length, waiting time, service time and abandonment continuously, then alerts a manager when a threshold is crossed. The point is not the ticket or the display: it is having a number for how long people actually wait, per counter and per hour, that you can staff against.
V-Count Queue Management measures queues with overhead sensors.
What is the difference between a virtual queue and a linear queue?
In a linear queue customers stand in a physical line and are served in the order they are standing. In a virtual queue they join remotely – by QR code, kiosk or booking – and are notified when their turn approaches, so they can wait elsewhere.
Virtual queuing suits long service times and venues people can leave; linear queuing suits short transactions where the customer has to be present anyway. A virtual queue only sees customers who enrol in it, so most operators pair it with sensor-based measurement of the physical space to catch the rest.
V-Count Queue Management measures physical queues in real time.
How does a sensor-based queue management system measure waiting time?
An overhead sensor is mounted above the queue and a queue zone is drawn in software over the area the line occupies, with the point of service marked. The sensor then tracks how many people are inside that zone and how long they remain there before reaching the counter.
Waiting time is the time spent in the zone; service time is measured separately at the counter. Because the sensor sees the whole zone rather than a ticket record, it captures every person in the line, including the ones who leave before being served.
V-Count Queue Management measures waiting time this way.
How many sensors do I need for queue management?
Sensor count follows the number of distinct queue zones you need to see and the floor area one overhead unit can cover, not the number of tills. A single well-placed sensor above a checkout bank can often cover several adjacent lanes as one zone, while separated service counters at opposite ends of a hall need one each.
Ceiling height matters too, since a higher mount usually covers more area. The practical way to size a deployment is to mark your queue zones on a floor plan and have the vendor map coverage against it before quoting.
V-Count sizes this from your floor plan.
Is sensor-based queue measurement privacy compliant?
It depends entirely on what the device does with the image. Ask any vendor three questions: does video leave the sensor, is any image stored, and where does the processing happen.
V-Count sensors are built to analyse on the device and report counts and timings rather than identities – the measurement is based on people being present in a zone, not on recognising anyone. Confirm the answers in writing for your own jurisdiction, and check whether signage or a data protection impact assessment is expected in the countries you operate in.
How much does a queue management system cost?
There is no meaningful list price, because the cost is driven by how many queue zones you need to see rather than by store count alone. Every quote is built from four parts: sensor hardware as a one-time cost, a software subscription for the analytics platform and alerting, installation and calibration per site, and ongoing support or integration.
Contract length and estate size move the total significantly. Adding footfall and occupancy analytics to the same sensors is normally the cheapest analytics you will buy, since the hardware is already installed.
V-Count quotes queue management per project after reviewing your queue zones.