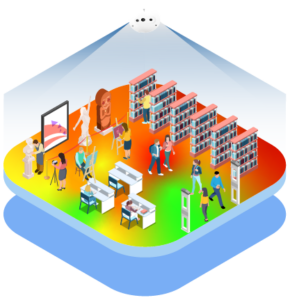
People counting for libraries and museums: what to measure
Libraries and museums both count people, but they count them for different reasons. A library people counter exists mainly to produce defensible gate statistics: the visit totals that go into annual returns, board packs and grant applications, plus evidence of which hours, floors and services are genuinely used.
A museum people counter is closer to a visitor-experience instrument, measuring how many people reached each gallery, how long they stood in front of a display and how long the ticket queue ran on a Saturday morning. Both start with the same measurement at the door and diverge in the zones behind it.
These are the figures worth reporting:
- Door counts and gate statistics. Entries per entrance, per opening hour and per day, rolled up by branch or site. This is the headline number funders, councils and trustees ask for.
- Hourly and weekday patterns. The shape of a normal week, used to set opening hours, desk cover, shelving shifts and invigilator rotas.
- Branch and site comparison. Visits per branch normalised by opening hours, so a small branch open twenty hours a week is not judged against a central library open sixty.
- Programme and event attendance. Counts for a story-time room, lecture theatre or workshop space, separated from general footfall so programme reporting is not an estimate.
- Study-area and reading-room occupancy. A live count of people in a silent study zone, computer suite or archive reading room against its seat count.
- Gallery and exhibition visits. How many of the people who entered actually reached each gallery, and the capture rate of a temporary exhibition against total museum attendance.
- Dwell per exhibit. The average time spent in the zone around a display case, a headline painting or an interactive installation.
- Ticket-desk queue length and wait time. People waiting and how long they wait, which is where museum queue management starts.
- Capacity headroom. Live occupancy of a room or floor against its fire limit or its curatorial limit for a fragile display.
- Member versus ticketed flows. Members entrance and members room traffic reported separately from general admission.
Where the sensors go in a library or museum
Hardware should follow the decisions you want to make. Every public entrance is counted first, because the entrance total anchors every other figure. After that you add the rooms and zones you actually make decisions about: the study floor, the local-history room, the temporary exhibition gallery, the ticket hall, the members entrance. Counting stays anonymous throughout and measures flows through doors and zones rather than individuals.
Library patron counters
A patron counter is a people counter installed in a library: a small sensor mounted above the entrance that registers each person crossing the threshold in both directions and sends anonymous counts to a dashboard. It replaces the clicker at the circulation desk and the one-way turnstile, and it runs every opening hour without anyone remembering to do it.
Modern library patron and people counting systems report entries, exits and occupancy, and keep a continuous history you can query years later.
Features to look for in a library visitor counter:
- Bidirectional counting, so entries and exits are separated and you report visits rather than raw movements.
- Anonymous sensing, with no faces stored and no images of individuals kept, so you can say so plainly in a public privacy notice.
- Tolerance of the doorway you actually have: wide or double doors, glazed lobbies, strong daylight, dark vestibules.
- Filtering that keeps staff doors, book trolleys and pushchairs from inflating the count.
- Reporting that matches your returns: totals by opening hour, day, month and branch, with export or API access for the annual return workbook.
- One dashboard covering every branch, so comparison does not mean merging spreadsheets.
- Simple installation and power, ideally a single Power-over-Ethernet cable per sensor.
- Live occupancy if you manage study floors or capacity-limited rooms.
For a small library, the answer is usually one sensor. A single-door branch needs one Nano AI over the entrance, an AI camera sensor that covers a standard doorway and feeds BoostBI directly.
A library with a tall atrium entrance, a double-height glazed foyer or a very wide lobby should use Nano Prime, the 3D stereo sensor built for high mounting heights and difficult light. Courtyards, forecourts and summer reading tents are covered by Nano Outdoor, and study-floor occupancy displays come from VCare.
Museum galleries, ticket desks and queues
A museum needs the same entrance count plus a layer of internal measurement. Sensors on the thresholds between galleries turn one attendance figure into a route: which rooms every visitor sees, which side gallery two thirds of them miss, how a temporary exhibition performs against the permanent collection.
Inside a large hall, zone analytics measures visits and dwell around individual displays, which is the practical basis of museum foot traffic analytics. The ticket hall and cloakroom are counted as waiting zones so queue length and wait time become numbers rather than impressions, and the members entrance is counted separately so membership value can be reported on its own.
Outdoor sculpture parks, courtyards and gated approaches use weatherproof sensors on the same platform.
How library and museum teams use the data
- Funding and statutory reporting. Continuous, auditable attendance figures per site and per month, exported straight into annual returns, grant applications and sponsor recaps.
- Staffing and rotas. Desk cover, invigilation and shelving shifts matched to the real hourly curve rather than to habit.
- Opening hours. Evidence for extending a busy late evening or closing a consistently empty morning, branch by branch.
- Programme and exhibition evaluation. Attendance per session and capture rate per exhibition, so the next programme is planned on measured results.
- Space and layout. Dwell and zone data showing which reading rooms, collections and galleries earn their floor area, and which entrances or signage routes people ignore.
- Queues and capacity. Alerts when the ticket hall or a capacity-limited gallery passes a threshold, so a desk opens or entry is paced before visitors notice.
- Marketing and community outreach. Footfall before, during and after a campaign, an open day or a school-holiday programme, measured at the door.
- Cleaning and facilities. Restroom and high-traffic zone servicing scheduled against visits since the last clean rather than a fixed clock.
Two longer reads go deeper into this: our analysis of how people counting can transform libraries and our look at how museums and libraries use visitor analytics to secure funding. When you are ready to size a system for your entrances and galleries, book a demo and we will map sensors to your floor plan.
Library and museum people counting FAQ
What are the best patron counters for small libraries?
A small library needs one reliable, anonymous counter over its public entrance rather than a large multi-sensor system. For a single-door branch, one Nano AI sensor above the doorway is usually enough: it counts entries and exits separately, needs a single PoE cable, and sends counts straight to BoostBI.
If the branch has a tall atrium, a double-height glazed lobby or very bright daylight at the door, use Nano Prime, the 3D stereo sensor built for high mounting heights. Look for anonymous counting, day, hour and month totals you can export for your annual return, and a dashboard that shows every branch in one view.
What features should I look for in a library people counter?
Start with bidirectional counting, so entries and exits are separated and you report visits rather than movements. Then check that the sensor is anonymous, with no faces stored and no images of individuals kept, because you have to state that in a public privacy notice.
After that: accuracy across wide or double doorways, tolerance of glass and daylight, exclusion of staff doors and returns trolleys, live occupancy for study areas, reporting by opening hour, day, month and branch, export or API access for your statutory return, and a single dashboard covering every branch. V-Count sensors feed BoostBI, which handles the reporting side.
How do libraries count visitors for annual returns and gate statistics?
With a permanently installed door counter rather than manual tallies. Each public entrance gets a sensor; every crossing is counted in both directions, and BoostBI stores the history so you can pull entries by day, by month, by opening hour and by branch whenever a return, a board pack or a grant application is due.
Because the record is continuous and automatic, the figures stand up to scrutiny in a way that periodic clicker counts never do, and you can normalise branch comparisons by opening hours instead of comparing raw totals.
How do museums count visitors per gallery and per exhibition?
The entrance count tells you how many people came in; gallery counting tells you where they went. Sensors on the thresholds between rooms, or zone counting inside a larger hall, give visits per gallery and a capture rate for each temporary exhibition, which is the share of all museum visitors who actually reached it.
Dwell reporting adds the average time spent in the zone around a display or installation. Together these give curators and sponsors measured attendance and engagement per exhibition instead of an estimate drawn from ticket sales.
Can people counting help with museum queue management at the ticket desk?
Yes. Counting the ticket-desk and cloakroom areas as zones turns the queue into a number: how many people are waiting now, how that builds through the morning, and how long the wait runs on peak days. Queue management reporting in BoostBI can trigger an alert when the waiting area passes a threshold, so a second desk opens before the line reaches the door.
Over time the same data shows whether timed-entry slots, pre-booking or an extra weekend desk actually shortened waits.
How do libraries measure programme attendance and study-area occupancy?
Put a counter on the room, not just the front door. A sensor over the entrance to a story-time room, lecture space or workshop room gives attendance per session, separated from general footfall, which is exactly what programme reports and funders ask for.
For study areas, silent reading rooms and computer suites, live occupancy from VCare compares the current number of people against the seat count, so staff and students can see which floor still has space before they walk up three flights.
How do museums separate member visits from ticketed visits?
By counting the flows separately. A members entrance, members room or priority lane gets its own sensor, so those visits are reported apart from general admission at the main door.
Comparing the two streams over a season shows how much of your attendance comes from membership, whether members visit at different hours than ticketed visitors, and how a members preview night performs against a normal opening day. The counting stays anonymous throughout; it measures flows through doors, not individuals.