Office Cafeterias
An office cafeteria is one short rush wrapped in a long quiet tail, and the till only sees the part of it that pays. V-Count sensors mounted over the cafeteria doors, the serving lines and the seating hall count people in and out anonymously, so catering and workplace teams know how many of the seats are occupied right now, how long the queue at the hot counter is, and exactly how the lunch peak moves between 11:45 and 13:30.
Counts are split by day part and by weekday in BoostBI and compared with meals produced and covers served, which is what turns guesswork about staffing, production volumes and hybrid-work attendance into a number you can plan against. No one is identified: the sensors record a count, never a person.
Explore the gallery showcasing our diverse range of customers. We’re proud to work with these leading brands, providing visitor analytics solutions that drive their success.


















Benefits of Visitor Analytics for Office Cafeterias
Counting the dining room, not just the till, changes four decisions in a staff restaurant. Staffing: the entry curve shows when the serving line and the tills actually load up, so servers, cashiers and clearing staff are rostered to the half hour instead of to the whole shift.
Production: covers counted per day part, set against meals produced, exposes the gap that becomes food waste and lets the kitchen cook to the demand curve for a Tuesday rather than a generic weekday. Capacity: live occupancy against seat count drives busy and quiet signals that spread lunch across a wider window, so the hall never hits the wall at 12:30.
Contract performance: a caterer can show the client evidence of covers served, queue times and service levels instead of anecdotes. Every figure is anonymous headcount data, which is why it can be shared across facilities, HR and the catering contract without touching employee privacy.
Office cafeteria occupancy counter: what to measure
An office cafeteria occupancy counter answers the question a till system never can: how many people are in the dining room at this moment, and how that compares with the number of seats the room actually has. Payment data only records the people who bought something, and it arrives after the service is over.
Counting sensors over the doors give the catering manager and the workplace team a live headcount plus a clean history of how the lunch peak behaves, service after service. These are the measures that matter in workplace dining:
- Live occupancy against seated capacity – how many people are in the hall now as a share of the covers you can seat. This is the figure that drives busy and quiet displays and the nudge that persuades part of the building to eat at 12:50 instead of 12:15.
- Covers per day part – entries split into breakfast, the pre-rush, the main peak and the late tail, so the kitchen plans production against the shape of the day rather than one daily total.
- Serving-line and till queue length and wait time – how many people are standing at the hot counter, the deli line and the tills, and how long the last person to join will wait before being served.
- Weekday attendance pattern – with hybrid working, a Tuesday and a Friday are different businesses. The weekday curve is the most useful single input into a catering contract and into seating and space planning.
- Capture rate – how many of the people in the building on a given day actually used the cafeteria. A falling capture rate is an early warning about the offer, the price or the queue, long before revenue shows it.
- Dwell and table turn – how long people stay once seated, which decides whether a seat shortage is a capacity problem or a turnover problem.
All of this is anonymous corporate cafeteria footfall data. The sensors count bodies crossing a line; they do not identify employees, do not use facial recognition and do not link a count to a badge, a payroll record or a payment.
That is what makes the numbers usable in a workplace where employee monitoring would be unacceptable. The counting principles behind it are explained in more depth on our people counting overview.
Where the sensors go in a staff canteen
A staff canteen people counter is a small set of sensors placed where decisions are made, not a camera pointed at the room. A typical corporate dining installation covers four or five positions:
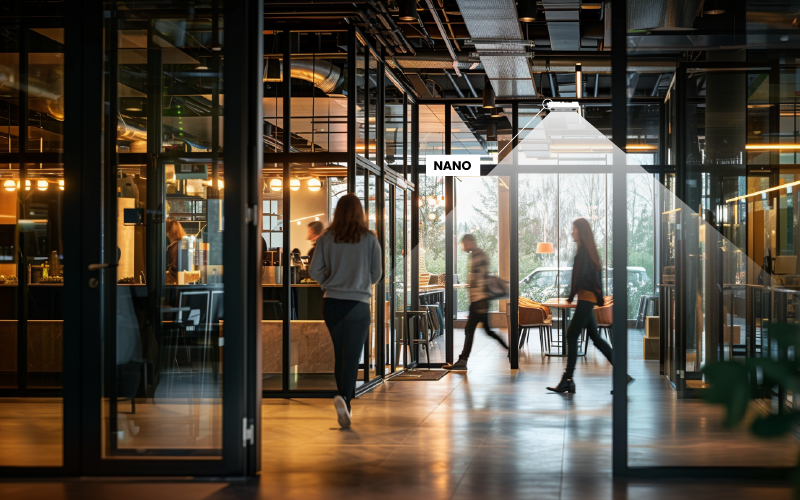
- Cafeteria entrances and exits – Nano AI over each door gives the in and out counts that produce live occupancy and the covers total. Every door has to be covered, including the corridor entrance people use when they only want coffee.
- Atrium and double-height dining halls – Nano Prime uses 3D stereo vision and holds up where ceilings are high and glazed frontage changes the light through the day, which describes most modern staff restaurants.
- Terraces and courtyard seating – Nano Outdoor extends the same counting to outdoor covers, which in summer can be a third of the service and are otherwise invisible.
- Serving lines and till lanes – counting zones over the queueing area in front of the hot counter and the tills turn a visible line into a measured one. The alerting and wait-time logic is the same as on our queue management page.
- Seating zones – separate zones for the main hall, the quiet area and any breakout seating show which parts of the room fill first and which never fill at all.
Live workplace dining occupancy is published through VCare, which turns the running count into a busy or quiet status on an entrance screen, a lobby display or an intranet page. Everything else lands in BoostBI, the cloud analytics platform, where counts are grouped by day part, weekday and site, compared with meals produced, and pushed out as scheduled reports and threshold alerts.
Where the cafeteria sits inside a wider workplace estate, the same counts feed building-level analysis – see people counting for smart buildings for how dining demand reads alongside floor and meeting-room occupancy.
How catering and workplace teams use the data
- Roster kitchen and serving staff to the demand curve. The entry curve shows when the hot counter and the tills actually load, so servers, cashiers and clearing staff are scheduled in half-hour blocks against the peak instead of evenly across the shift.
- Plan production and cut food waste. Counted covers per day part set against meals produced makes over-production visible as a number at every service. The kitchen cooks to what a Tuesday really looks like rather than to an average that fits no day of the week.
- Stagger lunch instead of buying more tables. When live occupancy is published as a busy or quiet signal, enough people move their break to take the edge off the peak. It is the cheapest capacity a full dining hall will ever get.
- Size the catering contract to hybrid attendance. Several weeks of counts show which weekdays the office is genuinely full. That evidence sets service levels per day, justifies reducing a service on the lightest day, and stops the contract being priced against a five-day office that no longer exists.
- Give the client auditable SLA evidence. A contract caterer can report counted covers, peak occupancy against capacity and queue wait times against the agreed standard, from an independent measurement rather than from its own till. Contract reviews stop being an argument about anecdotes.
- Benchmark across sites. With every cafeteria reporting into one BoostBI account you can compare covers, peak timing, meals produced per counted cover and queue performance site by site, then copy whatever the best site is doing.
- Feed space planning. Seat pressure measured over months tells facilities whether the dining room needs more covers, a second service window or simply a different layout, and it does the same for the breakout seating around it.
If you want to see counted covers, live occupancy and queue times on your own floor plan, book a demo and we will walk through a workplace dining setup with the sensors that fit your hall.