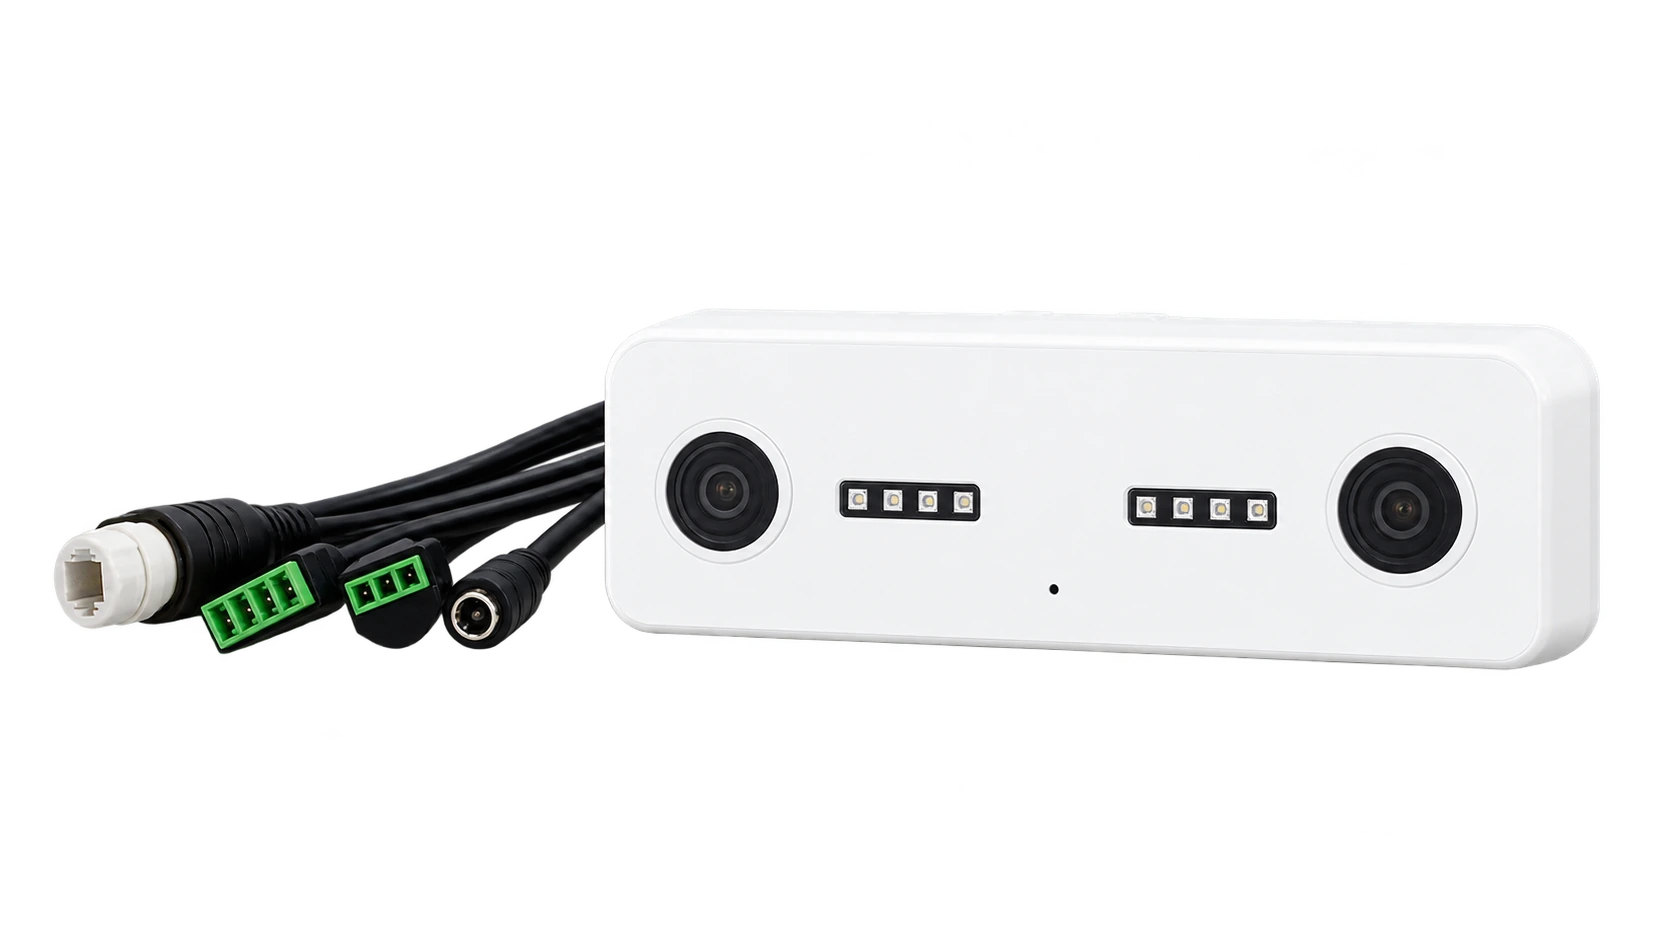
Solution · Storefront analytics
Storefront AnalyticsCount who walks past, who walks in and what your window changes
V-Count storefront analytics measures the street in front of your shop as well as the door. A Nano Outdoor sensor counts the people passing your frontage, a Nano AI sensor counts the people who walk in, and BoostBI turns the two counts into capture rate by hour, day and store.
An entry count tells you how many people came in. Storefront analytics also tells you how many could have, and whether your window, signage or offer is pulling more of them inside.
Two counts. One ratio.
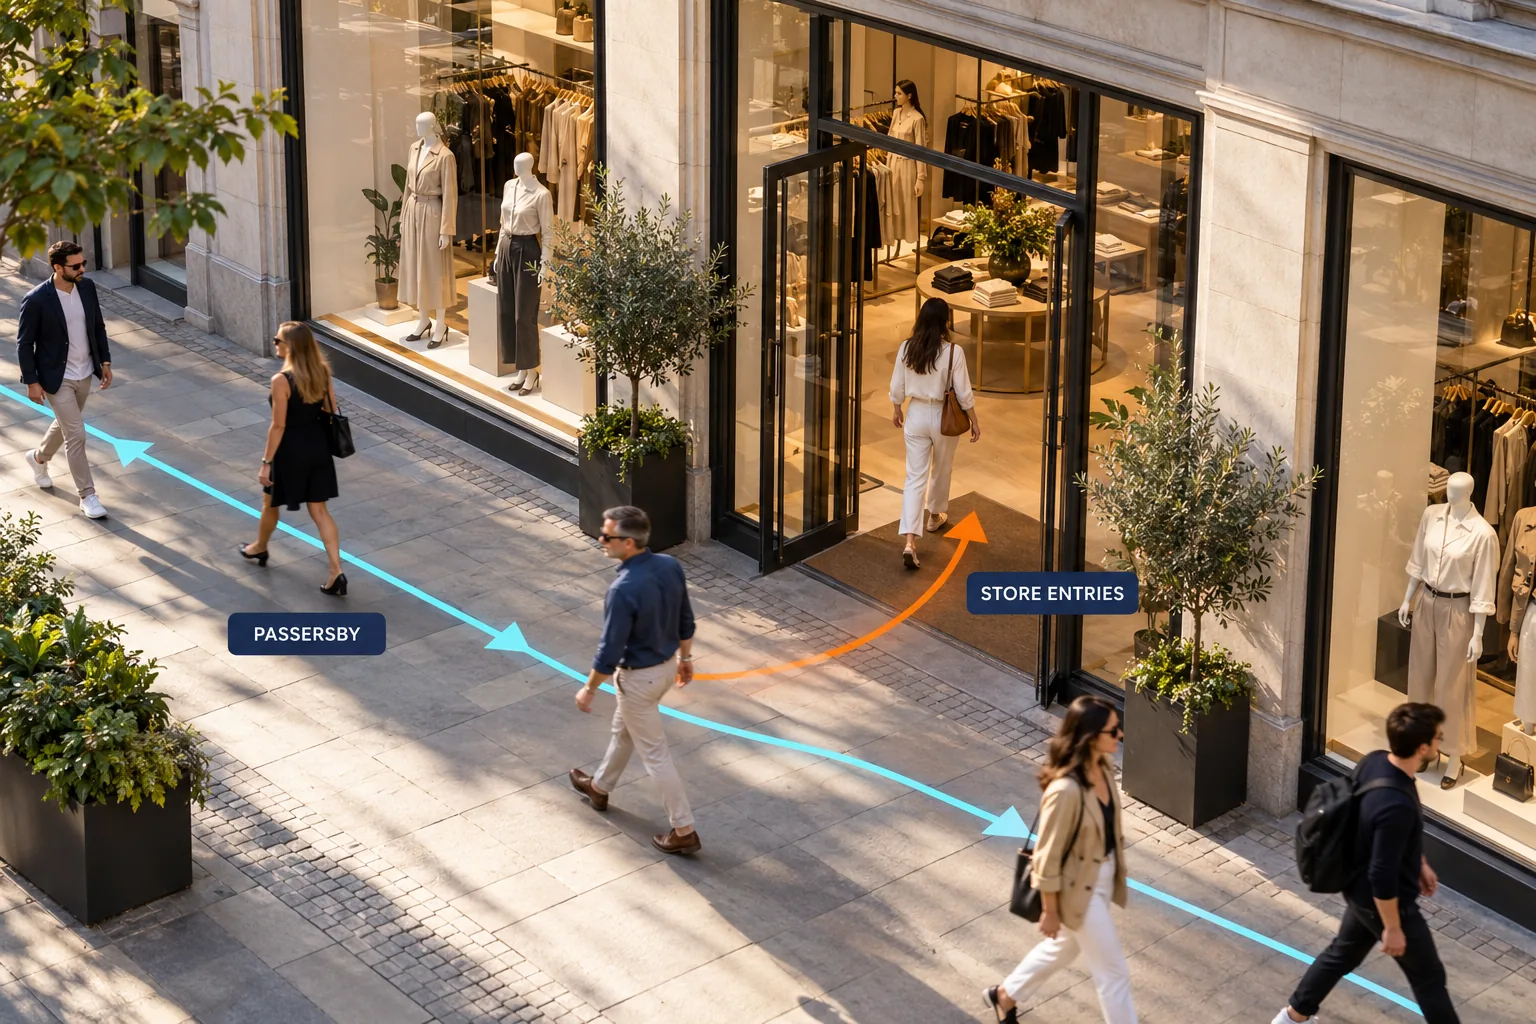
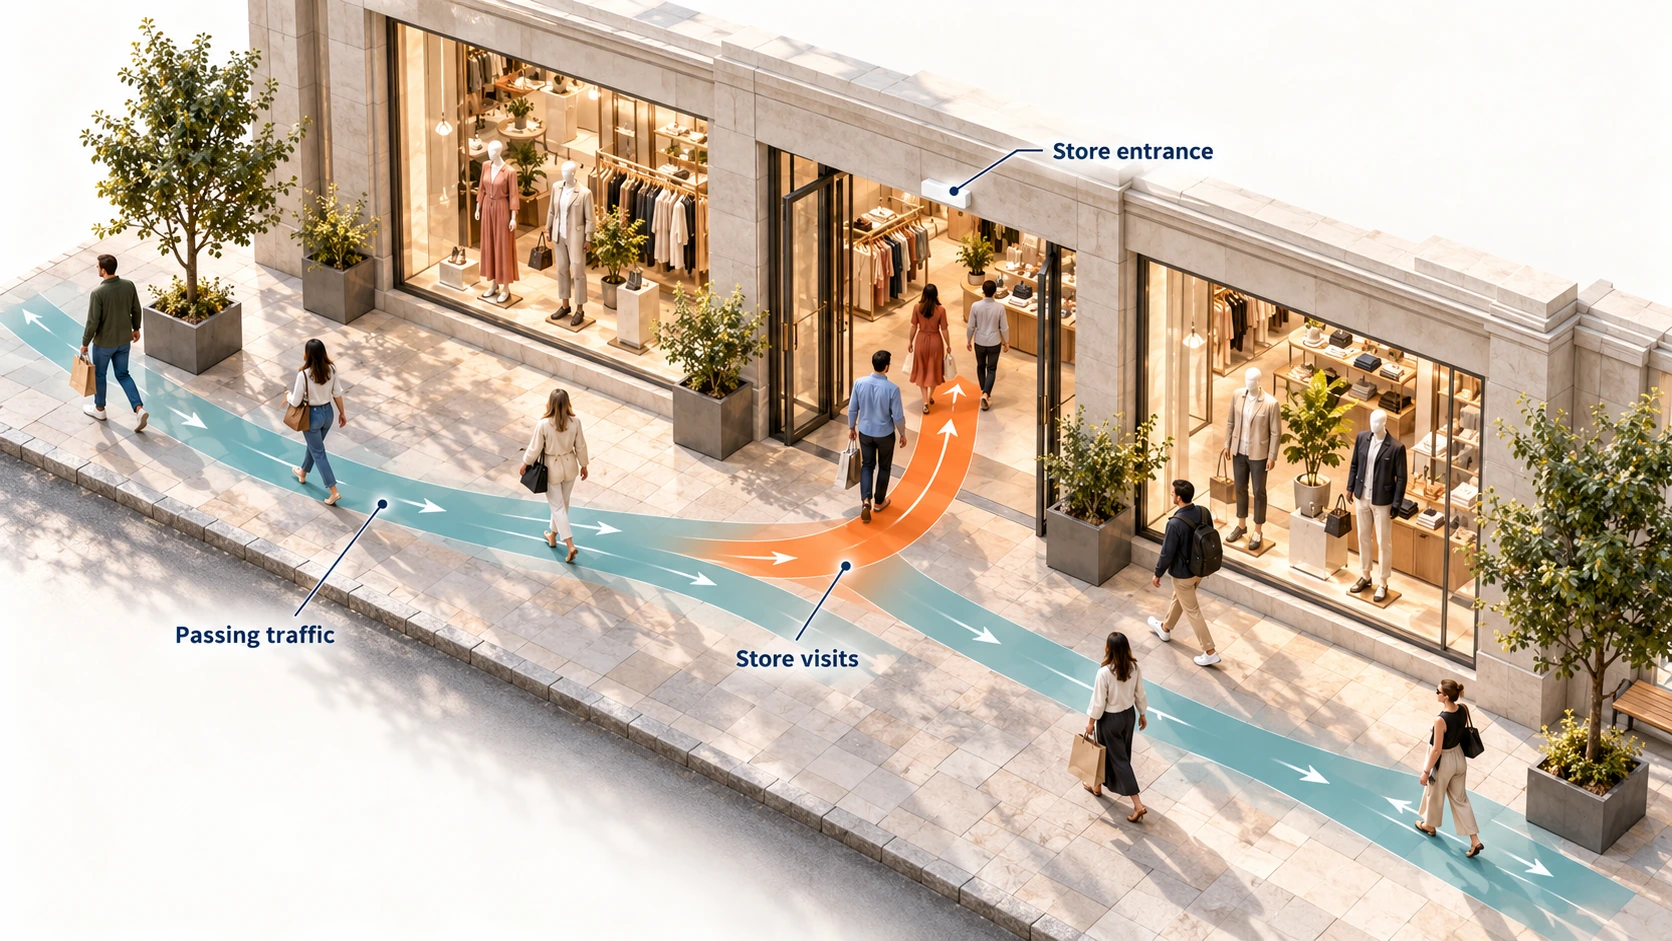
A door counter only sees the people who came in. Storefront analytics adds the people who walked past. Nano Outdoor counts the pavement in front of your frontage, Nano AI counts the entrance and BoostBI divides one by the other. The result is capture rate: the share of the street your storefront turns into visitors.
What are the latest tools used for storefront analytics? The latest storefront analytics tools are V-Count’s sensors with BoostBI: Nano Outdoor counts the passers-by in front of the store, Nano AI counts the entries at the door and BoostBI turns both into capture rate by hour, day and store, next to your sales. To analyze the performance of target storefronts, compare capture rate across stores and window campaigns, and measure passing traffic for a few representative weeks before you commit to a new location.
Explore Nano OutdoorPassing traffic
Nano Outdoor counts the people walking past your frontage in both directions, in rain, heat and darkness, with up to 99% accuracy.
Outdoor sensorStore entries
Nano AI above the door counts the people who walk in, with up to 99% accuracy at an indoor entrance line, and can keep staff out of the count.
People countingCapture rate
BoostBI calculates entries ÷ passing traffic × 100 automatically, by hour, day and store, next to your sales.
How capture rate worksMeasure both sides of the door with the same rules and you can test a window display, compare locations fairly and put a number on the street outside.
Why entry counts alone are not enough
Two shops with the same number of entries can face very different streets. Capture rate adds the missing context: how many people had the chance to walk in, and how many of them did.

Measure the opportunity, not just the result
Capture rate is eligible entries divided by eligible passing traffic at the same frontage, multiplied by 100. Count both over the same frontage and the same trading hours, and the ratio shows how well your storefront turns the street into visitors.
Capture is not purchase conversion. Capture measures the step from street to door; purchase conversion measures the step from visit to till. BoostBI shows both, so you can see where people drop out.
For the full method, read our storefront counting and capture rate guide.
Passing traffic
People who pass through the agreed area in front of your shop, including those who turn in.
Window interaction
Stops or dwell in a defined zone in front of the display, where your configuration measures it.
Entries & capture
People who walk in through the entrance that belongs to that frontage, as a share of passing traffic.
Purchase conversion
Purchases at the till divided by store visits for the same store and period.
Worked example to show the arithmetic, not customer data: capture rate = entries ÷ passing traffic × 100. 246 ÷ 1,325 × 100 = 18.6%. If those 246 visits produced 49 purchases, purchase conversion would be 49 ÷ 246 × 100 = 19.9%, a separate number.
How storefront analytics works, step by step
One sensor over the pavement, one above the door, processing on the device and one analytics platform for every store.
Nano Outdoor counts the street
Nano Outdoor mounts above your frontage and covers the pavement in front of the store. 3D stereo vision with AI tracking counts people walking in both directions, and the IP65 housing keeps it counting in rain, heat and darkness.

Nano AI counts the door
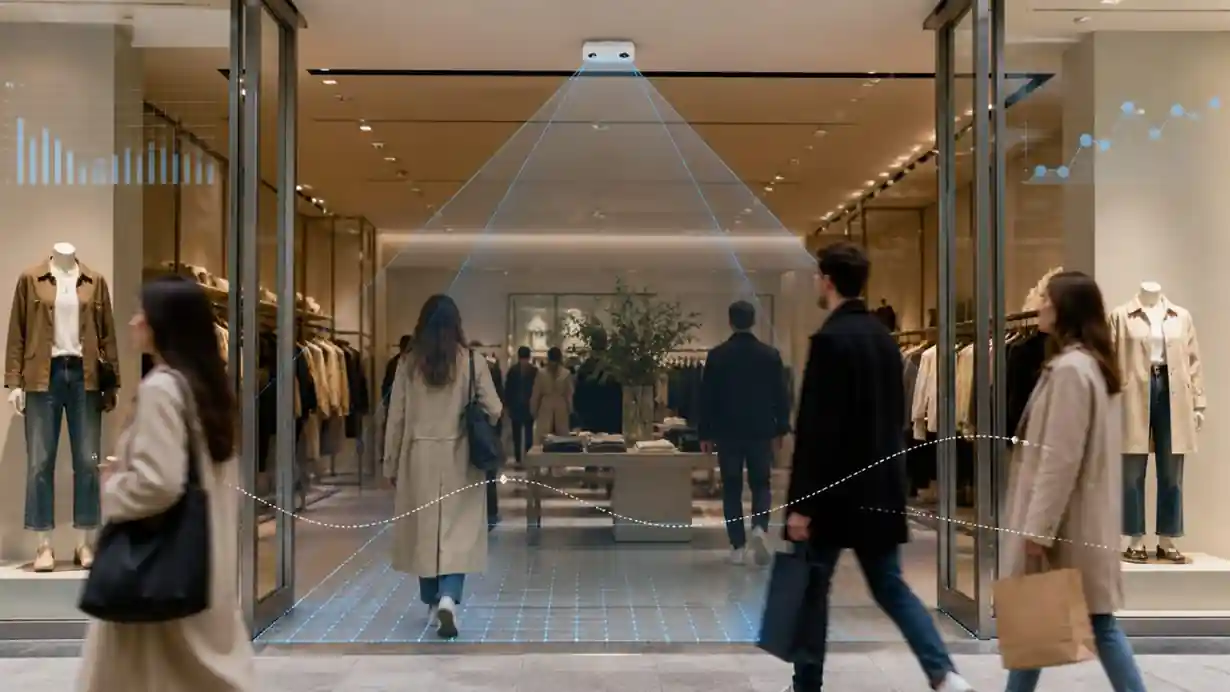
Nano AI sits on the ceiling above the entrance and counts each person who crosses the counting line, in and out, with up to 99% accuracy. Staff who wear a shoulder tag or lanyard can be kept out of the count.
Only anonymous counts leave the sensors
Both sensors process everything on the device and send anonymous counts to BoostBI, not images. Nothing can be replayed or matched to a person. V-Count is ISO 27001 certified.
BoostBI turns two counts into capture rate
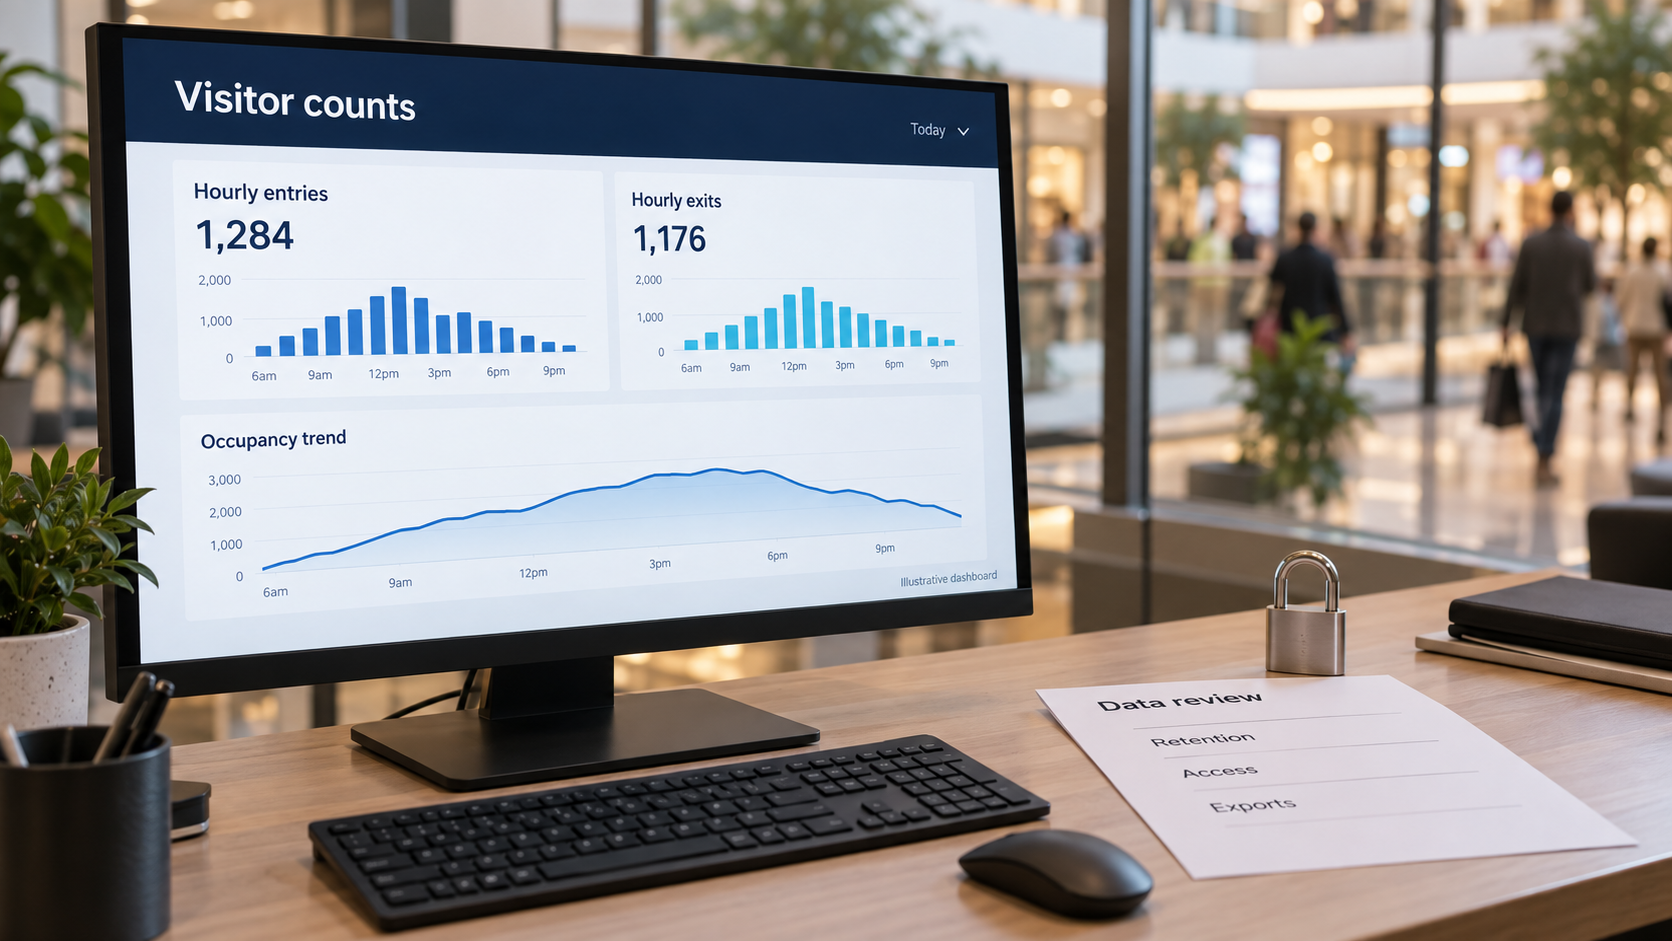
BoostBI puts passing traffic, entries and capture rate side by side by hour, day and store, and joins them with your sales, so you see the whole funnel from street to door to purchase.
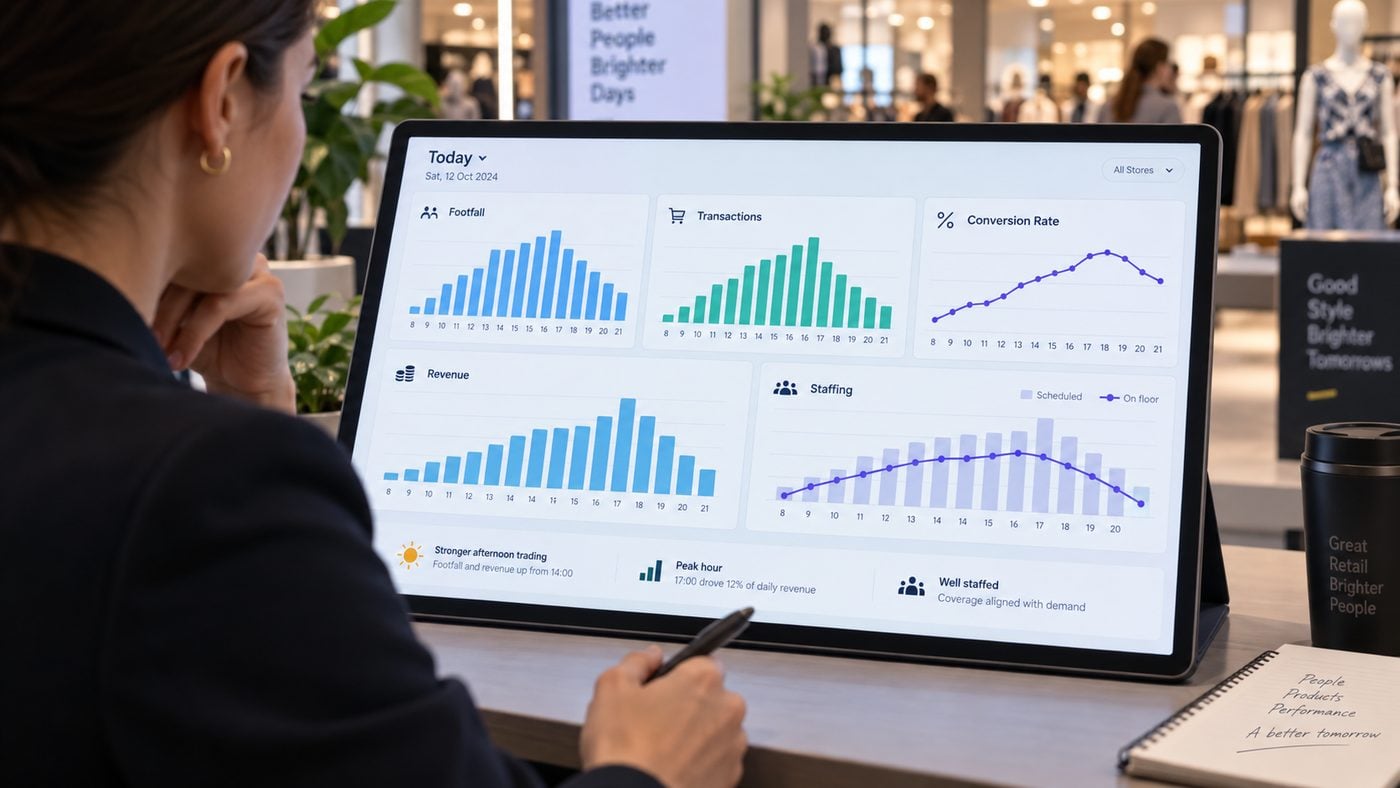
A/B test your window displays
A new window, sign or offer is a test. Storefront analytics gives you the before and after in numbers, so you can keep what works and roll it out across the chain.
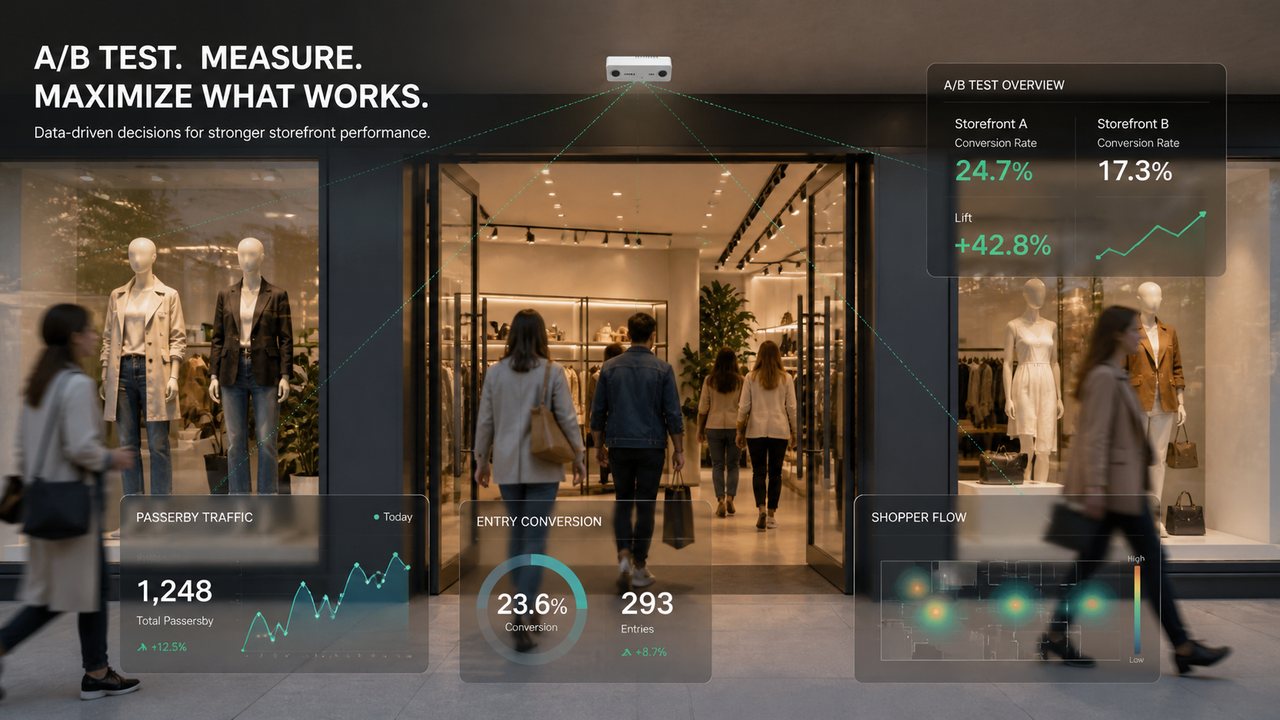
Change one thing, then compare capture rate
Run one display, sign or promotion at a time and compare capture rate on the same days and hours before and after the change. Because Nano Outdoor counts the street, a busy Saturday does not flatter a weak window: the passing count moves with the traffic.
- Compare at least two full, comparable weeks before and after
- Log weather, promotions, stock and opening hours next to the numbers
- Alternate variants, or use a similar store as a control, where you can
- Keep the best performer and roll it out to similar stores
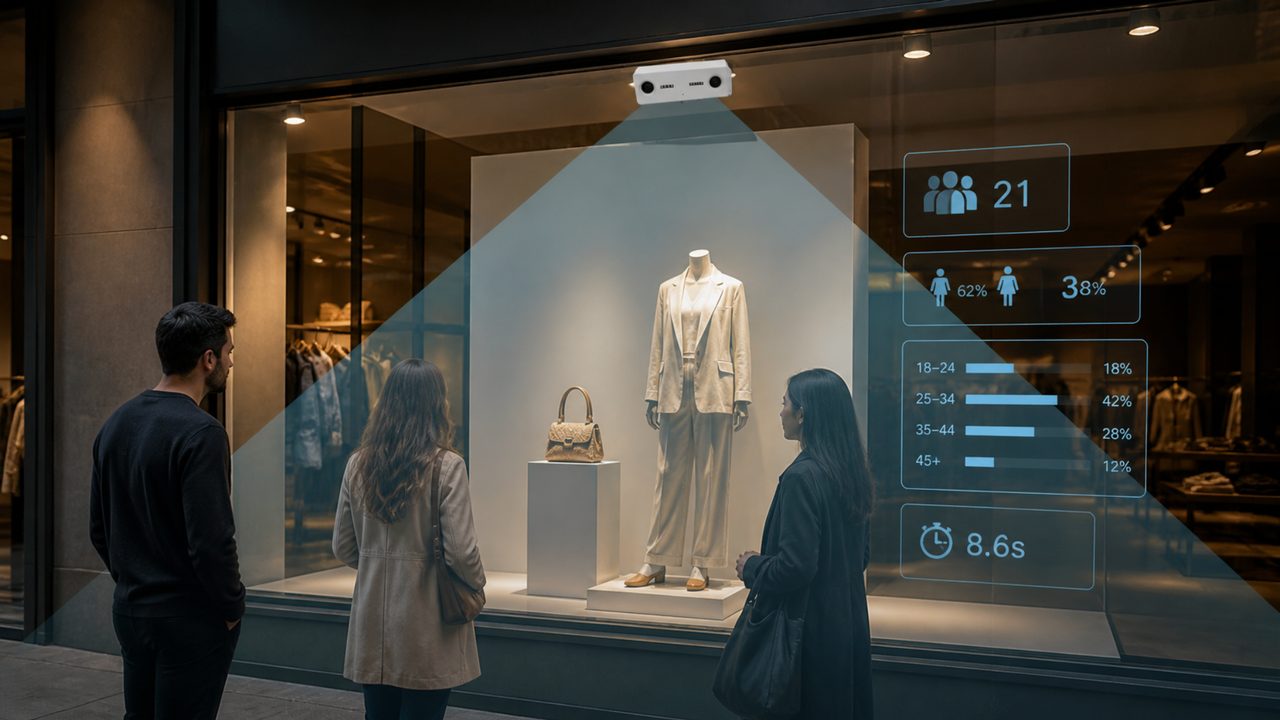
See who stops, not only who passes
A window can make people stop without making them walk in. Where your configuration supports it, V-Count can also measure stops and dwell time in a defined zone in front of the display, so you see how long the street looks at your window.
Read it next to capture rate and sales: more stops alone do not prove more purchases.
1. Record a baseline
Collect passing traffic, entries and purchases before you change anything.
2. Change one thing
Photograph and date the new display, sign or lighting, and keep the counting set-up fixed.
3. Compare fairly
Use equivalent weekdays and trading hours. A simple before-and-after difference does not prove the cause.
4. Read the whole result
Report passing traffic, entries, capture rate, conversion and sales separately, then decide.
Open when the street is busy
Passing traffic shows when your location has the most potential, not only when people happened to come in. Use it to set opening hours, plan staff and target campaigns.

Trading hours based on the street
Compare passing traffic on weekdays and weekends, find your peak hours and lulls, and adjust opening hours and rotas to match. Nano Outdoor uses active infrared to count at 0 lux, so early mornings and late evenings are in the data too.
- Passing traffic and entries by hour, day and week
- Weekday and weekend patterns side by side
- Staff in place for the peaks, not the averages
Opening hours
See whether the street is still busy when you close, and test longer or shorter hours.
Staffing
Put your team in place for the hours with the most passing traffic and entries.
Audience
Nano AI estimates an age band and gender for the visitors your window draws in, as anonymous data. See age & gender recognition.
Signage & promotions
Compare the same days and hours before and after new signage or an offer, one change at a time.
Put a number on your location
Street counting shows the footfall potential of a site, not just the people who came in. Bring that evidence to rent negotiations and site decisions.

Rent, leases and new sites
Measured passing traffic and capture rate show the real value of a location. Use them in rent negotiations, and compare a candidate site with your existing stores measured the same way.
Evaluating a new site before you sign the lease? Our pedestrian traffic counters for hire measure street footfall for a few weeks without buying hardware.
- Benchmark each location’s street traffic by hour and day
- Compare storefront performance across stores in one view
- Ask where, when and how any landlord footfall figure was measured
High-street stores
Test window concepts, signage, lighting and offers against capture rate and purchases.
Multi-store chains
Compare stores with similar formats and catchments, with passing traffic as context for entries.
Pop-up stores
Treat the site as a test: measure the frontage and entries, then decide to repeat, scale or move.
Mall stores
Count the corridor stream that serves your unit, separate from queues, seating and nearby activations.
Which sensor does what
Storefront analytics usually pairs Nano Outdoor for the street with Nano AI for the door. Where the counting position is sheltered, Nano AI can measure street traffic too; the floor-plan and photo review confirms the right model. Add Nano Prime to follow visitors across the sales floor. All three report to the same BoostBI account.
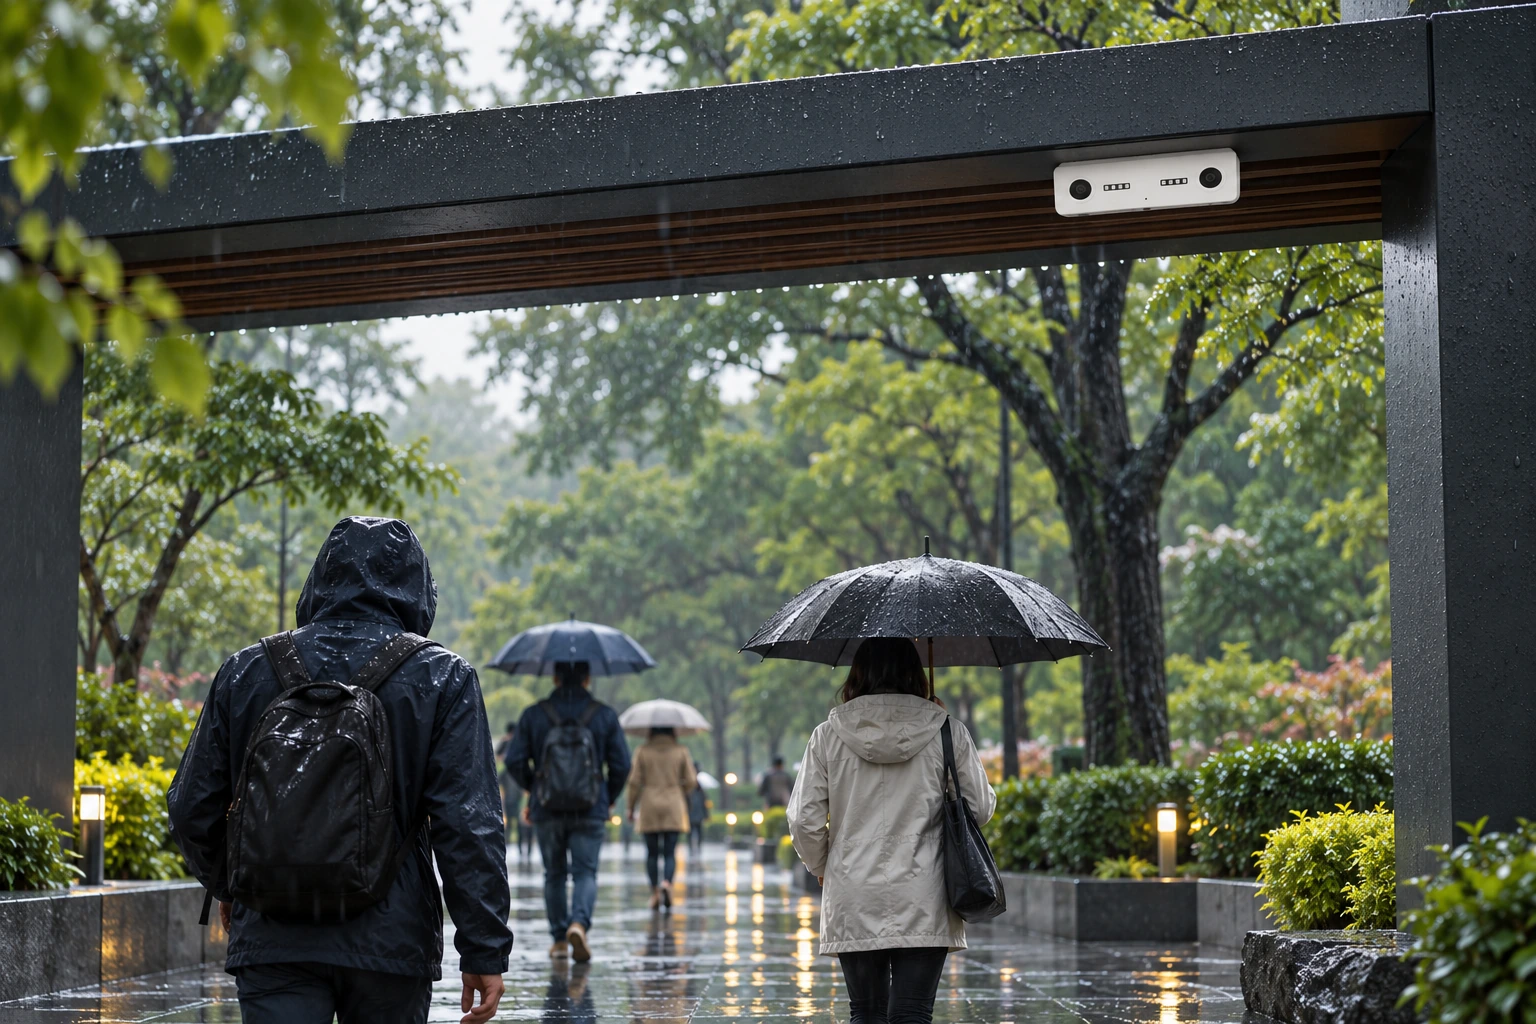
Nano Outdoor: the passing traffic counter
V-Count’s outdoor people counter for shop fronts, high streets and exposed entrances. It counts people walking in both directions with up to 99% accuracy and keeps counting in rain, heat and darkness.
- IP65-rated enclosure, −25°C to +60°C operating range
- Active infrared, counting at 0 lux
- 5 V USB-C power with an external PoE adapter option
- Wi-Fi, up to 40 m in suitable conditions

Nano AI: counting every entry
The indoor people counting sensor for doors and entrances, with up to 99% accuracy at a defined indoor entrance line. It gives you the entry side of your capture rate.
- Mounts on the ceiling at 2.2–7 m
- Runs on 5 V USB-C, with an optional PoE splitter, and connects over Wi-Fi
- Age & gender recognition and staff exclusion on the same sensor
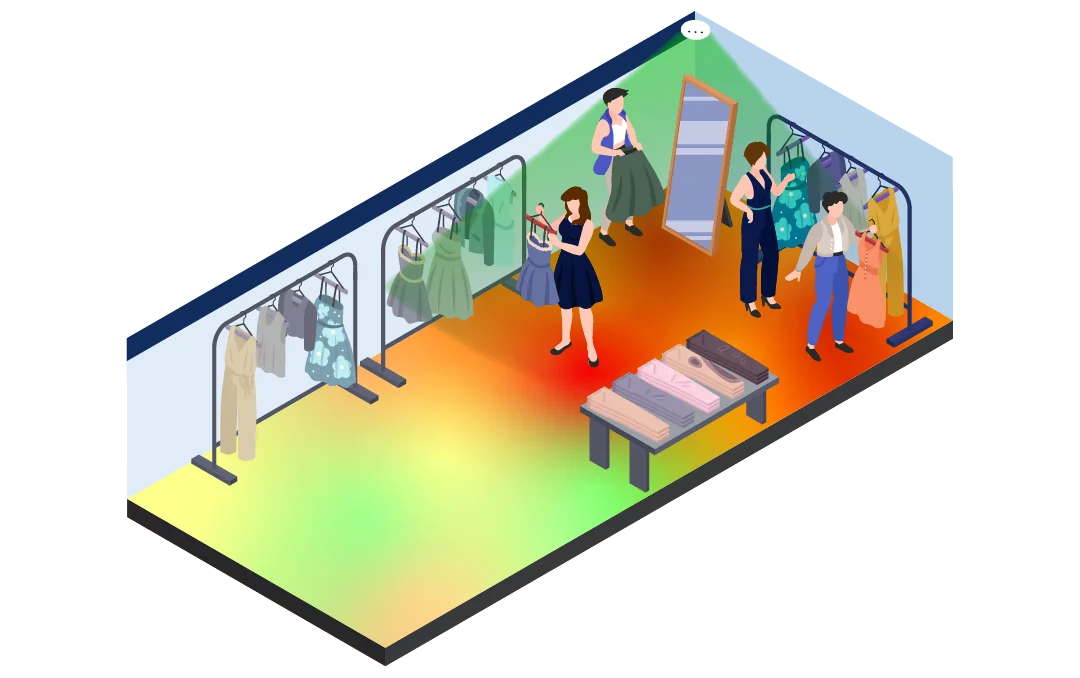
Nano Prime: what happens after the door
Nano Prime measures zones, dwell time, heatmaps and visitor flow on the sales floor, so you can follow the visitors your window brought in. See heatmap & zone analytics.
Explore Nano Prime| Nano Outdoor | Nano AI | Nano Prime | |
|---|---|---|---|
| Role in storefront analytics | Counts passing traffic outside | Counts entries at the door | Zones, dwell time and visitor flow inside |
| Where it goes | Above the frontage, weather-exposed | Ceiling above each entrance, 2.2–7 m | Ceiling above large open indoor floors |
| Environment | IP65, −25°C to +60°C | Indoor | Indoor |
| Darkness | Active infrared, counts at 0 lux | Built-in IR LEDs, works at 0 lux | Ask our team |
| Accuracy | Up to 99% | Up to 99% at an indoor entrance line | Validated for each installation |
| Reports to | BoostBI | BoostBI | BoostBI |
From street counts to decisions in BoostBI
BoostBI is V-Count’s analytics dashboard and mobile app. It puts every storefront in one account, so passing traffic, entries and capture rate are measured the same way everywhere.

The full funnel, from street to till
- Passing traffic, entries and capture rate by hour, day, store and region
- A multi-location view that shows which storefronts pull their weight and which underperform
- Sales joined in, so you see where people drop out between street, door and purchase
- Native Shopify and Nebim connectors, integrations with VendPOS, Nayax, ImagineX and QuickBooks, exports and a REST API
- Reports refresh every 10 minutes, or every minute in real-time mode
- Weekly AI Sales Coach with suggestions for each store
Privacy by design: V-Count sensors process data on the device and send only anonymous counts to BoostBI, with no images or identities. V-Count is ISO 27001 certified.
Setting up storefront analytics
You can start with one store and add more to the same BoostBI account later.
Send a floor plan and a few photos
A floor plan and photos of the frontage and entrance taken by your store manager are enough. V-Count returns placement advice within 24 hours.

Mount Nano Outdoor and Nano AI
Nano Outdoor goes above the frontage to cover the pavement, including the people who turn in. Nano AI goes on the ceiling above each entrance that belongs to that frontage.
Keep the view clear of signs, trees and temporary displays, and leave the road and the opposite pavement out unless you want them counted.
Check both counts against a manual count
Validate passing traffic and entries separately against a manual reference count, at busy and quiet times and in changing light, before you rely on the numbers.

Record a baseline, then test
Collect a few comparable weeks of passing traffic, entries and sales before you change the window. Then run one change at a time and roll out what works.
Use the same counting rules at every store, so comparisons between locations stay fair.
Industries we serve
Storefront and street counting helps wherever a frontage competes for passing traffic. The same sensors and the same BoostBI account work across all of these.
Storefront analytics runs on Nano Outdoor and the Nano AI people counting sensor, reports to BoostBI and works alongside people counting, age & gender recognition, staff exclusion, heatmap & zone analytics and queue management.
Storefront analytics FAQ
Capture rate, window impact and exterior counting with V-Count Nano Outdoor, Nano AI and BoostBI.
Ask an expertWhat are the latest tools used for storefront analytics?
The latest tools used for storefront analytics are V-Count storefront analytics: Nano Outdoor, an IP65 weather-resistant sensor rated up to 99% accurate, counts passers-by; Nano AI counts entries; and BoostBI turns both into capture rate by hour and store. The main tool types today are 3D sensors like these that count passing and entering traffic on the device, mobile-location panels that estimate visits across many sites, and video-based analytics that add attention or dwell in front of the window.
Choose sensor counts when you need your own store’s exact capture rate, and panel data for market-wide comparisons.
How do I measure if my window display actually brings people in?
V-Count’s Nano Outdoor, an IP65 weather-resistant counter rated up to 99% accurate, counts the people passing your window while Nano AI counts the people who enter. BoostBI divides one by the other to give capture rate, so you can compare the weeks before and after a window change and see whether it pulled more people inside.
Lots of people walk past but few come in. How do I measure and fix that?
V-Count measures that gap as capture rate: Nano Outdoor counts passers-by and Nano AI counts entries, both rated up to 99% accurate. Test one display, sign or offer at a time and compare capture rate by hour in BoostBI to see which change turns more of the street into visitors.
How do I calculate my capture rate?
Capture rate = entries ÷ people passing × 100. V-Count’s BoostBI calculates it automatically by hour and day from Nano Outdoor passing counts and Nano AI entry counts. Use the same counting line and opening hours every day so the rate stays comparable over time.
How do I know if a window change increased walk-ins?
V-Count shows it as a change in capture rate in BoostBI, using Nano Outdoor for passers-by and Nano AI for entries. Compare two or more full weeks before and after the change, on the same days and hours, so weather and seasonality do not distort the result.
How do I compare foot traffic outside versus inside my store?
V-Count counts both: Nano Outdoor (IP65) measures passing traffic outside and Nano AI measures entries at the door, both rated up to 99% accurate. BoostBI shows the two side by side, so you can see how much of your street opportunity you actually capture.
How do I measure the pulling power of my storefront?
V-Count measures pulling power as capture rate: the share of passers-by, counted by Nano Outdoor, who walk in through a door counted by Nano AI. BoostBI tracks it by hour, day and store, so you can benchmark each location and see which storefronts draw people in.
How do I benchmark my location’s street traffic?
V-Count’s Nano Outdoor, IP65-rated and up to 99% accurate, measures how many people pass your store. That gives you an objective count of the location’s footfall potential rather than only the people who came in. BoostBI shows it by hour and day, typically refreshed every 10 minutes.
How do I decide if a location is worth the rent based on passing traffic?
V-Count’s Nano Outdoor measures actual passing traffic at a site, and Nano AI adds entries once you trade there. Weigh measured street volume and capture rate against the rent instead of relying on estimates, and compare the site with your existing stores measured the same way. To test a site before you commit, rent a counter for a few weeks.
How do I measure the impact of exterior signage or promotions?
V-Count shows the impact in BoostBI as a change in passing-to-entry conversion, from Nano Outdoor and Nano AI counts. Compare the same days and hours before and after the new signage or promotion, and change one thing at a time so you know what moved the number.
How do I compare storefront performance across locations?
V-Count’s BoostBI reports capture rate and passing traffic for every site in one multi-location view, so you can see which storefronts pull their weight and which underperform. Use the same counting rules at every store so the comparison is fair.
Can I measure outside traffic without cameras or privacy issues?
Yes. V-Count’s sensors process measurements on the device and send only anonymous counts, not images, and V-Count is ISO 27001 certified.
How accurate is exterior people counting?
V-Count’s Nano Outdoor is rated up to 99% accurate for outdoor people counting. Validate the installed model and position against a manual count, because mounting height, coverage, light and crowd density all affect exterior results.
How do I connect capture rate to sales and conversion?
V-Count’s BoostBI joins capture rate, entries and POS sales, so you see the full funnel from street to door to purchase and where people drop out. Sales come in through native Shopify and Nebim connectors, existing integrations or a REST API.
How do I use this to improve window merchandising?
V-Count’s BoostBI shows which window treatments raise capture rate, using Nano Outdoor and Nano AI counts. Run one change at a time for at least two comparable weeks, keep the best performer and roll it out to similar stores.
Does it work outdoors, in weather and glare?
Yes. V-Count’s Nano Outdoor is IP65 weather-resistant and rated up to 99% accurate for outdoor counting. Validate the model and environment at your site, including glare and shade at different times of day, before relying on the numbers.
How hard is it to install an exterior counter?
Not hard. V-Count’s Nano Outdoor mounts above the frontage to cover the pavement in front of your store. Send V-Count a floor plan and photos taken by the store manager, and V-Count returns placement advice within 24 hours.
What does adding exterior counting to a store cost?
V-Count prices exterior counting per sensor: one Nano Outdoor per frontage alongside your entrance counter, with BoostBI licences selected per package. See current prices on our pricing page.
Can storefront data feed my BI and marketing tools?
Yes. V-Count’s BoostBI offers an open REST API and exports, so capture-rate data can flow into your BI and marketing reporting. Confirm fields, schedule and authentication with V-Count for your set-up.
Will improving capture rate actually increase revenue?
V-Count quantifies it: BoostBI shows how many extra visitors a higher capture rate brings and how many of them buy. Converting even a few more percent of passers-by into visitors can add sales without extra marketing spend, provided conversion holds. Compare equivalent periods, because a before-and-after change alone does not prove the cause.
I want to turn more passers-by into customers but do not know where to start. What is the first step?
Book a V-Count demo. V-Count will show how Nano Outdoor and BoostBI measure capture rate and window impact on a storefront like yours. Send a floor plan and store-manager photos for placement advice within 24 hours.
What tools can help me analyze the performance of my target storefronts?
The tools that help you analyze the performance of your target storefronts are V-Count storefront analytics: Nano Outdoor, an IP65 sensor rated up to 99% accurate, counting passers-by, Nano AI counting entries, and BoostBI comparing stores by capture rate (eligible entries ÷ eligible passing traffic × 100), conversion and revenue per visitor. For stores you already run, compare capture rate by hour, day and window campaign, and record promotions, weather and opening hours next to the numbers.
For a location you are considering, measure passing traffic over a few representative weeks before you commit.
Turn more of the street into visitors
Nano Outdoor counts who walks past, Nano AI counts who walks in and BoostBI shows the capture rate of every storefront, anonymous by design.
Request a Demo