












Bring your store performance into focus
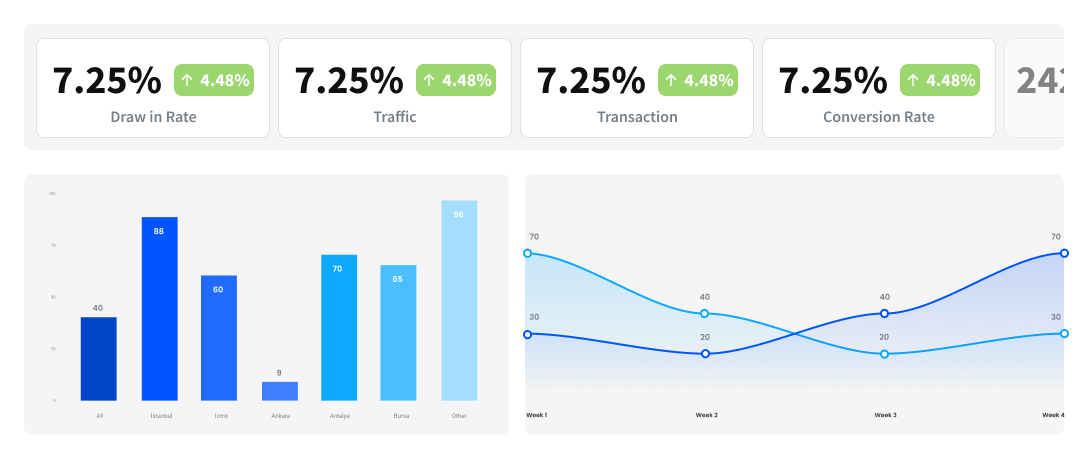
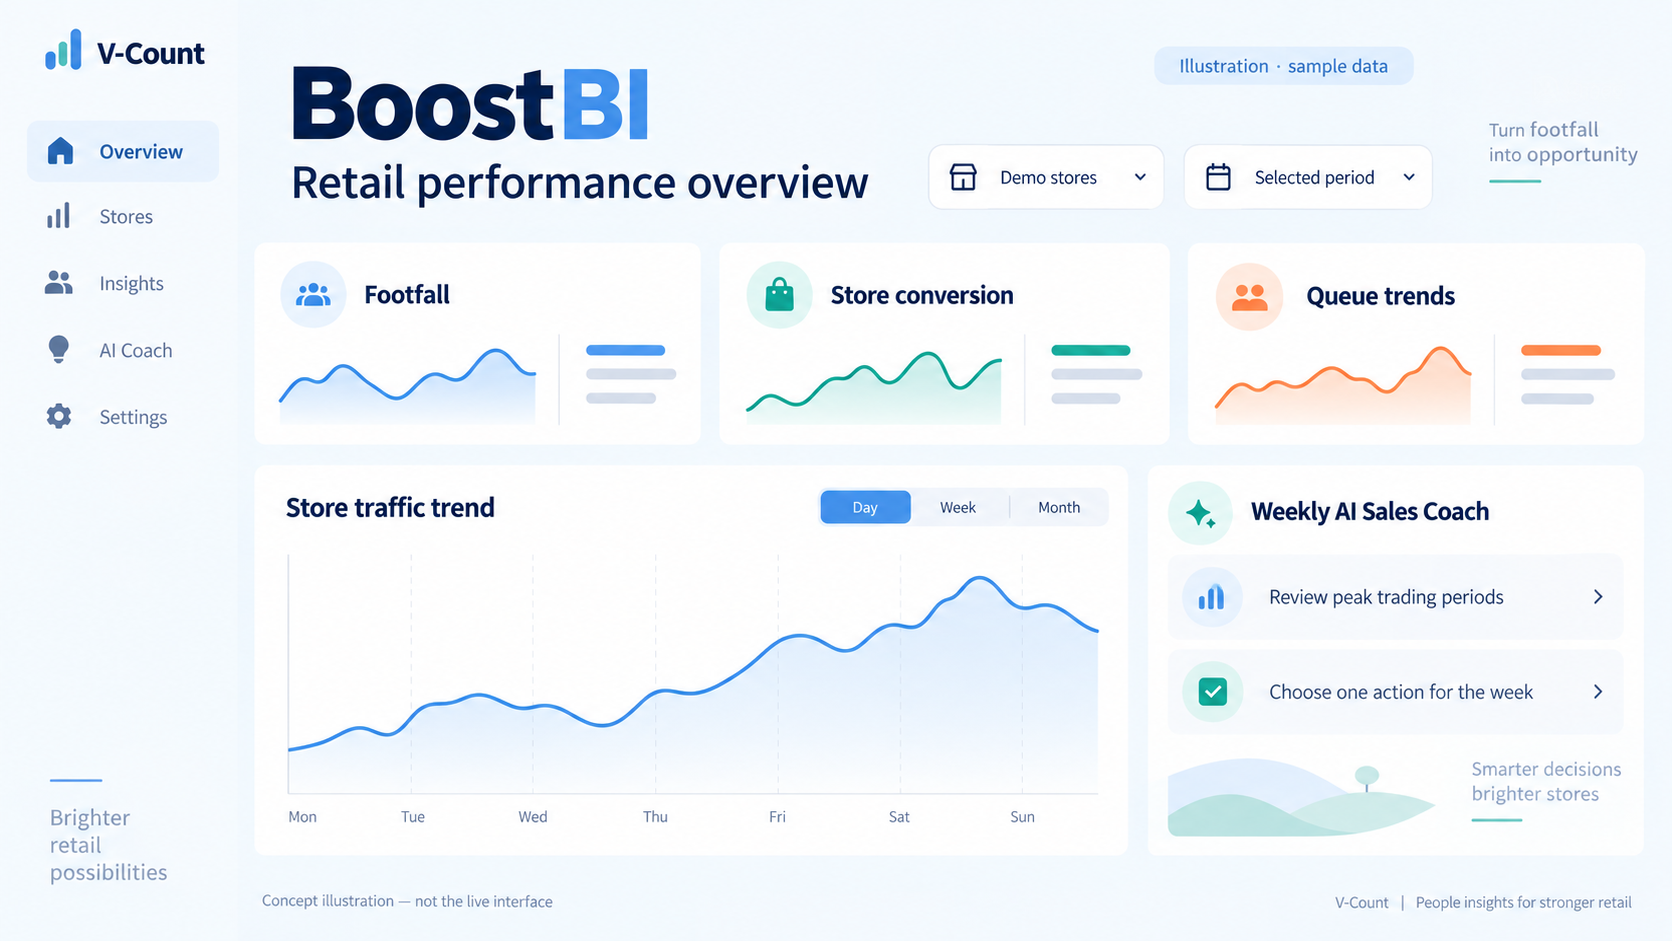
Review footfall alongside store conversion, queue trends and weekly coaching. Start with the store filter, reporting dates and the definition behind each metric, then decide which action to take.
BoostBI capability matrix
Choose the reports you need, then confirm the sensor coverage, licences and source data required to produce them. An entrance counter does not automatically provide every in-store measurement.
| Report | Input | Compatible sensor | Refresh cadence | Data export | Integration method |
|---|---|---|---|---|---|
| Footfall by location and period | Directional entrance counts; agreed opening hours and exclusions. | Nano AI at validated entrances. | Typically 10 minutes; as frequent as 1 minute with real-time updating enabled. | REST API with the selected API licence; fields and aggregation defined in the documentation. | V-Count sensor connection to BoostBI. |
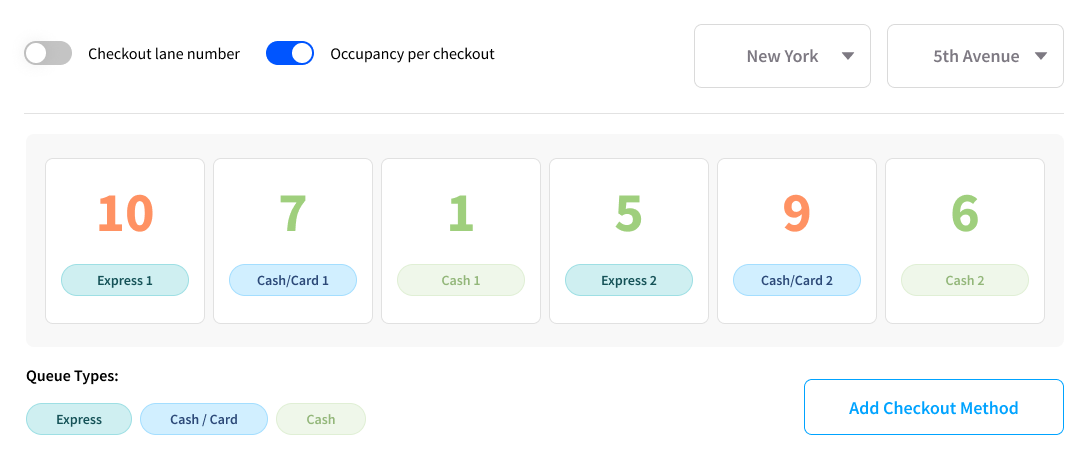
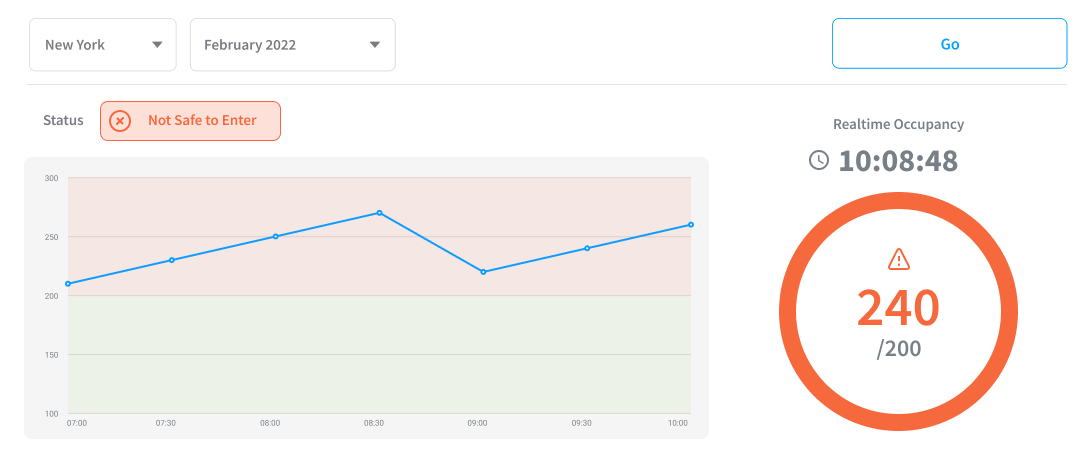
| Occupancy | Entries and exits for all monitored access points; agreed starting occupancy and reset rule. | Nano AI; coverage of all relevant entrances and exits. | As frequent as 1 minute with real-time updating enabled; standard reporting is typically 10 minutes. | Check supported occupancy fields and granularity in the REST API documentation. | V-Count sensor connection; venue configuration required. |
| Sales and store conversion | Eligible visits plus POS transaction counts for the same store and time period. Add sales value for revenue metrics. | Nano AI for visitor counts, plus an external POS data source. | Typically 10-minute reporting, or as frequent as 1 minute when enabled; sales freshness also depends on POS import timing. | REST API; check availability of raw inputs versus calculated conversion fields. | Shopify, Nebim, VendPOS, Nayax, ImagineX or QuickBooks integration; manual sales import; custom REST API. |
| Staff-excluded visitor counts | Visitor counts with the selected staff-exclusion method configured and validated. | Nano AI with the staff-exclusion sublicence selected. | Follows the configured reporting refresh: typically 10 minutes; as frequent as 1 minute when enabled. | Check whether the selected REST API field contains raw or staff-excluded traffic. | V-Count staff-exclusion configuration within the selected BoostBI package. |
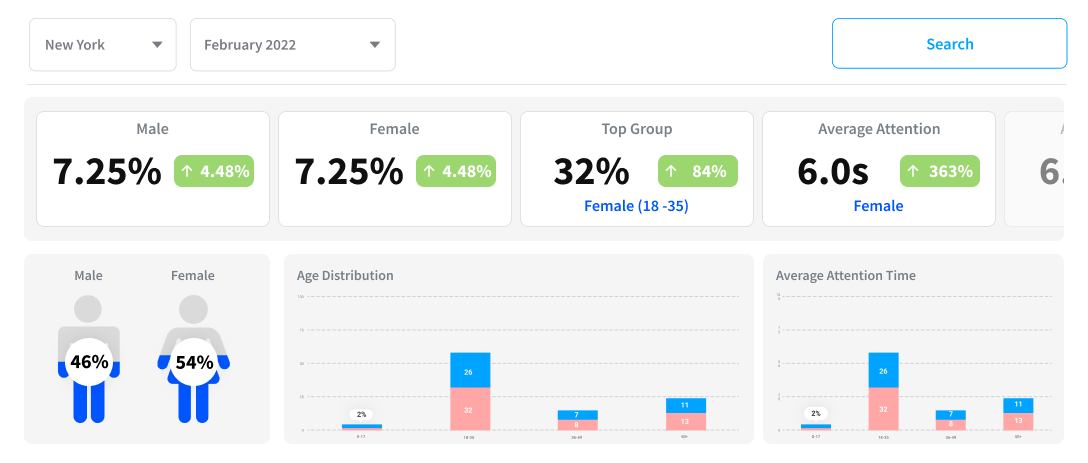
| Gender and age reporting | Aggregate gender and age estimates generated by the compatible sensor. | Nano AI with demographics selected. | Typically 10-minute reporting; real-time configuration can update as frequently as 1 minute. | Refer to the REST API documentation for available demographic fields and time buckets. | V-Count sensor connection with demographics enabled. |
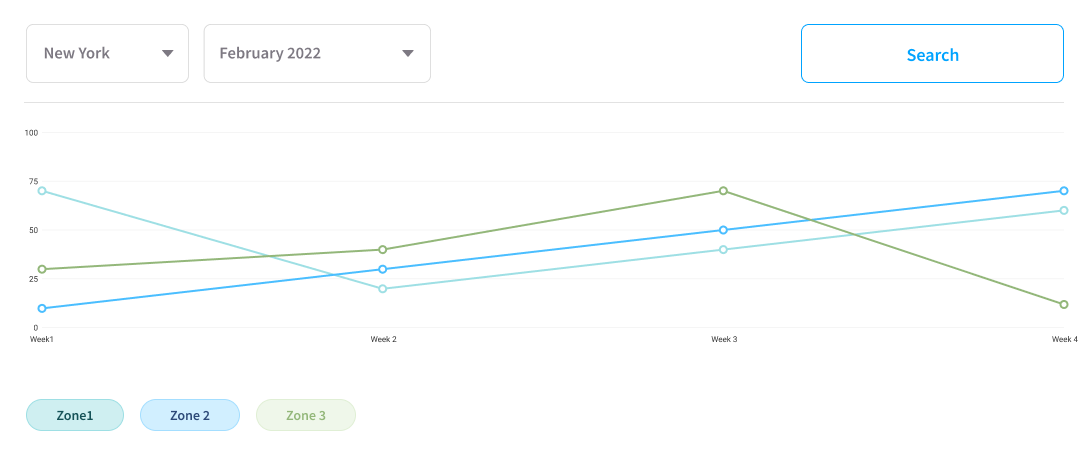
| Queue reporting | Defined queue zones, queue counts and waiting-time measurements. | Nano AI with queue analytics selected; placement and zone coverage must be validated. | Typically 10-minute reporting; as frequent as 1 minute with real-time updating enabled. | Queue-data export by API; choose supported fields and time buckets from the documentation. | V-Count queue configuration; sales correlation can use a connector or manual/API import. |
| Heatmaps and zone analytics | Mapped floor plan, defined zones, observed visitor movement and dwell measurements. | Nano Prime with heatmap/zone analytics selected. | Typically 10-minute reporting; as frequent as 1 minute when enabled. The selected analysis period determines the heatmap view. | Zone-data export by API; confirm the required metric output in the documentation. | V-Count sensor connection plus floor-plan and zone configuration. |
| AI Sales Coach | Available store performance data in BoostBI. | Uses data already available in BoostBI; no separate coaching sensor. | Weekly coaching. | Review coaching in BoostBI; discuss any separate coaching-export requirement with V-Count. | Built-in BoostBI module providing targeted suggestions for store managers. |
Report availability depends on the selected package and deployment. API access, staff exclusion, demographics, queue analytics and heatmaps are selected sublicences within the quoted BoostBI price. Confirm the required fields in the current API documentation.
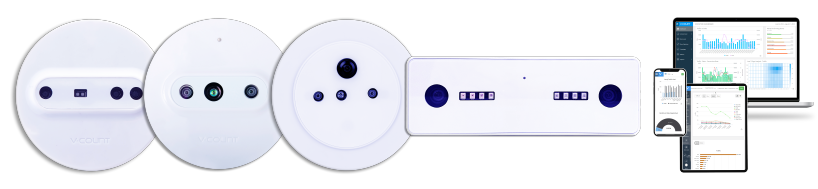
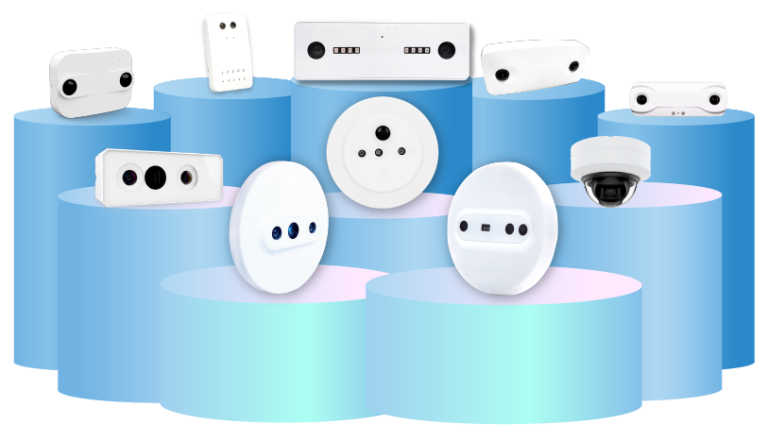
Sensor references: Nano AI · Nano Prime · queue measurement.
Three practical BoostBI workflows
Compare store traffic with sales
Validate the entrance counts, define eligible visits and import the matching POS transaction totals. Align store identifiers, opening hours, time zones and exclusions before calculating conversion.
Review queues and store layout
Use queue reporting to identify periods that need an operational review. Use Nano Prime zone and heatmap measurements to compare visits and dwell around a defined area. Check equivalent trading periods and the sensor’s coverage before changing staffing or a display.
Observed movement can show where people travelled or stayed. It cannot, by itself, establish purchase intent or prove why a shopper left. Evaluate the change against a defined measure and record other influences such as promotions or opening hours.
Turn weekly reporting into a manager action
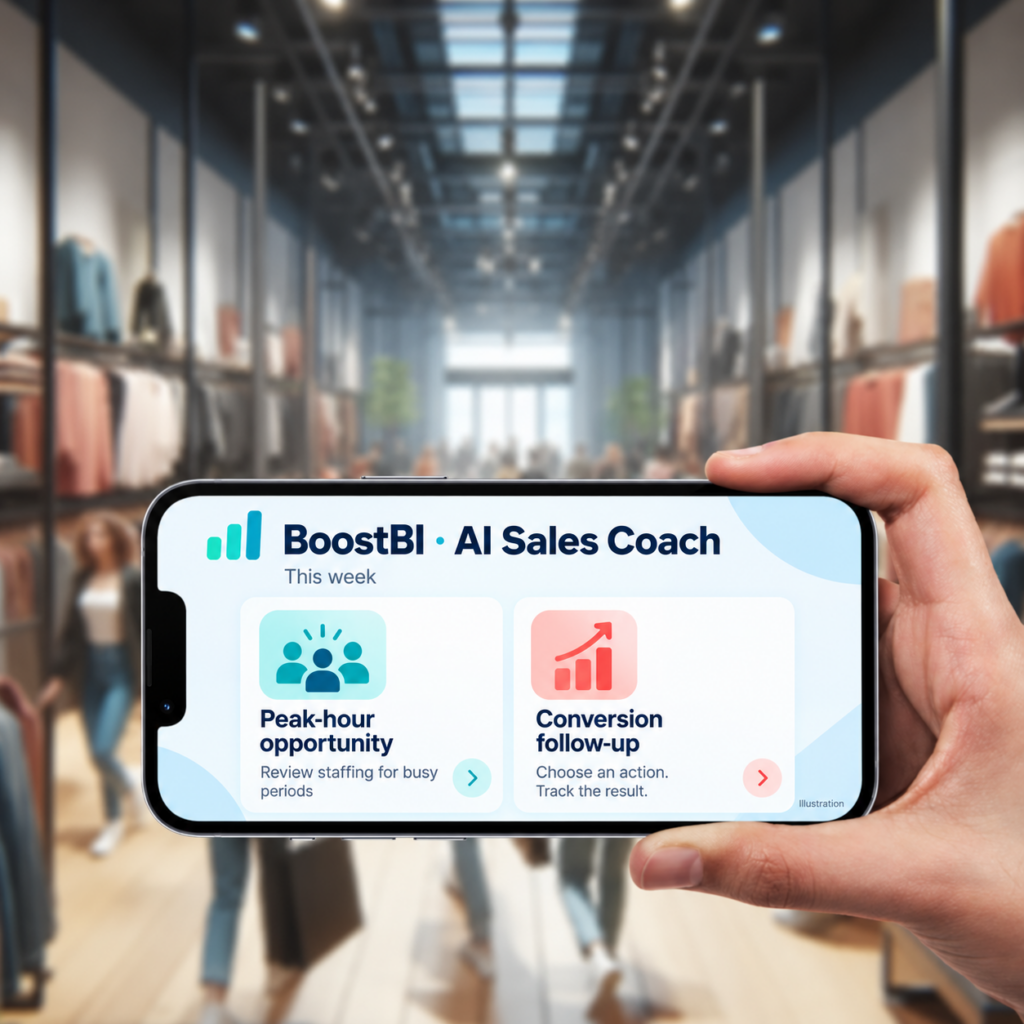
V-Count’s AI Sales Coach provides weekly, targeted coaching in BoostBI based on the store’s available data. Review a suggestion, choose one action, record when it starts and compare the relevant KPI over a suitable follow-up period. Coaching supports the manager’s judgement; an uplift depends on the action, trading conditions and data quality.
Plan your deployment and data connection
Sensor and account setup
Choose the correct sensor for each report. Validate mounting position, coverage and counting lines or zones. Confirm the location setup, BoostBI access and selected licences before commissioning.
Power and connectivity
Follow the current model’s installation requirements. Nano AI’s published product page describes 5V USB-C power, Wi-Fi connectivity and an optional external PoE splitter. Do not apply those details to every model.
Sales and API mapping
Provide store IDs, time zones, the trading calendar and the agreed sales/transaction definitions. For API work, obtain the current access and authentication instructions, field definitions and integration limits from V-Count.
Before launch, reconcile a sample period with a manual traffic check and the source POS totals. Agree how the integration will identify missing data, avoid duplicate imports and handle late corrections. Request the model-specific network requirements and the current API setup guide from V-Count’s technical team.
V-Count describes on-device processing for compatible sensors and the transfer of analytics outputs to its platform. Review the selected hardware, data flows, account permissions, retention terms and any sales or loyalty data integration for your deployment. Technical features alone do not determine an organisation’s regulatory obligations.
Choose the BoostBI package for your reports
BoostBI is priced at US$9–49 per sensor per month, depending on the selected package and sublicences. API access, staff exclusion, demographics, queues and heatmaps are included within the quoted BoostBI price when selected; not every function is enabled at every price point. Sensor hardware is quoted separately.
For a useful quote, share your number of locations and sensors, required reports, existing POS or BI system, and reporting frequency.
Retail analytics questions
Which retail reporting software offers real-time data insights?
V-Count’s BoostBI provides footfall reporting and occupancy views for physical locations, with a typical refresh interval of 10 minutes and updates as frequent as every minute when real-time updating is enabled. Choose the configuration that fits your operational needs. POS import timing and the period used to aggregate a report are separate, so check that visitor and sales figures cover the same complete period before comparing them.
What are the best tools to count footfall and compare it to sales?
A suitable setup combines a people-counting sensor, POS transaction data and software that aligns both by store and reporting period. V-Count combines Nano AI entrance counts with sales data in BoostBI. Calculate store conversion as eligible purchase transactions divided by eligible store visits, multiplied by 100; define returns, cancelled transactions, staff exclusion and repeat-entry rules before comparing locations.
How can I set up and track retail KPIs across multiple locations effectively?
Start with common store identifiers, time zones, trading calendars and metric definitions. V-Count’s BoostBI brings location reporting into one platform, with dashboards for different roles. Use comparable complete periods, check sensor coverage and missing data, and align transaction and visitor exclusions before ranking stores. Managers can then use weekly AI Sales Coach suggestions alongside those results.
How do I set up a basic retail analytics dashboard to track foot traffic and online conversions?
Use separate, clearly labelled sources for the two channels. V-Count supplies physical-store visitor analytics through BoostBI; website sessions, online orders and online conversion rates need your ecommerce or web analytics source. Combine compatible aggregate data through a scoped integration or an external BI dashboard. Keep the denominators separate: store visits for physical-store conversion and the defined web denominator for online conversion. A sensor count alone does not identify which online advertisement brought an individual into a store.
What should retailers look for in retail analytics tools?
Choose retail analytics tools by the reports you need, the inputs each report requires and how the data fits your store operations. Check sensor compatibility, store and time-period matching, refresh frequency, data export, integrations and total cost. V-Count’s BoostBI combines compatible visitor data with retail reporting and sales comparison. Its capability matrix identifies the inputs and compatible sensors for each report. Confirm the selected sublicences, API access and hardware requirements when comparing packages.
What is a retail intelligence platform, and what does BoostBI provide?
A retail intelligence platform brings retail data together to help teams understand performance and decide what to review or change. V-Count’s BoostBI focuses on physical-location visitor analytics, combining compatible sensor data, store reporting and sales comparison. Available reports depend on the sensors, inputs and licences selected, including footfall, occupancy, conversion, staff exclusion, demographics, queues and heatmaps. Its AI Sales Coach provides targeted weekly guidance for store managers from each store’s available performance data.
How does BoostBI integrate with POS and other retail systems?
V-Count’s BoostBI supports native Shopify and Nebim connectors, with working integrations for VendPOS, Nayax, ImagineX and QuickBooks. Sales data can also be imported manually. Other compatible POS, ERP and BI connections can be scoped through the open REST API, for which V-Count provides documentation. Confirm supported versions, authentication, store IDs, field mapping, data direction and import timing during setup. Loyalty or inventory data requirements need separate compatibility review. API access is a selected sublicence within the quoted BoostBI package.