V-Count Editorial · Updated 18 September 2026 · Queue Analytics
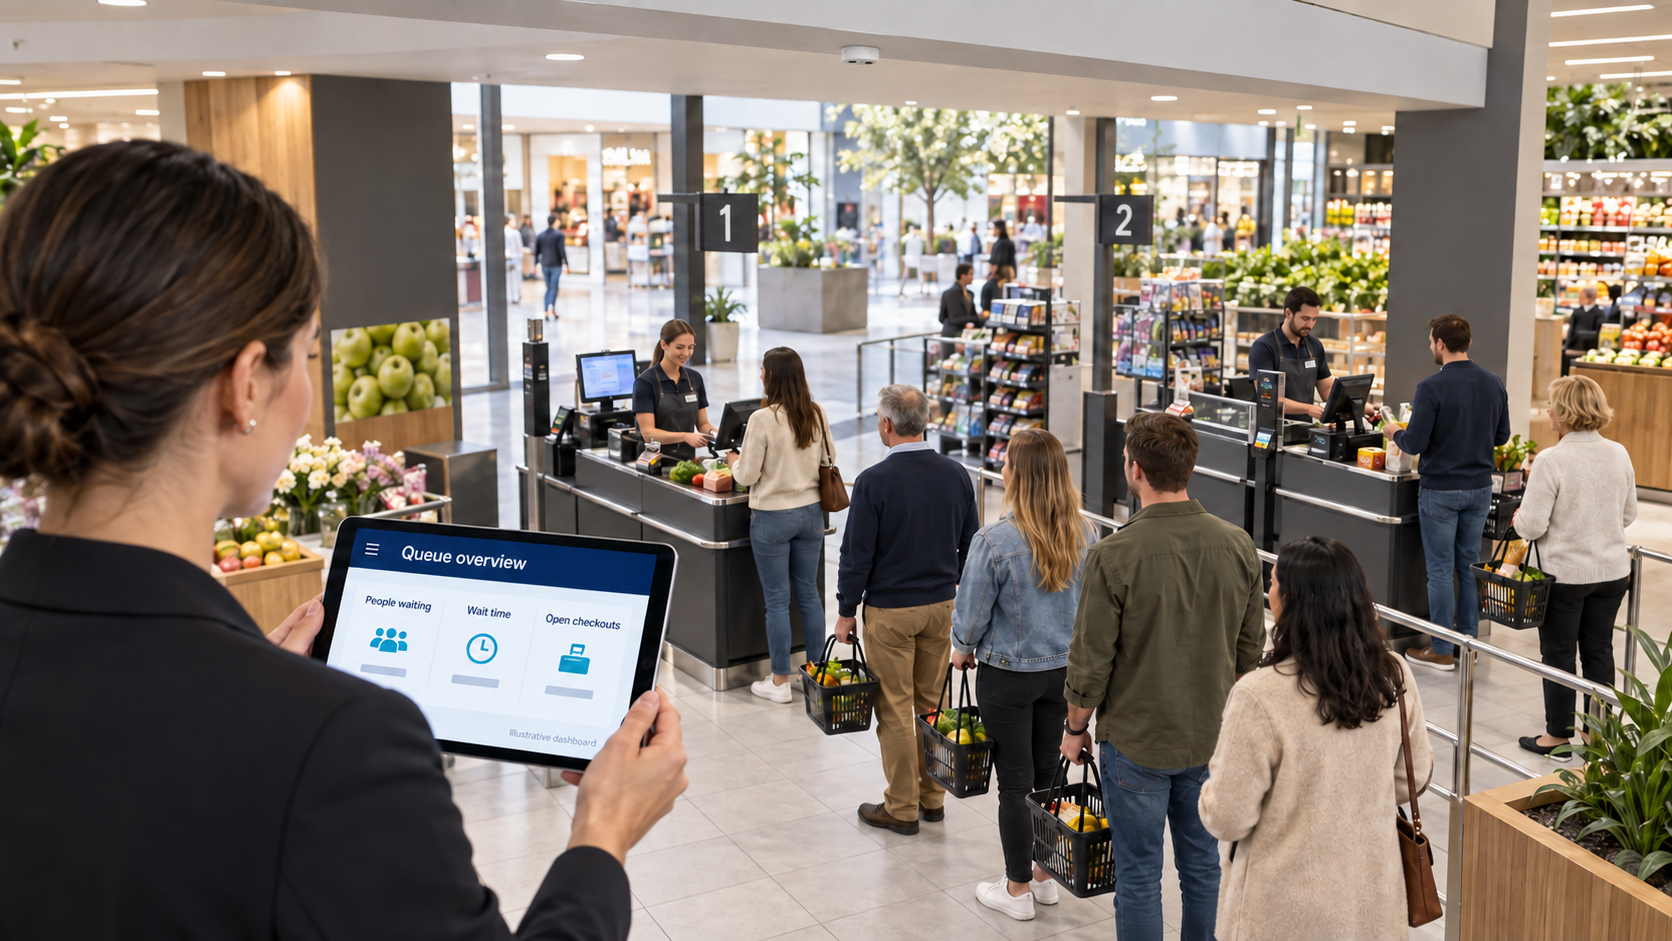
Queue management analytics measures how a queue forms, how long people wait and what happens before service. The best system for a retail site is one that can observe its actual queue layout, report clearly defined events and get useful information to staff in time to act.
Comparing options? Our queue management system buyer’s guide explains how sensor-based queue measurement and ticket systems differ, and what each one costs.
Start by separating three outcomes: balking means deciding not to join; abandonment means joining and leaving before service; a completed purchase is confirmed by transaction data. Treating all departures as lost sales makes the report misleading and the staffing business case harder to trust.
Event definitions · Six metrics · Five approaches · Response time · Worked example · Buyer checklist · FAQs
Balking, abandonment and purchases: define the events first
Balking: a shopper considers a queue and decides not to join. Someone passing the checkout or entering an approach area is not automatically a balking customer. A sensor can observe movement; the reason for not joining generally needs observation, a survey or another validated source.
Abandonment after joining: a shopper joins the defined queue, then leaves before reaching service. Queue switching, returning to a shelf, accompanying someone else and temporarily stepping aside need agreed handling rules. An exit from a drawn zone is a candidate departure event until those rules have been validated.
Service and purchase: reaching a counter is not the same as paying. A customer may ask a question, return an item or collect an existing order. Use POS transaction data to establish completed purchases, with agreed rules for returns, cancellations and multiple people on one receipt.

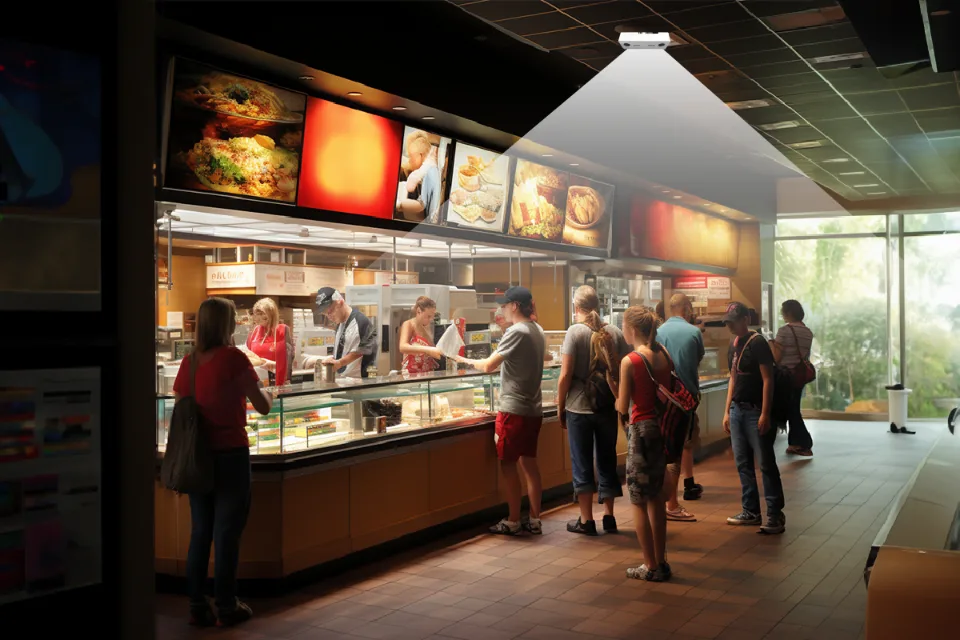
Spot queues before shoppers walk out
See queue length and waiting time live, and open another till before the line gets long.
- Live queue length
- Waiting-time alerts
- Staff by hour
The six operational metrics to report
Use the same queue boundaries, reporting period and inclusion rules across every comparison. Agree whether the unit is an individual, a shopping party or a transaction; do not silently mix them.
| Metric | Definition and calculation | Operational use |
|---|---|---|
| Queue length | People currently waiting in the configured queue, excluding the service area. Zone occupancy requires rules to exclude passersby and staff. | Shows current pressure at a lane or service desk. |
| Wait time | Service-start time minus queue-join time for a resolved journey. Report served waits separately from time spent waiting by abandoners. | Reveals when and where delays occur. |
| Service time | Service-end time minus service-start time. Counter-zone dwell is a proxy unless its boundaries reliably match the service events. | Helps separate slow processing from insufficient capacity. |
| Abandonment rate | Validated departures before service ÷ queue joins × 100, using the same tracked cohort and follow-up window. | Flags a service issue to investigate, not a monetary loss by itself. |
| Service level | Served customers whose wait met the agreed target ÷ served customers with a valid measured wait × 100. Report abandonment alongside it. | Shows whether the served population met your standard. |
| Peak queue length | Highest observed waiting count during the reporting period. Capture frequency affects whether brief peaks are visible. | Supports lane-opening plans and break scheduling. |
Show sample size, missing records and unresolved journeys alongside percentages. A report covering only customers who were served can look healthy while others leave. Where event-level waits are available, include the median and a high percentile as well as the average.
Five queue-measurement approaches compared
Different tools record different parts of the journey. Evaluate each against your required events and site conditions rather than assuming that one technology label guarantees accuracy.
| Approach | Useful measurements | What to verify |
|---|---|---|
| Dedicated overhead sensors | Queue occupancy, movement and configured queue metrics. | Full queue and service-point coverage, journey continuity, staff rules, exits, lane switching and peak-period performance. |
| Ticket or virtual-queue systems | Join/check-in, call and service timestamps for registered customers when those events are logged. | No-shows, cancellations and unregistered visitors. A missed call alone does not establish why someone left. |
| Analytics on existing cameras | Queue zones and movement where camera views and software support them. | Camera angle, lighting, occlusion, tracking continuity and processing requirements at the actual site. |
| POS transaction records | Purchases, transaction timestamps and basket values. | A transaction timestamp alone does not reveal when the shopper joined or who left before service. |
| Manual observation | Sampled joins, service starts, departures and context. | Clear definitions, synchronized clocks, representative busy periods and enough samples. Useful as a pilot reference. |

What does it cost?
Sensors from US$299, paid once. BoostBI from US$9 per sensor per month.
What can a V-Count deployment actually measure?
V-Count’s queue-management solution lists queue counts, average waiting time and abandonment reporting, with checkout-occupancy email alerts and API data exchange.
A doorway counter does not automatically observe the checkout. Survey the whole waiting area, service points and likely overflow routes. V-Count recommends defined straight-line queue areas; zigzags, parallel lanes and queue switching need a site-specific coverage and validation plan. The number of sensors follows the required coverage.
Record which outputs are directly observed, estimated, or unavailable. Ask what data is processed, retained and exported, and agree access and retention settings for the deployment.
Match the setup to the retail format
Supermarkets: separate each staffed lane from self-checkout and test trolleys, companions and lane switching. Quick-service restaurants: distinguish ordering, payment and collection; an order-collection crowd is not necessarily an ordering queue.
Fashion stores: cover a queue that can form quickly around a shared till and blend into browsing. Banks, telecom branches and service desks: reconcile ticketed customers, appointments and walk-ins. Compare service types separately when their typical handling times differ.
Response latency: measure the time until staff can act
Dashboard refresh, alert delivery and operational response are different timings. The current BoostBI platform page states that reporting typically refreshes every 10 minutes, or as frequently as every minute with real-time updating enabled. Those intervals do not guarantee an instant queue alert or an opened till.
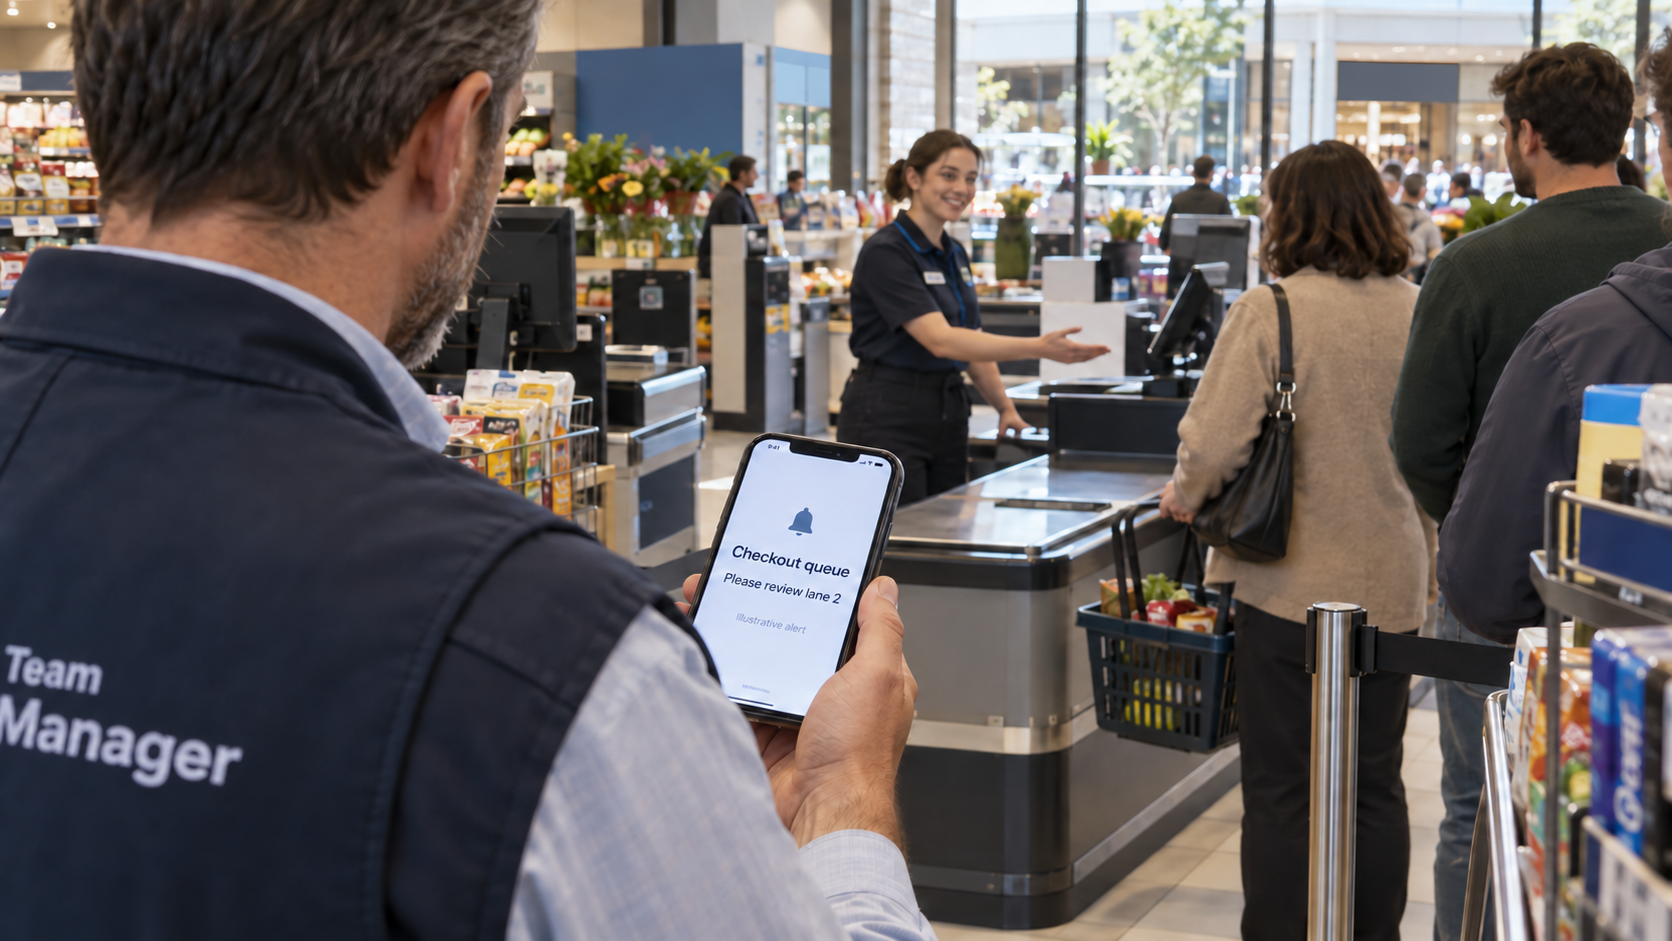
Test the complete sequence at your site: threshold crossed, event processed, notification delivered, manager acknowledges, extra service capacity becomes available. Record each timestamp.
Example: a threshold is crossed at 14:02:00, the notification arrives at 14:03:00 and another till opens at 14:05:00. The observed end-to-end response is three minutes: one minute to notify and two to act. These are example timings, not a V-Count performance commitment. Set the trigger early enough for your measured response time.
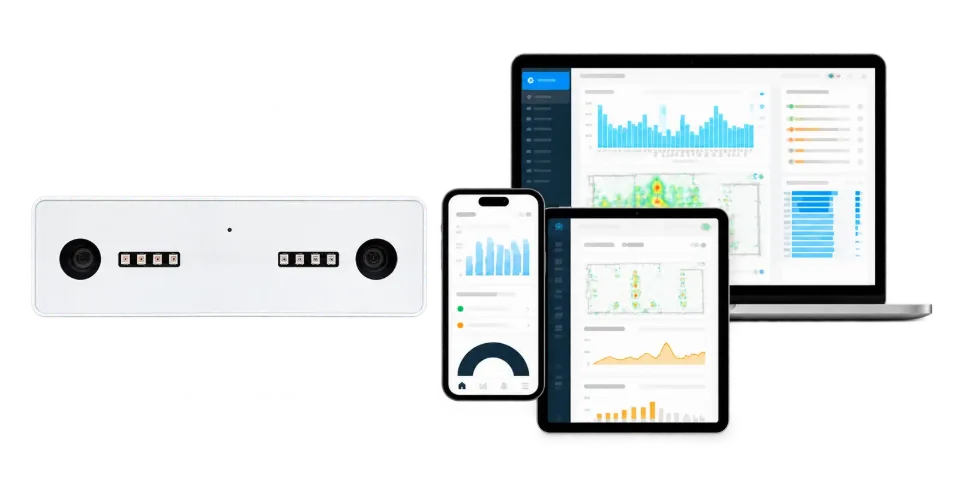
Count every visitor with up to 99% accuracy
Nano AI is a 3D people counting sensor. It counts entries and exits, can exclude staff and works in total darkness.
- Up to 99% accurate
- Staff exclusion
- Works at 0 lux
An operational example without overstating lost sales
Example pilot: start with an empty queue and observe 100 people who join during a defined period. Follow all 100 until they are served or leave. Suppose 90 reach service and 10 leave before service, with no unresolved journeys. The cohort abandonment rate is 10 ÷ 100 = 10%.
Suppose 72 of the 90 served people wait no more than the pilot’s three-minute target. Service level among served customers is 72 ÷ 90 = 80%. Report the 10 abandonments next to that figure. People who considered the queue but never joined are outside the denominator and must be studied separately.
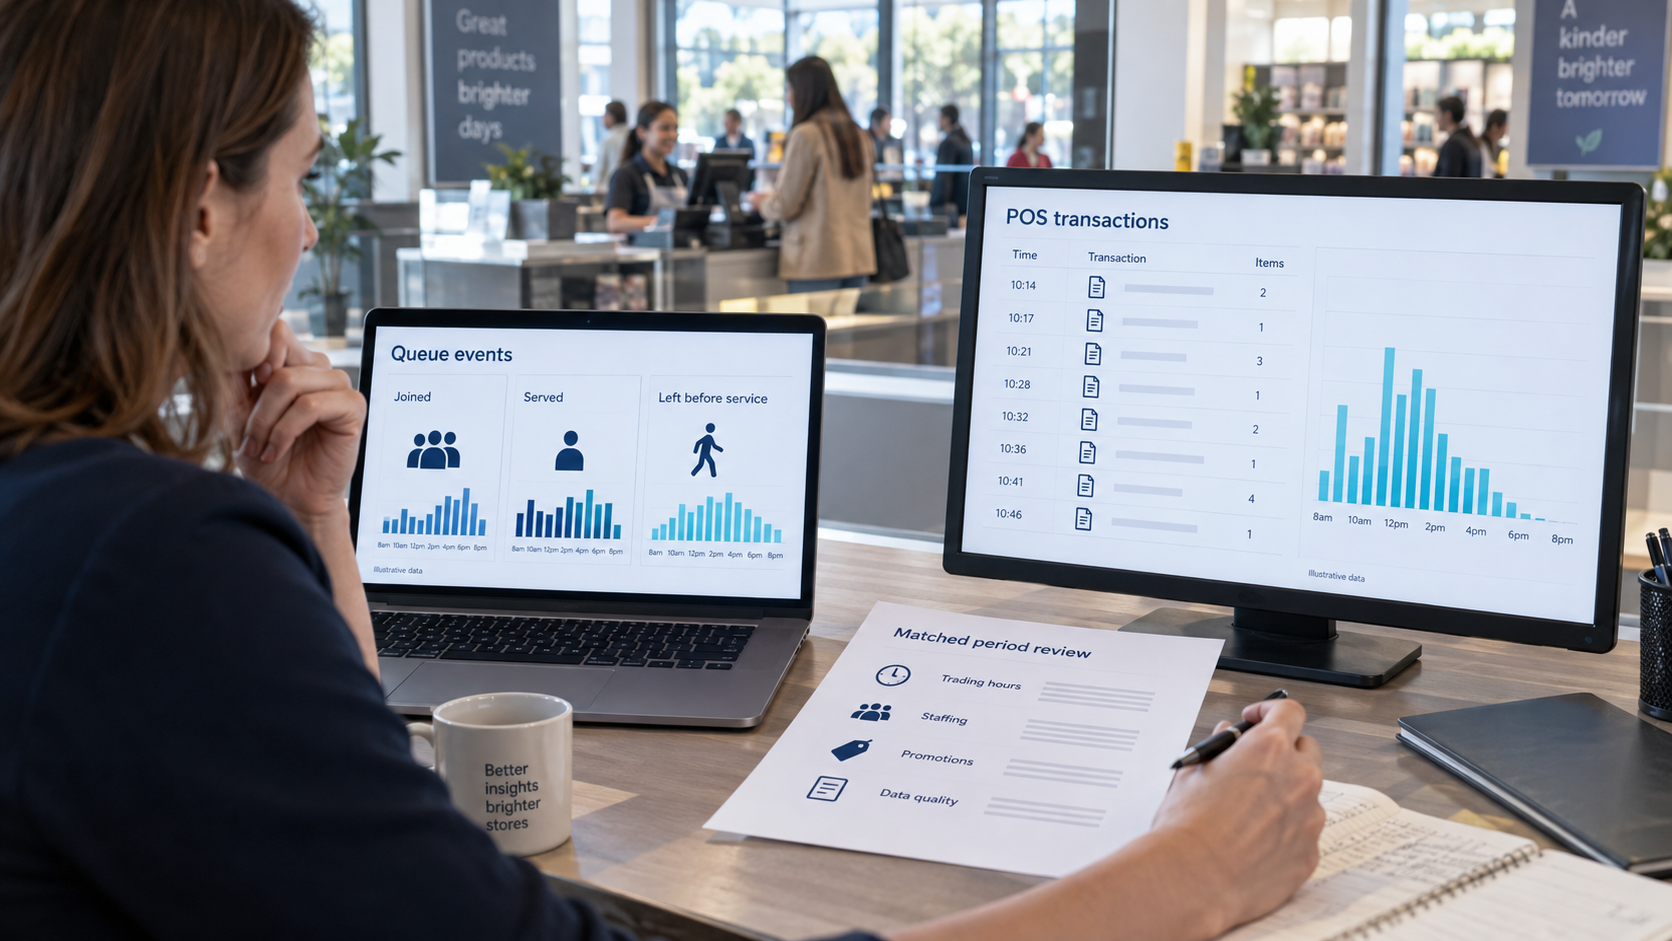
Now assume a matched pilot period again has 100 joins but five abandonments. That is five fewer departures, not five proven extra purchases. A sensitivity scenario might assume that 40–80% of those five people would complete one incremental purchase, with a £30 basket: 5 × 40–80% × £30 = £60–£120 potential revenue.
Validate the commercial effect using comparable POS periods or a suitable control. Keep promotions, opening hours, staffing, returns and traffic mix in view. Incremental revenue is not profit; account for margin and additional labour costs before claiming a return.
Four actions that turn queue reports into better service
1. Give every alert an owner
Assign a responsible person, a backup and a practical action, such as opening a till or directing customers to a staffed service point. Check that repeated alerts are useful and that the team can acknowledge them.
2. Schedule around service demand
Compare queue pressure with staffing by hour and day. Customers may reach checkout some time after entering the store. Plan breaks and cover around measured checkout demand rather than matching the entrance peak mechanically.
3. Address the source of delay
Separate waiting from service time. Where handling is slow, investigate payment issues, returns or a process bottleneck. Where too few service points are available, test a staffing change. Give customers clear directions and realistic information while they wait.
4. Validate improvements continuously
Check busy and quiet periods, staff movements, groups and changed layouts. Review wait times, abandonment, service levels, response times and customer feedback together; one improving average can hide a deteriorating peak.
Choosing a queue analytics system: a practical pilot checklist
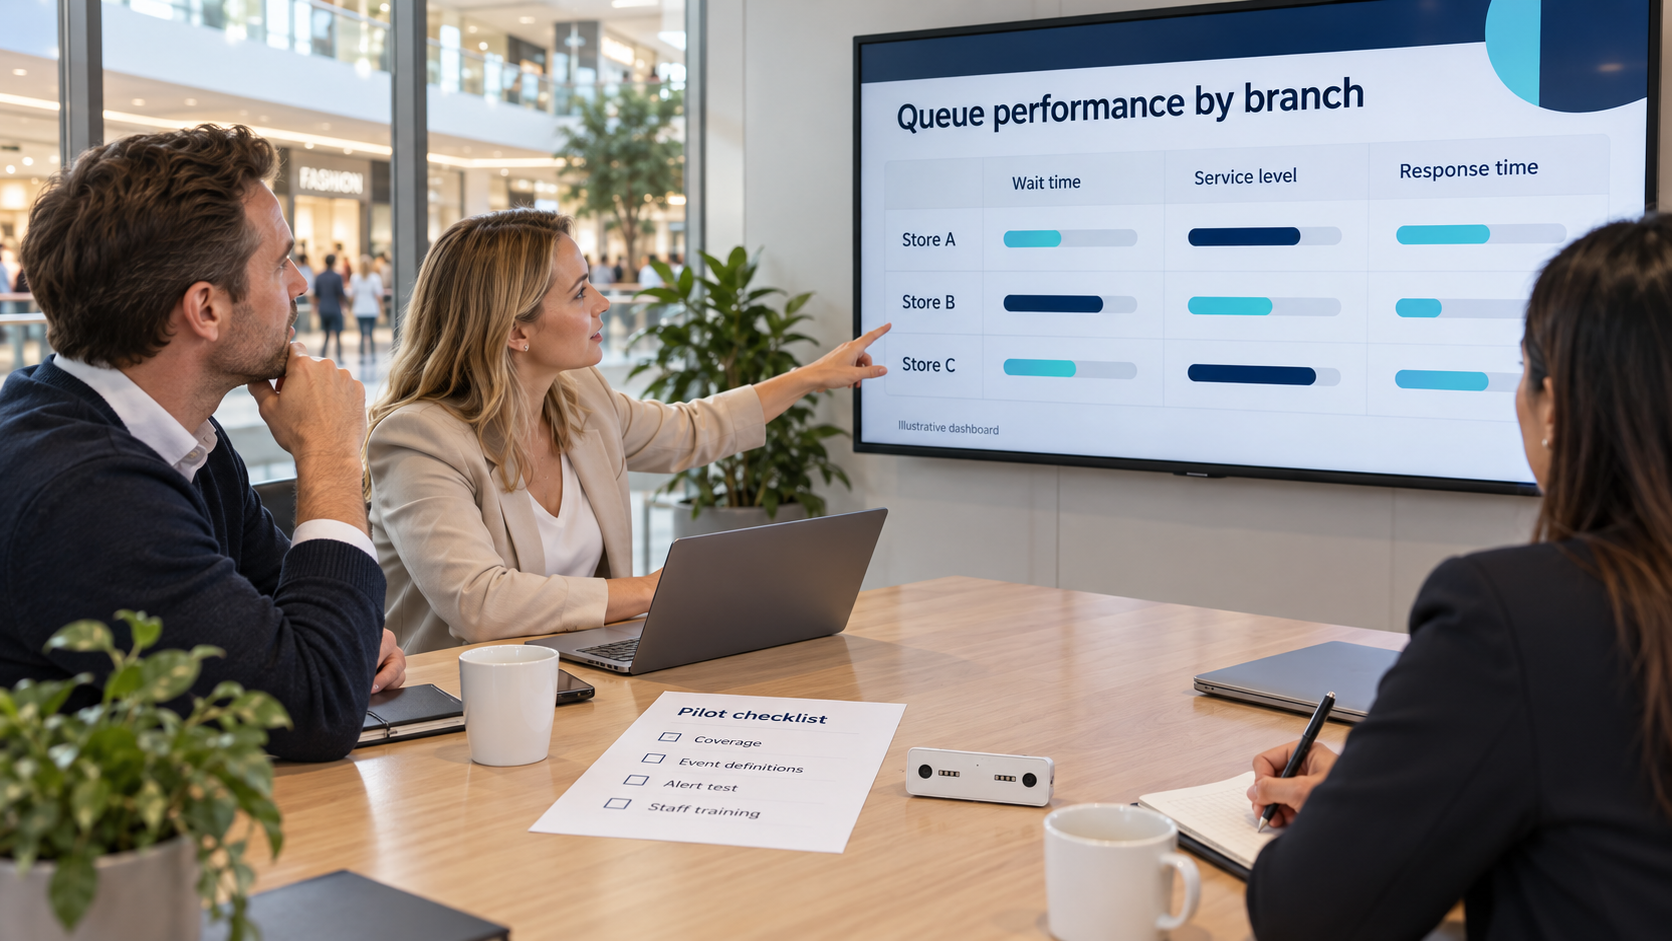
- Event coverage: which joins, service events and departures can the proposed setup resolve?
- Site design: are queue boundaries, overflow, staff routes, mounting, power and connectivity mapped?
- Latency: what is the measured time from a threshold crossing to delivery and staff action?
- Reporting: request a sample export with timestamps, timezone, metric definitions, missing-data indicators and required granularity.
- Integration: confirm which POS or workforce connections are available and what needs custom API work.
- Commercial scope: include sensors, installation, configuration, software, support and any recurring integration costs.
- Multi-branch rollout: use common definitions and acceptance checks, while allowing thresholds and layouts to reflect each format.
Begin with a representative checkout area, agree the evidence needed for acceptance and scale after the pilot demonstrates useful measurements and a workable staff response.
Not sure where the sensors go?
Send a floor plan and a few photos taken by your store manager. We recommend sensor placement within 24 hours.
Queue management FAQs
How does a queue management system improve customer flow and reduce wait times?
V-Count queue analytics helps teams see queue pressure and decide when to open a till, redirect customers or adjust staffing. With suitable sensor coverage and selected BoostBI features, managers can review waiting patterns and departures to target service improvements. Agree who responds to each alert, then compare waits and service levels before and after the action. V-Count provides the measurement foundation for a more responsive checkout operation.
How quickly does queue and visitor reporting refresh?
V-Count BoostBI provides supported queue and visitor reporting, helping retail managers spot service pressure and review operational changes. Its published refresh cadence is typically 10 minutes, or as frequent as one minute with real-time updating enabled. Test notification delivery and staff response as well as dashboard freshness.
What are the best practices for implementing a queue management system in a multi-branch business?
Start with a representative branch pilot, for example with V-Count sensors and BoostBI, then standardise event definitions, reporting periods and acceptance tests. V-Count can help scope sensor coverage and the BoostBI configuration across your branch formats, giving regional teams a consistent reporting foundation. Assign alert owners, train staff and validate each local layout before expanding. To plan a rollout around your queues and service targets, request a V-Count demo.
Which features should retailers compare for footfall, dwell time and queue management?
Compare coverage, footfall definitions, dwell measurement, staff exclusion, queue metrics, reporting cadence and data access, for example by testing V-Count’s Nano sensors and BoostBI against your current setup. V-Count lets you assess these requirements as a coordinated setup: Nano AI for suitable entrance and queue applications, Nano Prime for configured zones, and BoostBI for reporting. Explore V-Count queue analytics when checkout performance is the priority.
What should a queue-management case study show about wait times and efficiency?
A useful study shows the baseline, queue layout, measured waits, staffing intervention and follow-up results, measured with a tool such as V-Count’s BoostBI. When considering V-Count, ask for relevant evidence and use a V-Count queue analytics pilot to establish your own baseline and improvement targets.
This gives your team a practical way to assess service benefits. Separate waiting from service time, report abandonment, and require matching transaction evidence for any additional-sales claim.
Can queue analytics prove that every departing shopper was a lost sale?
No, a departure alone does not prove a lost sale. V-Count helps retailers build a stronger commercial assessment by reviewing supported queue measurements alongside sales data in V-Count BoostBI, with the appropriate integration or import. First distinguish queue abandonment from lane switching and other movement; then compare matched periods and stated assumptions. This gives managers a more defensible basis for deciding where extra checkout capacity may help.
Build a queue response your team can use
Share your queue layout, service points and reporting goals. V-Count can help define the coverage, pilot and operational response.
Request a demoSee it working in a store like yours
Book a free demo and see live traffic, conversion and staffing data. Trusted by 600+ companies in 130+ countries.