
Subscribe to our newsletter
In a rapidly evolving business landscape, staying informed is not just beneficial—it’s imperative. Subscribe to ensure you remain at the forefront of visitor analytics industry knowledge.

Book a demo now to maximize your business potential:
Data from our in-store retail analytics solution allows businesses to understand visitors’ dwell time, enhance customer engagement, identify the reasons behind the successful areas’ performance, and apply this knowledge to other zones for optimal results.
Leveraging this data empowers retailers to make informed decisions that improve store layout, product placement, and staffing—ultimately driving increased sales and customer satisfaction.
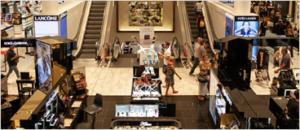


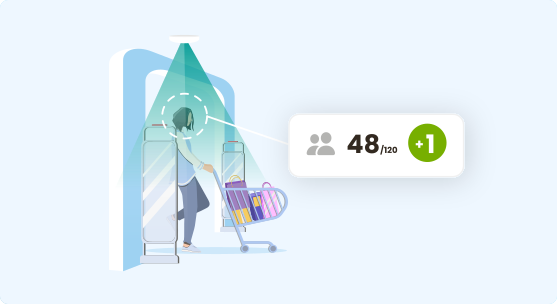
Anonymously track and manage incoming visitor traffic with digital screening. Keep a close eye on your occupancy levels to enhance the customer experience and track the performance of your staff.

In a rapidly evolving business landscape, staying informed is not just beneficial—it’s imperative. Subscribe to ensure you remain at the forefront of visitor analytics industry knowledge.
V-Count sensor is installed in specific zones to measure visitor interest by providing traffic, dwell-time, heatmap and visitor flow metrics per zone. The data is then sent to the V-Count BoostBI platform as easy-to-understand reports.
Our team of experts can provide you with personalized assistance depending on your needs. We will advise you on the suitable solutions, the right number of sensors, the suitable sensor locations or zones, and the installation and setup of the sensors and analytics platform.
Zone counting, zone dwell time, heatmap and visitor flow can be seen in detail on the dashboard screen with graph and table options.
Yes, you can import your sales data into our BoostBI dashboard manually or automatically with an API. V-Count analyzes the correlation between the sales and zone data. You can also export the data through an API and use it in your management systems.
Zone Analytics can work together with the below solutions: Zone Counting, Zone Dwell Time, Visitor Flow and Heatmap.
The number of sensors required depends on the height of the ceiling and the zones you’d like to monitor. Our team of experts will review your floor plan and the desired counting area and advise you on the estimated number of sensors required.
The number of sensors you need depends on the size of your physical store and the solutions you are looking for. You’ll be recommended by our expert teams on the number of sensors you need for premium accuracy.
Our configuration and updates are managed remotely. But in case you need on-field support, we provide a professional service to all our customers with International Technical Support Team.
We are globally available all around the world. We provide a professional service to our customers with the International Technical Support Team.
Our 3D active stereo vision technology allows counting people in complete darkness.