











Events, Exhibitions and Trade Shows

A trade show stand, an exhibition hall and a three-day festival share one measurement problem: the audience arrives in waves, the layout changes every edition, and the venue is yours for days rather than years. V-Count counts people at the gates, at hall doors and at individual stands, so organisers see gate throughput per hour, live hall occupancy against the safety limit written in the event plan, and how many of the people who walked past a booth actually stepped onto it.

Sensors mount at the entrance, connect over Wi-Fi and stream to BoostBI, so a stand team can self-install in minutes and read the numbers the same morning. And because a show runs for days rather than years, the same Nano AI and BoostBI package can be rented for the run of the event and returned afterwards.

Event visitor counter
Join the Ranks of Our Prestigious Clients

Explore the gallery showcasing our diverse range of customers. We’re proud to work with these leading brands, providing visitor analytics solutions that drive their success.

Benefits of Visitor Analytics for Events and Exhibitions

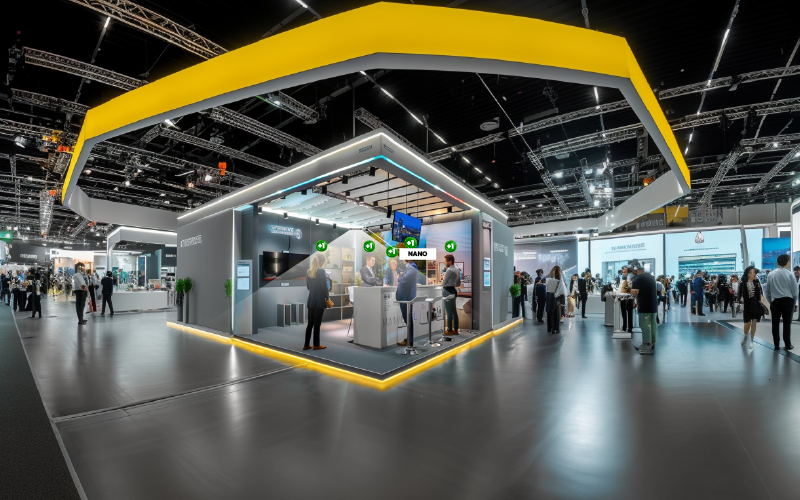
Events And Exhibitions People Counting Nano 01

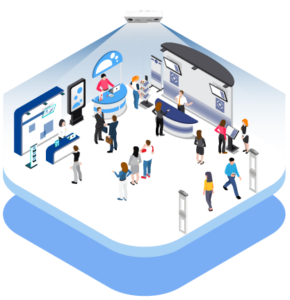
With V-Count People Counting Solution, event operators can efficiently monitor the flow of attendees at your events, exhibitons or trade shows ewith real-time people counting. Accurate data, with a precision of 99%, allows you to track the number of people entering and exiting, providing insights into visitor patterns. This information is invaluable for making prompt adjustments to enhance the overall event experience. Additionally, you can compare hourly and daily traffic to analyze trends over previous years.

It is also possible to Identify the peak footfall traffic hours of your event or exhibition to strategically manage promotions, marketing activities, and campaigns. Knowing when your venue experiences the highest foot traffic enables organizers to optimize engagement during these peak hours, maximizing the impact of your event.

Optimizing staffing levels based on real-time visitor insights, particularly during peak hours of the trade show or exhibition is another important benefit. Strategic allocation of staff resources ensures efficient crowd management and contributes to a smooth, enjoyable experience for event attendees. By tailoring staffing strategies to match dynamic visitor needs, event organizers can enhance overall visitor satisfaction, garner positive reviews, and create successful and crowded events and trade shows in the future as well.

In summary, people counting technology in the events, exhibitions and trade shows industry provides real-time tracking, identifies peak traffic hours, and enables optimized staffing. These insights empower organizers to enhance the overall visitor experience, increase engagement, and achieve greater success in their promotional efforts and boost overall revenue.
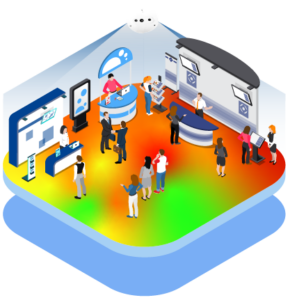
Events And Exhibitions Heatmap Zone Analytics 01

Heatmaps provide a visual representation of visitor preferences, enabling strategic decisions to maximize overall effectiveness. With Nano Prime’s state-of-the-art heatmap technology, event organizers can gain valuable insights into visitor behavior at your events, exhibitions or trade shows. You can detect popular areas, shows, exhibitions and aisles that attract the most attention from your audience. Understanding the reasons behind the success of these areas allows event organizers to replicate their performance in other sections, achieving consistent high-level engagement throughout the venue.

Also by identifying the least attractive activities that do not generate significant traffic, organizers can streamline their marketing activity efforts, focusing on the initiatives that resonate most with the audience.

Events And Exhibitions Queue Management 01With real-time insights into queue lengths and wait times, event organizers can proactively adjust service points and keep attendees informed, ensuring a smooth and enjoyable experience.

Queue Management solutions offer dynamic control over the flow of visitors, addressing peak hours and minimizing wait times. By leveraging this technology, event planners can optimize service points, allocate register staff resources efficiently, and enhance overall visitor satisfaction.

In conclusion, Queue Management solutions empower event organizers to orchestrate queues effectively, providing visitors with a streamlined and stress-free experience. By minimizing wait times and enhancing operational efficiency, these solutions contribute to increased visitor satisfaction and the overall success of the event.
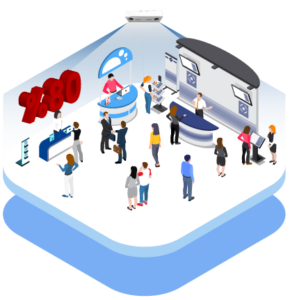
Events And Exhibitions Real Time Nano 01

By closely monitoring entries and exits to event halls or specific zones in real time, event planners gain valuable insights into crowd density patterns, allowing swift adjustments to staffing levels, energy consumption, and cleaning schedules.

One notable benefit of real-time occupancy measurement is its positive impact on energy efficiency. Through adjusting facility systems based on zone-specific occupancy rates, organizers can significantly reduce energy consumption during periods of low attendance, fostering a more sustainable and cost-effective event.

Additionally, real-time occupancy solutions streamline precise cleaning management. Organizers can strategically schedule cleaning efforts according to the occupancy of specific zones or common areas, like food courts or restrooms, ensuring a clean and inviting environment focused on areas with higher foot traffic. This approach not only enhances cleanliness but also contributes to the safety and satisfaction of attendees.

In summary, real-time occupancy solutions for events, exhibitions or trade shows offer a comprehensive approach to optimizing energy efficiency and cleaning management. These solutions empower organizers to create sustainable, cost-effective, and enjoyable experiences for attendees while maximizing the overall success of the event.
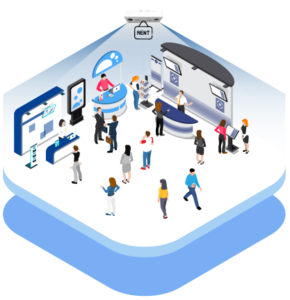
Events And Exhibitions Rent Nano 01

For your upcoming event, you have the option to rent our specialized Nano and BoostBI package at an attractive and affordable rate, only returning it when your event has concluded. Nano, a standout feature of our package, is equipped with a highly efficient Wi-Fi capability that enables a seamless, quick, and easy self-installation process.

This process is so straightforward that it can be completed in a matter of just 5 minutes, thanks to the device’s plug-and-play nature. The setup is as easy as hanging the sensor at the entrance of your booth using the clips that we provide, configuring the Wi-Fi settings, and plugging the device into a power source.

So, you might be wondering, what are the inherent benefits that come with renting our Nano and BoostBI package for your event?

Cost-Effectiveness: Renting offers businesses access to technology without a significant upfront investment. They pay only for the event duration, making it a cost-effective solution, particularly for businesses that occasionally require people counting.

Flexibility: Businesses can scale up or down depending on each event’s size and duration. They can rent the necessary number of sensors for each event, avoiding long-term commitments or investments.

No Maintenance Hassles: Renting removes the need for businesses to manage maintenance, repairs, or updates of the people counting sensors. This allows them to focus on their event without the added stress of technical support.

Access to Latest Technology: Renting enables businesses to access the most recent advancements in people counting technology without regularly buying new equipment. They can leverage cutting-edge features and precision without the commitment of ownership.

Trial Opportunity: Renting offers a low-risk chance for businesses to evaluate the effectiveness of people counting technology for their events. If they find it useful, they may consider more permanent solutions in the future. If not, they aren’t bound to a long-term investment.

People counting for events, exhibitions and trade shows: what to measure

Event measurement is not store measurement. A shopping centre counts the same doors every day for years; an exhibition builds its venue on Monday, fills it on Tuesday and takes it down on Thursday.

That short, spiky life cycle is why an event foot traffic counter has to go up quickly, be calibrated on the spot and be readable the same day. These are the numbers organisers, venue managers and exhibitors actually act on:

  • Gate throughput per hour – how many attendees pass each entrance in each hour, so you know when to open a second registration lane and when a door can drop back to one steward.
  • Live hall occupancy against the safety limit – entries minus exits per hall and per zone, compared with the capacity in your event safety plan. This is the figure a venue safety officer wants on a screen, not an estimate derived from tickets sold.
  • Unique attendance versus total visits – badge scans count registrations, sensors count bodies. Re-entry (attendees stepping out to take a call, eat or smoke) inflates raw counts, so separating visits from unique attendance keeps your published attendance figure defensible.
  • Session and hall-by-hall attendance – how many people were in the keynote theatre at 11:00, not how many registered for it.
  • Exhibitor booth traffic and capture rate – how many people walked the gangway past a stand, and how many stepped onto it. Capture rate is the most useful single number an exhibitor takes home, because it separates a weak location from a weak stand.
  • Dwell time by zone – time spent in a hall, a demo area or the catering zone, which tells you whether a zone is engaging or simply a bottleneck.
  • Queue length and wait time at registration – the first impression of the entire show, and the easiest thing to fix once you can see it.

Together these make up the exhibition visitor analytics an organiser needs in order to price next year’s floor plan, and the exhibition foot traffic counter data an exhibitor needs to justify the stand to a finance director. All of it lands in V-Count’s people counting platform as hourly and daily series you can break out by hall, by door and by stand, and export when the show closes.

Where the sensors go at an event venue

Placement follows the way people move through a show rather than the way the floor plan is drawn. In a typical exhibition or conference that means sensors over the main entrances and registration lanes, over each hall door and gangway entry, on the threshold of individual stands that want their own capture rate, over theatre and seminar room doors, and on catering, cloakroom and restroom entries where crowding builds up first.

Festivals and open-air expos add perimeter gates, shuttle drop-offs and car park entries.

Which device fits depends on the opening, the ceiling and the weather. Nano AI is the default indoor choice: a compact AI camera sensor over a standard doorway or stand entrance, connected over Wi-Fi, which is what makes same-day installation on a build-up day realistic. Nano Prime uses 3D stereo vision and suits the awkward parts of a venue – very high hall ceilings, wide multi-lane entrances, glass frontages that backlight everyone walking in, and dark theatre doors. Nano Outdoor handles gates that are exposed to rain, dust and direct sun. VCare turns the entry and exit stream into a live occupancy figure you can put on a screen at the door, and BoostBI holds the dashboards, hall-by-hall comparisons and threshold alerts behind all of it. Heatmapping of gangways and demo zones is available through heatmap and zone analytics where the layout question matters more than the door count.

Renting people counters for a single event

Most exhibitors and one-off shows do not need to own hardware. V-Count offers a people counter for rent: a Nano AI and BoostBI package taken for the run of the event and returned when it closes, which keeps sensors off the stand budget as a capital purchase.

Our people counter rental services cover the sensors, the mounting, a BoostBI workspace open for the event window, and the data export once the show ends, so the numbers survive after the hardware goes back. Arrange the rental before build-up day, install it yourself in minutes over Wi-Fi, and read the first counts as the doors open.

If you run several shows a year, or you manage a permanent venue, owning the sensors usually costs less across a season than renting each time – book a demo and we will work through which way round it falls for your calendar. What a package includes, how a short-term deployment runs and how it is quoted are set out on our people counter rental page.

Outdoor venue occupancy analytics for open-air sites

Festival fields, arena forecourts, outdoor expo areas and street markets need outdoor venue occupancy analytics that keep counting through rain, dust and low winter sun. Nano Outdoor is built for weather-exposed gates and unlit perimeters, and it reports into the same BoostBI account as the indoor halls, so a hybrid site does not end up with two separate sets of numbers.

Pair it with VCare and stewards on an open-air gate get the same live occupancy read-out as the indoor hall team, including an alert when a fenced area approaches the figure agreed with the licensing authority. For a multi-day festival that also means night-by-night comparisons of when each gate peaks, which is what changes the following year’s staffing plan.

How event and exhibition organisers use the data

  • Rostering by the hour, not by the day. Gate curves from the last edition tell you how many registration staff, stewards and scanners each hour needs. Most shows are over-staffed at 09:00 and under-staffed at the 11:00 peak until somebody counts.
  • Running capacity safely. Live occupancy per hall against the agreed limit lets you hold and release at the door before a hall is full, instead of closing it once it already is. Alerts fire at a percentage of the limit you choose.
  • Pricing the floor plan. Gangway traffic and stand capture rates turn into evidence-based pricing tiers: an aisle that carries twice the traffic is worth more per square metre, and you can show the exhibitor why.
  • Rebooking exhibitors. A per-stand traffic and dwell report handed over on the last afternoon is the strongest rebooking argument an organiser has, and it converts far better than a satisfaction survey.
  • Attributing marketing. Compare hourly arrivals with campaign sends, press days, free-ticket waves and opening times to see which pushed people through the gate rather than which filled the registration list.
  • Keeping queues short. Queue management for events uses the same sensors at registration, cloakrooms, bars and catering points to show live queue length and wait time, so a lane opens before the line reaches the door instead of after.
  • Cleaning and catering schedules. Restroom and catering counts per cleaning cycle and per service hour move staff to where the crowd actually is during the day.

Crowd analytics tools are also used defensively. V-Count is not one of the retail loss prevention companies and our sensors are not a replacement for loss prevention software or EAS gates, but exhibitors who sell stock from the stand use entrance counts, zone dwell and hourly occupancy as the denominator their security process lacks: how many people were on the stand when an item went missing, which hours leave the stand thinly covered, and whether the shrink pattern follows the crowd or the roster.

The same counts feed post-event reporting, insurance evidence and the venue’s own safety debrief.

Events and exhibitions people counting FAQ

What’s the best digital counter for tracking event attendees in real time?

The best digital counter for an event is one that reports live occupancy rather than only a daily total. V-Count’s Nano AI sensor counts entries and exits at every door and streams them to BoostBI, so hall occupancy updates continuously while the doors are open, and VCare can display that figure on a screen at the entrance.

For a single show the sensor is mounted at the gate, connected over Wi-Fi and calibrated in minutes, with no integration into the venue’s own systems. You can set a threshold so an alert fires before a hall reaches its agreed limit.

What are the best electronic counting solutions for large-scale events?

At scale the question stops being about one sensor and becomes about aggregation. A large show needs a counter on every gate and hall door, 3D stereo sensors such as Nano Prime on the wide multi-lane entrances and under high ceilings, Nano Outdoor on exposed perimeter gates, and one platform that adds them up.

BoostBI does that aggregation: total attendance, per-hall occupancy, per-hour throughput and per-stand capture rate in a single view. Badge scanning still tells you who registered; the sensors tell you how many bodies were actually inside each hall, and the two together are what a large event needs.

Which visitor counter can I rent for a trade fair?

For a single trade fair you can rent the Nano AI and BoostBI package rather than buy it. The rental covers the sensors, the mounting hardware, a BoostBI workspace for the dates of the fair and the data export afterwards, so the numbers stay with you once the hardware is returned.

Nano AI is plug-and-play over Wi-Fi, so an exhibitor or stand builder installs it during build-up without a technician. Arrange it before build-up day. If you exhibit at several fairs a year, buying normally works out cheaper across the season than renting each time.

What does foot traffic mean, and how is it analysed? 人流含義與分析

Foot traffic is the number of people who physically pass a point – a gate, a hall door, a stand threshold – over a period of time, counted as entries and exits rather than estimated from tickets or badges. Analysing it means turning that raw stream into decisions: hourly curves that show when the peak really falls, occupancy (entries minus exits) that shows how full a hall is right now, dwell time that shows how long people stay in a zone, and capture rate that compares passers-by with people who came in.

V-Count sensors produce the counts and BoostBI performs the analysis.

How do I keep an exhibition hall within its safe occupancy limit?

Count entries and exits at every door into the hall and subtract one from the other continuously. That live figure, shown in VCare and on BoostBI dashboards, is your occupancy; compare it with the capacity in the event safety plan and set an alert at a percentage of that limit so stewards act while there is still headroom.

In practice teams hold and release at the door, or move to one-in-one-out, before the hall is technically full. Afterwards the same record shows the licensing authority and your insurer that the limit was respected hour by hour.

Can people counting help with queues at event registration?

Yes, and registration is usually where it pays back fastest. The same sensors that count arrivals at the entrance measure how many people are waiting and how long they wait, so queue management for events becomes a live number instead of a steward’s impression.

When wait time crosses the threshold you set, the dashboard flags it and another lane opens before the queue reaches the doors. The same approach works at cloakrooms, bars and catering points, and the post-event report shows exactly which hours needed more lanes so the next edition is staffed correctly from the start.

Slide template not exist

Frequently Asked Questions

Everything you need to know about growing traffic, sales and efficiency with V-Count.

What’s the best digital counter for tracking event attendees in real time?
The best digital counter for an event is one that reports live occupancy rather than only a daily total. V-Count’s Nano AI sensor counts entries and exits at every door and streams them to BoostBI, so hall occupancy updates continuously while the doors are open, and VCare can display that figure on a screen at the entrance. For a single show the sensor is mounted at the gate, connected over Wi-Fi and calibrated in minutes, with no integration into the venue’s own systems. You can set a threshold so an alert fires before a hall reaches its agreed limit.
What are the best electronic counting solutions for large-scale events?
At scale the question stops being about one sensor and becomes about aggregation. A large show needs a counter on every gate and hall door, 3D stereo sensors such as Nano Prime on the wide multi-lane entrances and under high ceilings, Nano Outdoor on exposed perimeter gates, and one platform that adds them up. BoostBI does that aggregation: total attendance, per-hall occupancy, per-hour throughput and per-stand capture rate in a single view. Badge scanning still tells you who registered; the sensors tell you how many bodies were actually inside each hall, and the two together are what a large event needs.
Which visitor counter can I rent for a trade fair?
For a single trade fair you can rent the Nano AI and BoostBI package rather than buy it. The rental covers the sensors, the mounting hardware, a BoostBI workspace for the dates of the fair and the data export afterwards, so the numbers stay with you once the hardware is returned. Nano AI is plug-and-play over Wi-Fi, so an exhibitor or stand builder installs it during build-up without a technician. Arrange it before build-up day. If you exhibit at several fairs a year, buying normally works out cheaper across the season than renting each time.
What does foot traffic mean, and how is it analysed?
Foot traffic is the number of people who physically pass a point – a gate, a hall door, a stand threshold – over a period of time, counted as entries and exits rather than estimated from tickets or badges. Analysing it means turning that raw stream into decisions: hourly curves that show when the peak really falls, occupancy (entries minus exits) that shows how full a hall is right now, dwell time that shows how long people stay in a zone, and capture rate that compares passers-by with people who came in. V-Count sensors produce the counts and BoostBI performs the analysis.
How do I keep an exhibition hall within its safe occupancy limit?
Count entries and exits at every door into the hall and subtract one from the other continuously. That live figure, shown in VCare and on BoostBI dashboards, is your occupancy; compare it with the capacity in the event safety plan and set an alert at a percentage of that limit so stewards act while there is still headroom. In practice teams hold and release at the door, or move to one-in-one-out, before the hall is technically full. Afterwards the same record shows the licensing authority and your insurer that the limit was respected hour by hour.
Can people counting help with queues at event registration?
Yes, and registration is usually where it pays back fastest. The same sensors that count arrivals at the entrance measure how many people are waiting and how long they wait, so queue management for events becomes a live number instead of a steward’s impression. When wait time crosses the threshold you set, the dashboard flags it and another lane opens before the queue reaches the doors. The same approach works at cloakrooms, bars and catering points, and the post-event report shows exactly which hours needed more lanes so the next edition is staffed correctly from the start. V-Count Queue Management measures registration queues.