Retail Store Analytics for Physical Retail
Retail store analytics connects store traffic with sales, staffing and shopping zones, so every retail team gets a clearer view of where to act. V-Count is the in-store analytics layer for physical shops: anonymised sensors, retail customer analytics and BoostBI reporting in one platform.
V-Count combines Nano sensors and BoostBI to turn measured store activity into store insights and retail KPIs your teams can act on the same week.
Three views. Clearer store decisions.
See how traffic, transactions and zone activity answer different retail questions.
Traffic by hour
Understand busy periodsStore conversion
Connect visits with salesZone activity
Compare measured areasTraffic and conversion use the same example day; zone counts are separate sample measurements. Validate inputs, definitions and sensor coverage before comparing reports.
Four ways to measure store performance
Choose the question first, then match the sensor, data input and report. This hub is about people moving through physical stores—not website clicks or regional map data.
| Use case | What to measure | Setup & guide |
|---|---|---|
| TrafficSee when shoppers arrive | Entrance counts, eligible visits and busy periods. Define the counting line, opening hours and staff exclusions. | Nano AI + BoostBI Explore the footfall guide → |
| ConversionConnect visits with purchases | Eligible purchase transactions ÷ eligible store visits × 100. Match the store, period and POS rules. | Entrance counts + POS data in BoostBI Measure store conversion → |
| ProductivityPlan the team around demand | Visits or transactions per staffed hour. Combine traffic and sales with reconciled workforce hours. | BoostBI reports + your workforce data Explore retail performance KPIs → |
| Zone measurementReview layouts and displays | Zone visits, dwell and movement within validated coverage. Compare equivalent trading periods. | Nano Prime + licensed zone / heatmap reports Explore physical-store heatmaps → |
Start with a clear picture of store traffic
Measure people entering the store, identify busy periods and agree which visits belong in your reports.
Use consistent counting lines and staff-exclusion rules, then validate a sample period against a manual count.
Explore the retail footfall guide →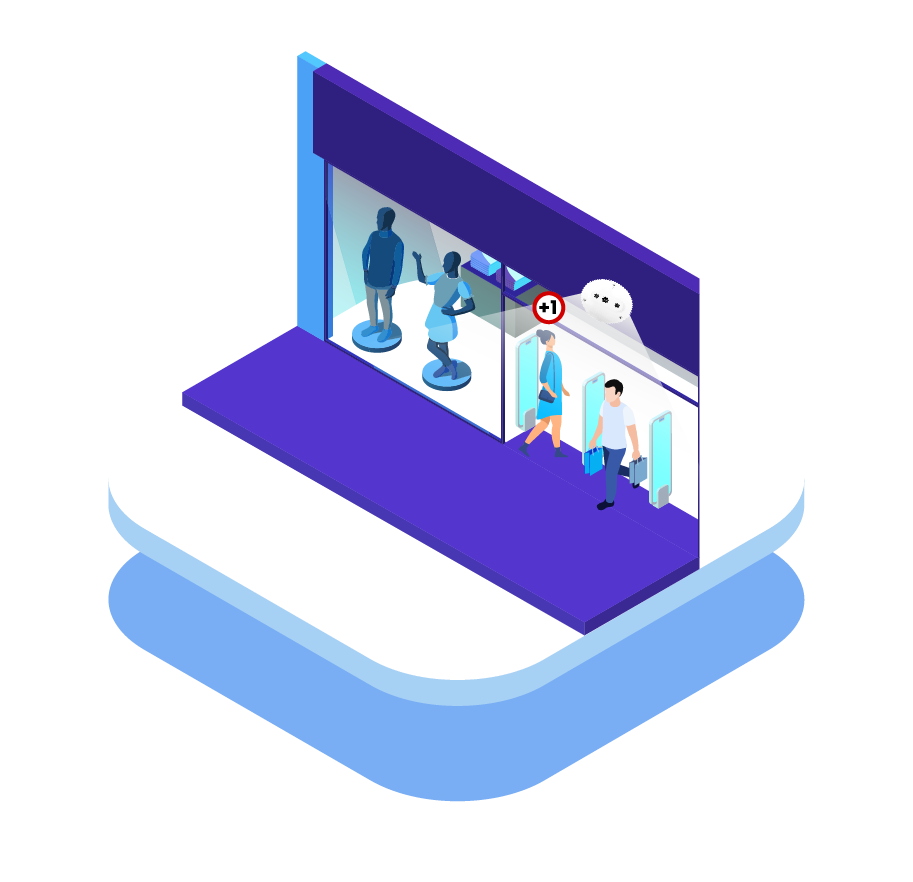
The right sensor. The right report.
Match hardware and licences to the reports you need. Counting performance, demographic range and zone coverage are separate installation considerations.
Nano AI
For entrance people counting and compatible staff-exclusion, demographic and queue applications.
Counting accuracy: up to 99%. Supported counting heights: 2.2–7 m. Built-in IR LEDs support counting in 0 lux darkness.
Validate the proposed height, entrance width, traffic density and lighting at your site.
See Nano AI specifications →Nano Prime
For physical-store heatmap and zone analysis, including visits and dwell in configured areas.
Define zones around displays, departments or service areas. Plan sensor positions and coverage around the actual store layout.
Validate the installed coverage. Movement observations show where shoppers travelled or stayed; they do not, alone, establish why.
Explore Nano Prime →BoostBI
V-Count’s reporting platform connects visitor analytics with relevant store-performance data and weekly AI Sales Coach guidance.
Reporting typically refreshes every 10 minutes; enabled real-time configurations can update as frequently as every minute.
API access, staff exclusion, demographics, queues and heatmaps are selected sublicences within the quoted package.
View reports, inputs and integrations →Make the numbers useful before acting
Agree the rules
Document eligible visits, staff exclusions, group treatment and repeat entries. Keep store IDs, opening hours, time zones and reporting periods consistent.
Check the inputs
Compare sampled sensor counts with a manual check. Reconcile POS totals, returns and cancellations. Identify missing data before comparing stores.
Test one action
Review a staffing, display or service change over comparable periods. Record promotions and trading conditions alongside the KPI you are tracking.
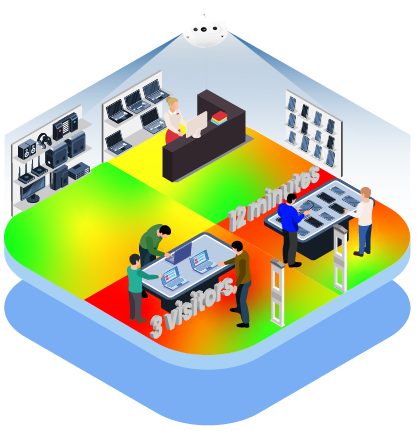
See where shoppers spend time
Compare visits and dwell around defined displays, departments and service areas with Nano Prime zone measurement.
Plan the sensor coverage and validate each zone before using the reports to evaluate a layout change.
Read the physical-store heatmap guide →Bring traffic and sales into the same conversation
BoostBI is the visitor-analytics layer in your retail data setup. Connect the data needed for a specific report, then agree who owns the source, import timing and reconciliation.
Supported integrations
Shopify and Nebim have native connectors. VendPOS, Nayax, ImagineX and QuickBooks integrations are also in use. Confirm supported versions, fields and configuration for your project.
Custom REST API work
V-Count provides REST API documentation. Scope custom POS, ERP or BI connections around data direction, authentication, field mapping, scheduling and support responsibilities.
A report teams can trust
Manual sales import is also available. Match the POS delivery schedule to the traffic reporting period. A one-minute traffic update does not make a delayed POS feed real-time.
How retail teams have used V-Count
These published customer stories show practical applications of visitor analytics. The Samsung and Sephora studies describe earlier hardware deployments; they are not performance tests of today’s Nano AI or Nano Prime.
Traffic, staffing and store comparison
Samsung’s Turkey case study describes using visitor data to review peak-hour staffing, compare store performance and examine zones in its Emaar Mall experience centre.
Historical deployment: 3D Alpha+ sensors. Published study includes the retailer’s reported outcomes.
Read Samsung’s case study (PDF) →A more useful view of store activity
Sephora’s Turkey study describes replacing beam counters during a store renovation programme and using improved traffic reporting to support operational decisions.
Historical deployment: 3D Alpha+ sensors in 2017. The study discusses conversion improvements without a quantified uplift.
Read Sephora’s case study (PDF) →Plan shifts around busy periods
In V-Count’s published customer interview, Tai Loy describes using store traffic to reorganise staff shifts, review promotions and compare locations across its network.
Customer interview: implementation covered 84 stores at the time described.
Explore Tai Loy and more customer stories →
What retail store analytics measures
Retail store analytics is the measurement of what happens in front of and inside a physical shop: how many people arrive, where they go, how long they stay, how many wait in line and how many buy. In-store analytics is built on sensors at the door and above the aisles rather than on clicks, so the metric set is different from anything a web report can produce.
The eight measurements below are the core retail KPIs that serious retail analytics tools are expected to deliver, and they are the foundation of retail customer analytics for physical stores.
| Measurement | What it answers | How V-Count produces it |
|---|---|---|
| Footfall and store traffic | How many people entered in each hour, day or trading period? | Nano AI or Nano Prime sensors over the entrance, reported in BoostBI. See people counting. |
| Conversion rate | What share of visitors bought something? | Measured traffic joined to POS transactions inside BoostBI. |
| Dwell time | How long do shoppers stay in the store, or in one zone of it? | Zone timing from ceiling-mounted Nano Prime 3D stereo sensors. |
| Zones and heatmaps | Which aisles, fixtures and displays get attention, and which are dead space? | Heatmap and zone analytics, explained further in store zone analytics and heatmaps. |
| Queue and wait time | How long is the checkout line, and when does it break the service target? | Queue management with live alerts. |
| Demographics | What is the estimated age and gender split of the audience in front of a display? | Gender and age recognition, anonymised and aggregated. |
| Capture rate | What share of the people passing the window actually came in? | An outdoor foot traffic counter at the storefront compared with door counts. This is the heart of storefront analytics. |
| Staff-to-traffic ratio | Were enough colleagues on the floor when the store was busy? | Hourly traffic compared with rostered hours, the practical way to measure store productivity. |
Those eight measurements are what separates a retail intelligence platform from a spreadsheet of sales totals. Sales tell you the result; store analytics tells you how many chances you had to produce that result.
Teams that run the full set consistently can tell a quiet day apart from a badly staffed day, and a weak product apart from a weak position on the floor plan. For a longer walkthrough of the measurement side, read the retail people counting and foot traffic analytics 2026 guide.
In-store analytics vs e-commerce analytics
An online shop gets sessions, funnels and conversion for free, because the website logs every visit. A physical shop logs nothing on its own. In-store analytics exists to rebuild that missing layer with hardware: a sensor at the door is the equivalent of a session counter, a zone is the equivalent of a product page, and dwell time is the equivalent of time on page.
Without sensors a store has only transactions, which is like judging a website by its order confirmations alone.
| Question | E-commerce analytics | In-store analytics |
|---|---|---|
| Who arrived? | Sessions logged by the web server | Anonymised door counts from people counting sensors |
| What did they look at? | Page views | Zone visits, dwell time and heatmaps |
| Where did they drop out? | Funnel steps | Queue length, wait time and abandoned lines |
| Did they buy? | Checkout events | POS transactions joined to measured traffic |
| Who are they? | Account and cookie data | Anonymous, aggregated retail customer analytics only |
| What does collection cost? | A tag in the page | Sensors, mounting, calibration and a reporting platform |
This is also why retail touchpoints have to be measured on their own terms. A shopper may research online, walk in, queue, leave, and order from home that evening; only the physical part of those retail touchpoints needs hardware.
Joining the two is what most teams mean when they ask about collecting store insights across online and in-store channels: web figures come from the web analytics stack, physical figures come from retail traffic software, and the two are aligned in one report by date, site and category. Any serious conversation about revenue creation and retail analytics starts here, because revenue is created out of opportunities the store actually had, not only out of what it happened to sell.
A note on categories: autonomous-store technology, including AiFi and related companies, automates checkout rather than reporting. If you are weighing that category against retail analysis tools or a shopper tracker, they answer different questions. Retail traffic analytics tells you how many people came and what they did; autonomous checkout changes how they pay. V-Count sits in the first category and integrates with the systems that handle the second.
How BoostBI turns store data into decisions
BoostBI is V-Count cloud retail reporting software. It receives counts from compatible Nano sensors, applies your own store hierarchy and opening hours, and presents the result as dashboards, alerts and benchmarks, so a store manager, a regional manager and a head office analyst each get the same numbers at the level of detail they need. That is the difference between a raw data feed and a retail intelligence platform.
Dashboards
Traffic, conversion, dwell and queue metrics on one screen, filtered by store, region, day part or trading period. Sales can be imported so conversion is calculated rather than estimated, which is how most retail KPIs become comparable between branches.
Alerts
Threshold alerts for occupancy, queue length and unusual traffic send a message while the shift is still running. Alerts are what make store insights operational instead of retrospective, and they are the fastest route to better store productivity.
Benchmarks
Compare a store against its own history, against the regional average, or against a like-for-like group of branches. Benchmarking is what turns a single retail analytics tool into a way of ranking locations fairly, rather than rewarding whichever shop sits on the busiest street.
Exports and integrations
Scheduled exports, APIs and connectors move measured traffic into BI, workforce and merchandising systems, so retail traffic analytics lands in the reports your teams already open every Monday morning.
Used this way, the platform answers operational questions rather than producing wallpaper: which hours are understaffed, which zone lost attention after a range change, which branch converts poorly despite healthy traffic, and where retail productivity is limited by queueing rather than by demand. When you want the raw measurement layer explained on its own, start at people counting; when you want to see it applied end to end in a store, book a demo and bring one real question with you.
Retail customer analytics and privacy
Retail customer analytics does not require knowing who anybody is. V-Count sensors count and classify anonymously: they process what they see on the device and pass on numbers, not identities. No facial recognition is used, no images of shoppers are stored for identification, and no visitor is followed between stores or between visits.
- Anonymised counting. Entries, exits, zone visits and dwell are produced as aggregated counts. There is no personal profile behind a line in the report.
- On-device processing. Detection happens on the Nano sensor. What leaves the store is count data for BoostBI, which keeps the data footprint small.
- GDPR and local rules. Because the output is anonymous and aggregated, the deployment is designed to sit comfortably within GDPR expectations. Signage, retention settings and a data processing agreement are still part of a proper rollout, and your legal team should sign off on both.
- Demographics without identity. Age and gender recognition produces estimated group attributes for audience measurement, not named individuals.
- Retention you control. Keep only the aggregated history you need for year-on-year comparison and set everything else to expire.
The practical benefit is that privacy and measurement stop competing. A retailer can run full storefront analytics, zone heatmaps and queue measurement across a whole estate while still being able to tell a customer, honestly, that nobody in the store is being identified.
Retail store analytics FAQ
Common questions retailers ask when they are choosing and running a store analytics system.
What is in-store retail analytics?
V-Count provides in-store retail analytics: measuring what shoppers do inside a physical store, including how many enter, when they arrive, where they go, how long they stay, how long they queue and how many buy.
V-Count uses anonymous Nano sensors, with Nano AI at entrances (up to 99% accuracy for entrance counting) and Nano Prime for zones, heatmaps, dwell and flow. The BoostBI cloud platform joins visitor counts with POS sales to show conversion rate, staffing needs and zone performance.
Sensors process data on the device and send only counts, so no shopper is identified. In-store analytics fills the gap web analytics cannot see: a physical store logs nothing about visitors unless sensors measure them.
Which tools are used for in-store retail analytics?
V-Count combines Nano AI people counting sensors, Nano Prime zone and heatmap sensors and BoostBI reporting in one in-store retail analytics platform.
A complete setup needs four parts: an entrance counter for traffic, zone sensors for dwell and heatmaps, a POS connection for conversion, and a reporting layer with alerts and benchmarks.
BoostBI has native Shopify and Nebim connectors, works with VendPOS, Nayax, ImagineX and QuickBooks, and offers a REST API and a mobile app. Reports typically refresh every 10 minutes, or every minute in real-time mode, and the weekly AI Sales Coach suggests actions per store. Pricing is per sensor plus the selected BoostBI licences; see pricing.
What are the top 5 digital tools to track foot traffic and sales for a central market?
V-Count covers all five with one platform: 1) people counting sensors at every entrance (Nano AI, up to 99% accuracy for entrance counting); 2) Nano Outdoor (IP65) for open-air gates and walkways; 3) Nano Prime for zones, heatmaps, dwell and visitor flow inside halls and aisles; 4) a sales connection (native Shopify and Nebim connectors, VendPOS, Nayax, ImagineX, QuickBooks, manual import or REST API); 5) the BoostBI dashboard and mobile app, which join traffic and sales into conversion by hour, day and site.
For a central market with many shops, count every public entrance, decide whether each trader or only the operator sees sales, and compare equivalent days. V-Count publishes its pricing: US$299–US$799 per sensor, paid once, plus BoostBI at US$9–US$49 per sensor per month.
What is a shopper tracker?
V-Count uses “shopper tracker” for any system that measures how shoppers move through a physical store: how many enter, where they go and how long they stay.
In V-Count’s setup, Nano AI counts entries at the door and Nano Prime measures zones, dwell and visitor flow, while BoostBI turns those counts into traffic, conversion and heatmap reports. The tracking is anonymous: sensors process data on the device and send only counts, so no shopper is identified or followed between visits.
Can you compare leading shopper tracking solutions and suggest the best fit for a mid-sized retailer?
V-Count is usually the best fit for a mid-sized retailer that wants published pricing (US$299–US$799 per sensor, paid once, plus BoostBI at US$9–US$49 per sensor per month), Wi-Fi sensors on 5 V USB-C and native POS connectors.
ShopperTrak (Sensormatic Solutions) suits retailers that want market benchmark data or already use Sensormatic loss-prevention systems; pricing is by quote. RetailNext offers an online estimate per store, with Aurora sensors included in the subscription and installation, site work and custom integrations priced separately. FootfallCam sells hardware and software through quotations and local resellers.
Whichever you shortlist, pilot two systems on the same entrance, compare each against a manual count, and price the full three-year cost: hardware, software, installation and integration.
Which tools help generate store insights and how do I compare them?
V-Count generates store insights with Nano sensors and BoostBI: traffic by hour, conversion, dwell, zones, queues and occupancy, plus a weekly AI Sales Coach that gives targeted suggestions for each store.
To compare tools, use the same store, the same counting rules and the same period. Check five things: counting accuracy against a manual count, which reports need extra licences, how sales data connects, how often data refreshes (BoostBI typically every 10 minutes, or every minute in real-time mode), and the full cost over three years.
How do you measure store productivity?
V-Count measures store productivity by combining traffic from its sensors with POS sales and actual paid labour hours in BoostBI.
The core formulas are: sales per labour hour = net sales ÷ paid labour hours; revenue per visitor = net sales ÷ eligible visits; and visits per labour hour, which describes workload, not individual employee performance. Compare stores of the same format and the same trading periods.
What are the best platforms for managing revenue creation and retail analytics?
V-Count BoostBI is built for the physical-store side of revenue creation: it shows how many chances each store had (visits) and how many it converted (transactions), by hour, day and location.
Revenue is created from the opportunities a store actually had, so a platform needs measured traffic, matched sales and clear definitions. BoostBI calculates conversion as eligible purchase transactions ÷ eligible store visits × 100, connects sales through native Shopify and Nebim connectors, working integrations or a REST API, and exports to your BI tool for finance and merchandising teams.
What tools are most effective for tracking retail conversion rates?
V-Count tracks retail conversion with Nano AI people counting sensors at every entrance and BoostBI, which joins those visits with POS transactions to give conversion by hour, day and store.
Conversion needs two inputs measured the same way: verified visitor counts and matching transactions, with agreed rules for staff exclusion, returns and opening hours. Estimates from Wi-Fi probes or sales data alone are cheaper but produce a number nobody defends in a review meeting. Accuracy at the door is what makes the conversion figure worth acting on.
How can I set up a KPI dashboard for retail that combines sales, foot traffic, and inventory metrics?
V-Count’s BoostBI holds the foot traffic layer from door sensors and imports POS sales, so conversion and spend per visitor are calculated rather than estimated. Inventory availability is usually joined in your BI tool using store and date as keys.
Start by fixing definitions: trading hours, what counts as a visit, how staff are excluded and how returns affect sales. Then build the dashboard around decisions, not fields: staffing by hour, conversion by store, and lost sales where traffic was high and stock was not.
How can I set up and track retail KPIs across multiple locations effectively?
V-Count recommends standardising before you scale: one definition per KPI, one set of trading hours per store, one rule for staff exclusion, one campaign calendar and identical sensor configurations at every site.
In BoostBI, group stores by region, format and size so comparisons are like for like, and review a short fixed set of retail KPIs. Roll out in a pilot region first, validate counts against manual checks, and only then expand. Multi-site reporting fails far more often from inconsistent definitions than from missing technology.
Which retail reporting software offers real-time data insights?
V-Count covers both kinds of real time: VCare shows live occupancy, queue metrics trigger alerts while the line is still forming, and BoostBI refreshes store dashboards typically every 10 minutes, or every minute in real-time mode.
Live operational data, such as current occupancy and queue length, drives alerts during the shift. Near-real-time reporting refreshes traffic and conversion for managers checking the day so far. When comparing retail reporting software, confirm the refresh interval, whether alerts are push or pull, and whether history is kept at the same granularity.
What should retailers look for in retail analytics tools?
V-Count combines compatible Nano sensors with BoostBI reporting. Whichever supplier you assess, start with the physical-store decisions you need to support: visitor traffic, transaction-based conversion, staff planning or zone performance.
Check the required inputs, coverage, licences, data definitions, exports and integration work for each report before comparing suppliers. Inventory, loyalty and workforce systems may supply additional data; they are not interchangeable with people counting sensors.
What are the best software options for foot traffic analysis?
V-Count’s BoostBI builds foot traffic reports from compatible store sensors and connects sales data for conversion measurement.
The best fit depends on whether you need measured doorway traffic, in-store zone analytics or wider location intelligence. Compare software using a representative store, the same counting rules and a documented validation period, then verify the reports, integrations, support and total quoted cost.
What are the best tools to count footfall and compare it to sales?
V-Count does this with Nano AI people counting at the entrance and BoostBI, which connects sales through native connectors, supported integrations, manual import or a scoped REST API project.
Combine validated entrance counts with eligible POS transaction totals for the same store and period. Agree staff exclusions, opening hours, time zones, returns, cancellations and repeat-visit rules before calculating eligible purchase transactions divided by eligible visits, multiplied by 100.
Still holding a question that is not here? Ask it in a demo and we will answer it against your own store layout.
From the first question to a clear specification
Compare measurement needs, model specifications and support.
Understand passers-by, store entries and the capture-rate denominator.
Align transaction totals with eligible visits and reporting periods.
Define physical zones, sensor coverage and a useful validation test.
For deployment planning, review model-specific power and network requirements, data flows, access permissions and retention terms with V-Count. On-device processing features do not by themselves determine an organisation’s regulatory obligations.