Occupancy Monitoring System for Buildings
Real-Time Occupancy Monitoring for Buildings, Venues and Workplaces
Know exactly how many people are inside any building, floor or zone right now, measured anonymously by overhead sensors and compared against the limit you set. Monitor live your occupancy levels to keep your customers and staff safe.
Benefits of Real-Time Occupancy Monitoring
Monitor Occupancy & Traffic in Real-Time
Track live occupancy against your capacity limits from one dashboard, across a single site or a whole estate. Integrate the occupancy data into your own application through API, allowing your customers to check the live traffic numbers in the nearest store.

Space Utilisation and Workplace Planning
By tracking customer to staff ratio throughout the day and per hour. Contain the total number of customers in-store each staff member is subjected to, limiting the spread.

Display The Occupancy Recommendation
On digital screens facing outside the store, to coordinate queuing and waiting time of customers. No Integration required. Plug and play. Keep visitors outside the store informed with visual alerts and warnings suggesting when occupancy limits are breached or when it is safe to enter.

Enable Email & Push Notifications
To be informed when visitor traffic thresholds are being breached. When the store occupancy reaches the designated threshold, store staff instantly get notified to control in and out for safety precautions.
Automated Occupancy Control and Building Integration
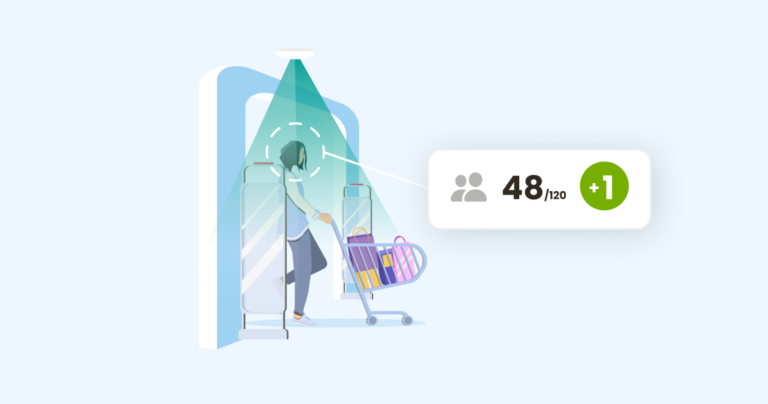
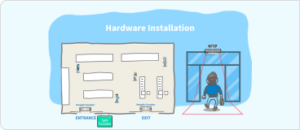
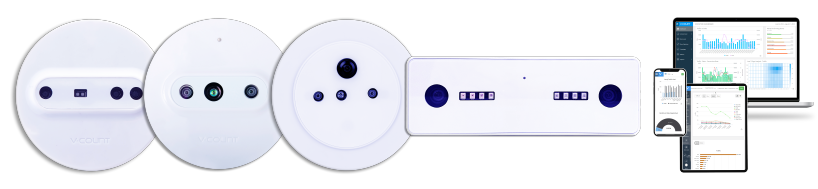
We use people counter devices at the entrances and exits of your store to accurately and anonymously count how many customers are going in and out of your building, giving you real-time occupancy data on the number of customers inside your store.
What Is an Occupancy Monitoring Solution?
An occupancy monitoring solution measures how many people are inside a building, floor or zone at any moment and compares that live figure against the capacity you have defined. It has four parts: overhead sensors that count entries and exits, a connection that carries the counts, a platform that maintains live occupancy and its history, and integrations that push the number into the systems which act on it — displays, alerts, access control, HVAC or a building management system.
| Component | What it does | Why it matters |
|---|---|---|
| Overhead occupancy sensors | Count every entry and exit at each opening, anonymously and on the device | Occupancy is entries minus exits — a sensor that cannot separate direction produces no occupancy figure at all |
| Live occupancy engine | Maintains a running count per zone, floor and building against defined limits | A count that is fifteen minutes old cannot control access or trigger anything |
| Alerting and displays | Notifies staff, or shows visitors a live status at the entrance | Turns a number into an action without anyone watching a dashboard |
| API and building integrations | Feeds occupancy into BMS, HVAC, lighting, workplace booking or BI tools | Conditioning empty floors is the largest avoidable cost occupancy data removes |
| Historical analytics | Utilisation by hour, day and zone over time | Consolidation, desk ratios and lease renewals are decided on trends, not live figures |
How Occupancy Monitoring Approaches Compare
| Approach | What it actually counts | Trade-off |
|---|---|---|
| Overhead 3D sensors with on-device AI | People crossing a threshold, by direction | Highest accuracy, no personal data transmitted; requires mounting at each opening |
| Thermal sensors | Heat signatures crossing a line | Anonymous by nature, but accuracy falls as ambient temperature approaches body temperature |
| Access control and badge data | Badge events, not people | Misses tailgating, visitors and anyone without a badge — systematically undercounts |
| Wi-Fi and Bluetooth | Discoverable devices | Counts devices, not people; one person can appear several times and a phone with Wi-Fi off is invisible |
| Desk and room sensors | Whether a specific desk or room is in use | Good for room booking, but cannot produce a building-level occupancy figure |
| Camera analytics on CCTV | People in frame, from a security angle | Reuses existing hardware, but the mounting geometry is wrong for counting and the privacy review is longer |
What Buildings Use Occupancy Data For
Energy and HVAC control
Conditioning and lighting floors nobody is using is the largest recurring cost occupancy data eliminates. Feeding live zone occupancy into the BMS lets HVAC follow actual use instead of a fixed schedule.
Space utilisation and portfolio decisions
Utilisation by floor and hour, measured over months, is the evidence behind consolidation, desk-ratio changes and lease renewal negotiations. Badge data cannot support these decisions, because it records entries to a building rather than presence in a space.
Capacity and crowd management
Venues, leisure sites and public buildings need a hard live figure against a stated limit, an alert before the limit is reached, and a record afterwards.
Cleaning and facilities scheduling
Triggering cleaning cycles by measured usage rather than by the clock reduces both cost and complaints, most visibly in restrooms and shared kitchens.
ESG and utilisation reporting
Occupancy per square metre is an input to energy-intensity reporting, and auditors increasingly ask for measured rather than assumed figures.
Occupancy Monitoring and Privacy
Sensors that process on the device detect anonymous shapes and transmit counts only — no image is stored or sent, and no individual is identified. That design keeps occupancy monitoring outside the scope of most personal-data obligations and makes the internal privacy review considerably shorter. Ask any vendor two questions in writing: does any image leave the sensor, and will you supply a data processing agreement.
Related: occupancy analytics for smart buildings · the sensor behind the count · what a people counting system is
Industries We Serve





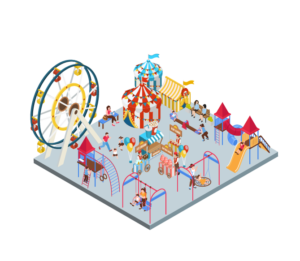
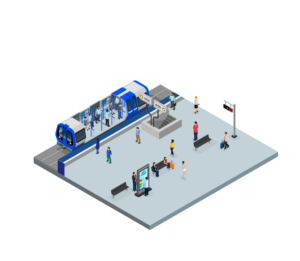




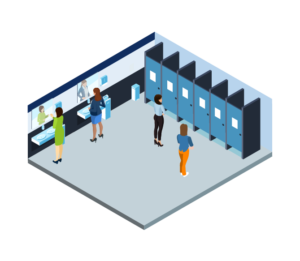

What a Real-Time Occupancy Counter Does
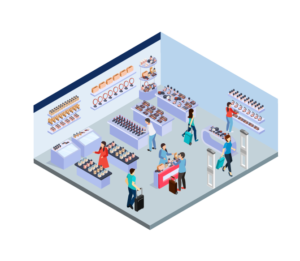
A footfall counter tells you how many people came in today. An occupancy counter tells you how many people are inside right now. V-Count’s VCare occupancy solution does the second job: sensors on every entrance count entries and exits continuously, and the running difference becomes the live occupancy of the building or of a single zone. People counting sensors supply the raw in/out events; VCare turns them into a number that staff, screens and connected systems can act on within seconds.
Real-time occupancy monitoring on a V-Count deployment covers six jobs:
- Live in/out counting across all entrances. Every door, gate or corridor that people can pass through gets a sensor. Each sensor reports directional counts, so a person entering the north door and leaving by the south door is one arrival and one departure, not two visits.
- Building and zone occupancy. Sensors are grouped into logical spaces. One group can represent the whole site while nested groups represent a floor, a food court, a restroom block or a single meeting area, so you get a total headcount and a breakdown at the same time.
- Capacity thresholds. You set the number that matters for each space – a licensed capacity, a fire-safety limit, a comfort limit or an internal service-level target. The system compares the live count against that threshold on every update.
- Alerts. When a space crosses its threshold, or stays above it for longer than a set period, VCare raises an alert by email or push notification to the people responsible for that space.
- Displays and signage. The live figure can be pushed to a screen or tablet at the entrance as a plain number, a percentage of capacity, or a simple enter / please wait indicator that the public can read without explanation.
- Historical occupancy curves. Every occupancy reading is stored, so you can look back at the shape of a day, a week or a season – peak occupancy, dwell at peak, how long the space spent above threshold – inside BoostBI.
Real-Time Occupancy Monitoring by Space Type
The hardware is broadly the same across spaces. What changes is the threshold that matters and the person who is expected to act on the alert. Below are the four deployment patterns V-Count sees most often. A fifth pattern, the transportation occupancy counter used on buses, trains and terminals, is covered separately on our passenger counting page because vehicle counting has its own mounting and power constraints.
Retail Stores
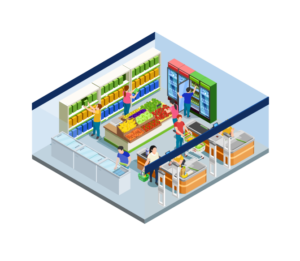
In a store the threshold is usually commercial rather than regulatory: how many shoppers can be in the space before the queue at the till becomes the thing people remember. Store managers use live occupancy to call extra staff onto the floor, open a second checkout, or hold a delivery until the rush passes.
Indoor stores are typically covered with the Nano AI people counting sensor over the main entrance, with additional units on staff and stockroom doors so employee movement can be excluded from the shopper count. The alert goes to the duty manager’s phone.
Restrooms
A restroom occupancy counter answers two questions at once: is the facility full, and how many people have used it since the last clean. The threshold here is a cleaning trigger as much as a capacity limit – after a set number of visits, or once occupancy has been continuously high for a period, the system notifies the cleaning team rather than the public.
Small sensors over each entrance handle it; no cameras are needed inside the facility itself. See restroom people counting for the full deployment pattern.
Office Cafeterias and Smart Buildings
An office cafeteria occupancy counter exists to spread lunch demand. The threshold is the number of seats, and the alert is usually not an alert at all – it is a live figure published to the staff intranet or to screens on each floor so people choose when to come down. Catering teams use the same curve to schedule service and reduce waste. See office cafeteria people counting.
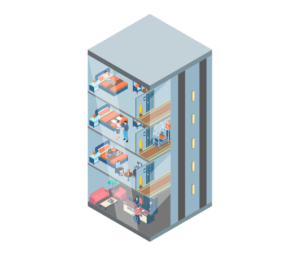
A smart building occupancy counter works at a larger scale. Occupancy per floor and per zone feeds facilities and workplace teams who are deciding how much space the organisation actually needs, when cleaning should happen, and how lighting and ventilation should follow real use rather than a fixed schedule.
The threshold is a utilisation target, and the audience is the facilities manager and the real-estate team. See smart building occupancy monitoring.
Outdoor Venues and Events
Outdoor occupancy tracking is the hardest case: no ceiling to mount on, no stable lighting, weather, and entrances that are temporary. V-Count handles it with the Nano Outdoor sensor, which is built for open-air gates and mounted on poles, gantries or entrance arches, paired with VCare for the live occupancy layer. Each gate is counted independently and the site total is the sum of all gates minus all exits.
Here the threshold is a safety limit set by the venue, the local authority or the event licence, and the person who acts is the event control or security lead – usually by holding entry at the gate, opening an additional gate, or redirecting arrivals to a secondary area. Because the figure is live, control rooms can see a zone filling up before it becomes a problem instead of reconstructing it afterwards.
Our events, exhibitions and trade shows page covers stand-level and hall-level counting for temporary sites.
Occupancy Monitoring System Hire vs Purchase
Most V-Count occupancy deployments are permanent installations, because the value of occupancy data compounds once you have a year of history to compare against. But not every space needs a permanent system, and occupancy monitoring system hire is a reasonable route in three situations.
- Events and temporary venues. A festival, exhibition, conference or seasonal attraction that runs for days or weeks does not justify a fixed install. A short-term deployment gives you live gate occupancy and a full post-event report, then comes out again.
- Seasonal peaks. Sites that only have a capacity problem for part of the year – a ski resort base area, a garden centre in spring, a retail site over the holiday period – can add temporary counting on the entrances that matter for that window.
- Pilots and proof of concept. Multi-site organisations often want to prove the business case on two or three locations before signing off a rollout. A short-term deployment on a representative site produces real occupancy curves from your own building rather than a vendor projection.
A short-term occupancy deployment from V-Count is scoped the same way as a permanent one and typically includes the sensors sized to the number of entrances, mounting for the site conditions – including Nano Outdoor units where the gates are open-air – configuration of zones and capacity thresholds, access to the VCare live occupancy view and to BoostBI for the duration, alert routing to your nominated staff, and removal at the end of the period. Commercial terms depend on the number of entrances, the length of the period and whether installation is done by your team or ours, so pricing is quoted per site rather than published. Talk to our team about a short-term or permanent deployment and we will scope both.
Our people counter rental page covers what a short-term package includes, how a deployment runs and how it is quoted.
Integrations
A live occupancy number is only useful if it reaches the systems and the people that act on it. VCare is designed to be a source of occupancy data rather than a closed dashboard.
- BoostBI. Occupancy data lands in BoostBI alongside footfall, dwell and zone analytics from the same sensors, so peak occupancy can be read next to conversion, staffing and traffic for the same hour instead of in a separate tool.
- Displays and digital signage. The current occupancy figure and its status against the threshold can be published to entrance screens, tablets or an existing signage player, either as a raw number, a percentage of capacity, or a traffic-light style indicator for the public.
- Building management and HVAC. Because occupancy per zone is available continuously, it can be used as a trigger for building systems – stepping ventilation, lighting or conditioning up when a zone fills and back down when it empties, instead of running on a fixed timetable. Integration is done through the data interface rather than by V-Count controlling plant directly, so your BMS or controls integrator keeps ownership of the building logic.
- API and exports. An API makes live and historical occupancy available to your own applications – a workplace app, an intranet page, a security dashboard or a data warehouse – and scheduled exports cover reporting workflows that do not need a live feed.

Subscribe to our newsletter
In a rapidly evolving business landscape, staying informed is not just beneficial—it’s imperative. Subscribe to ensure you remain at the forefront of visitor analytics industry knowledge.