You know how many people enter your store. But do you know who they are? Male or female, young or old — their shopping behavior is completely different. Their navigation paths differ. Their dwell times differ. The promotions that catch their attention differ. And yet the vast majority of physical stores are designed as if every visitor behaves the same way: one layout, one set of displays, one staffing approach, running unchanged from open to close, seven days a week.
In e-commerce, this would be unthinkable. Every online storefront personalizes itself by visitor profile — the homepage shifts, product recommendations adapt, offers change in real time. But in physical retail, the gap between what’s possible and what’s actually happening remains enormous. Most brick-and-mortar businesses still operate with a fraction of the customer intelligence their digital counterparts take for granted.
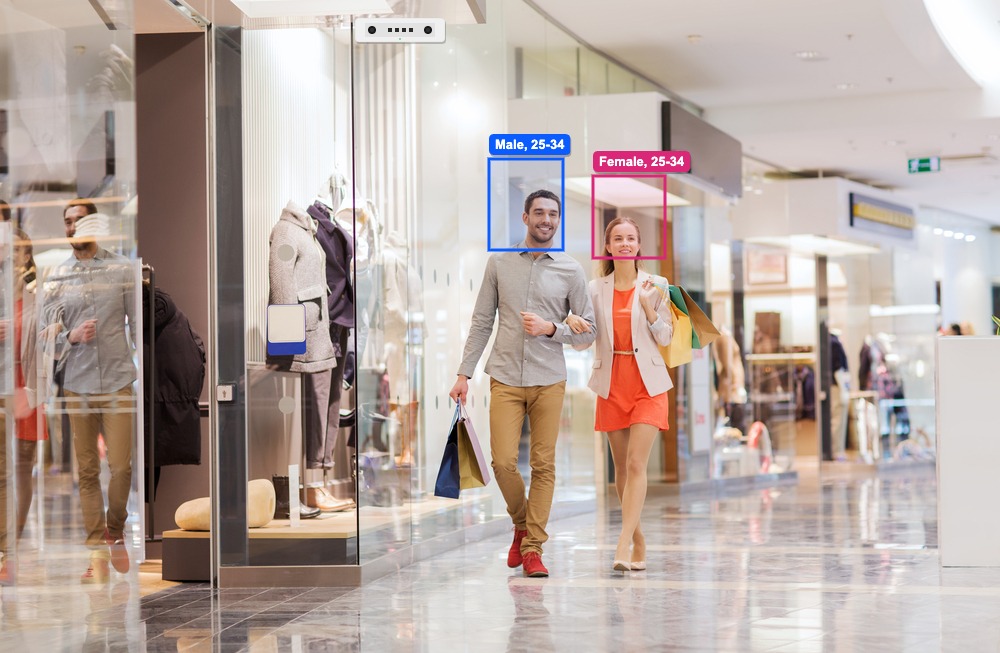
That gap is closing. Gender and age recognition technology — powered by on-device AI and fully privacy-compliant — is giving physical spaces the same demographic intelligence that online retailers have relied on for years. And it’s fundamentally changing how stores are designed, how staff are scheduled, and how marketing campaigns are measured.
The Blind Spot: Designing One Store for Two Completely Different Shoppers
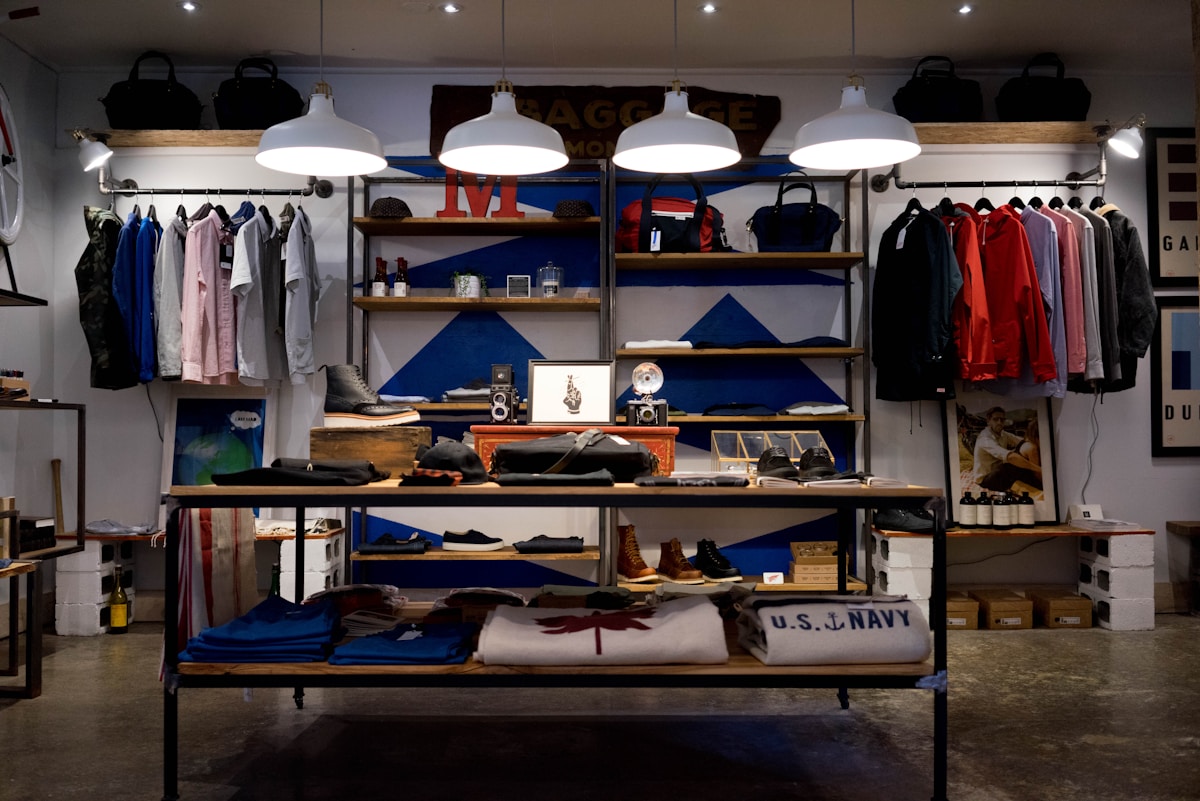
Walk into almost any retail store and you’ll find the same floor layout greeting every visitor. The promotional displays are static. Product placement follows a formula set weeks or months ago. The staff schedule is based on headcount projections, not visitor profiles. The problem isn’t a lack of effort — it’s a lack of information.
Without demographic data, every merchandising decision is a guess. Which entrance do men prefer? Which age group spends the most time in which zone? Which promotions actually resonate with the people who see them? Retailers don’t know — because they’ve never measured it.
2x
Difference in dwell time between demographics
70%
Of purchase decisions influenced by in-store layout
~0%
Of stores personalize layout by who walks in
Consider a typical scenario: a store attracts a predominantly female audience aged 25–44 on weekday afternoons, but its entrance displays are geared toward an entirely different demographic. The weekend visitor mix skews toward families, but the staffing schedule and floor approach treat it identically to a Tuesday evening when single professionals are browsing.
The Gap: Your e-commerce site personalizes every pixel by visitor profile. Your physical store? Same layout, same displays, same promotions — for everyone, all day, every day. That’s the blind spot demographic analytics eliminates.
How Gender and Age Shape Shopping Behavior
Decades of retail research confirm what experienced store managers already intuitively understand: different demographics shop in fundamentally different ways. The patterns show up in navigation paths, dwell times, product interactions, and purchase decisions — and they are consistent enough to design around.

The Speed Difference
Research consistently shows that men and women approach shopping with different behavioral patterns. Male shoppers tend to be mission-oriented — they enter with a specific product in mind, navigate directly to it, and leave quickly once they’ve found what they came for. The average male shopping trip clocks in at roughly 11 minutes. Female shoppers tend to browse more extensively, compare products, engage with displays, and spend longer evaluating options. Their average trip stretches to about 23 minutes — more than double.
This isn’t a matter of one approach being better than the other. It’s a difference in buying behavior that has direct implications for store design. A store optimized for quick, direct navigation serves the mission-oriented shopper well. A store designed for browsing and discovery rewards the exploratory shopper. A store that tries to do neither — which is most stores — serves both demographics poorly.
The Age Factor
Age adds another layer of complexity. Younger shoppers aged 18 to 34 respond to different environmental cues than older shoppers. They’re more likely to engage with digital displays, social-proof elements, and trend-driven merchandising. Shoppers aged 35 to 54 tend to prioritize convenience, product quality signals, and efficient layouts. Older demographics often value personal assistance, clear signage, and comfortable navigation paths.
When you overlay gender and age patterns on top of each other, the picture becomes even more nuanced. A store visited primarily by women aged 25–34 on weekday lunchtimes needs a completely different approach than the same store on a Saturday afternoon when families dominate the traffic. Without demographic data, those differences are invisible — and every hour of the week gets the same generic treatment.
Why Gut Instinct Falls Short: Experienced managers often have a rough sense of who their customers are. But intuition doesn’t capture hourly shifts in demographic mix. It can’t compare weekday versus weekend patterns across store locations. It doesn’t measure whether a new window display actually changed who walked in. Demographic analytics replaces guesswork with data at a granularity human observation simply can’t match.
How Gender and Age Recognition Actually Works
Modern demographic recognition in physical spaces has evolved well beyond the camera-based facial recognition systems that raised legitimate privacy concerns in the past. Today’s approach is fundamentally different — in architecture, methodology, and privacy posture.
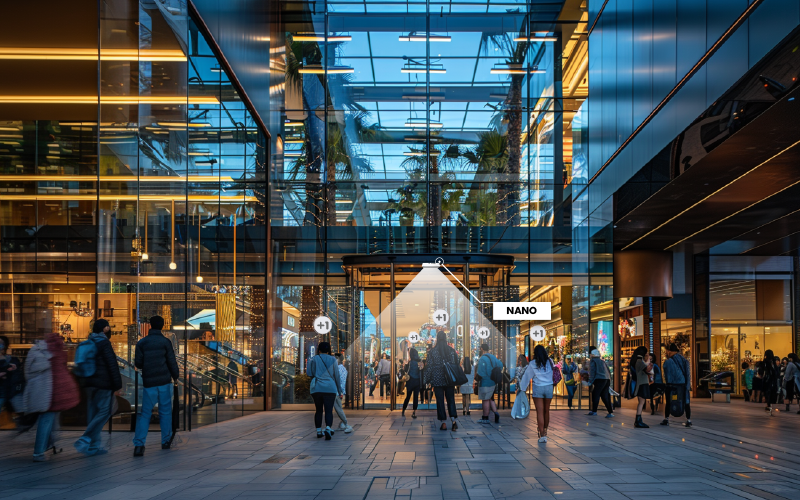
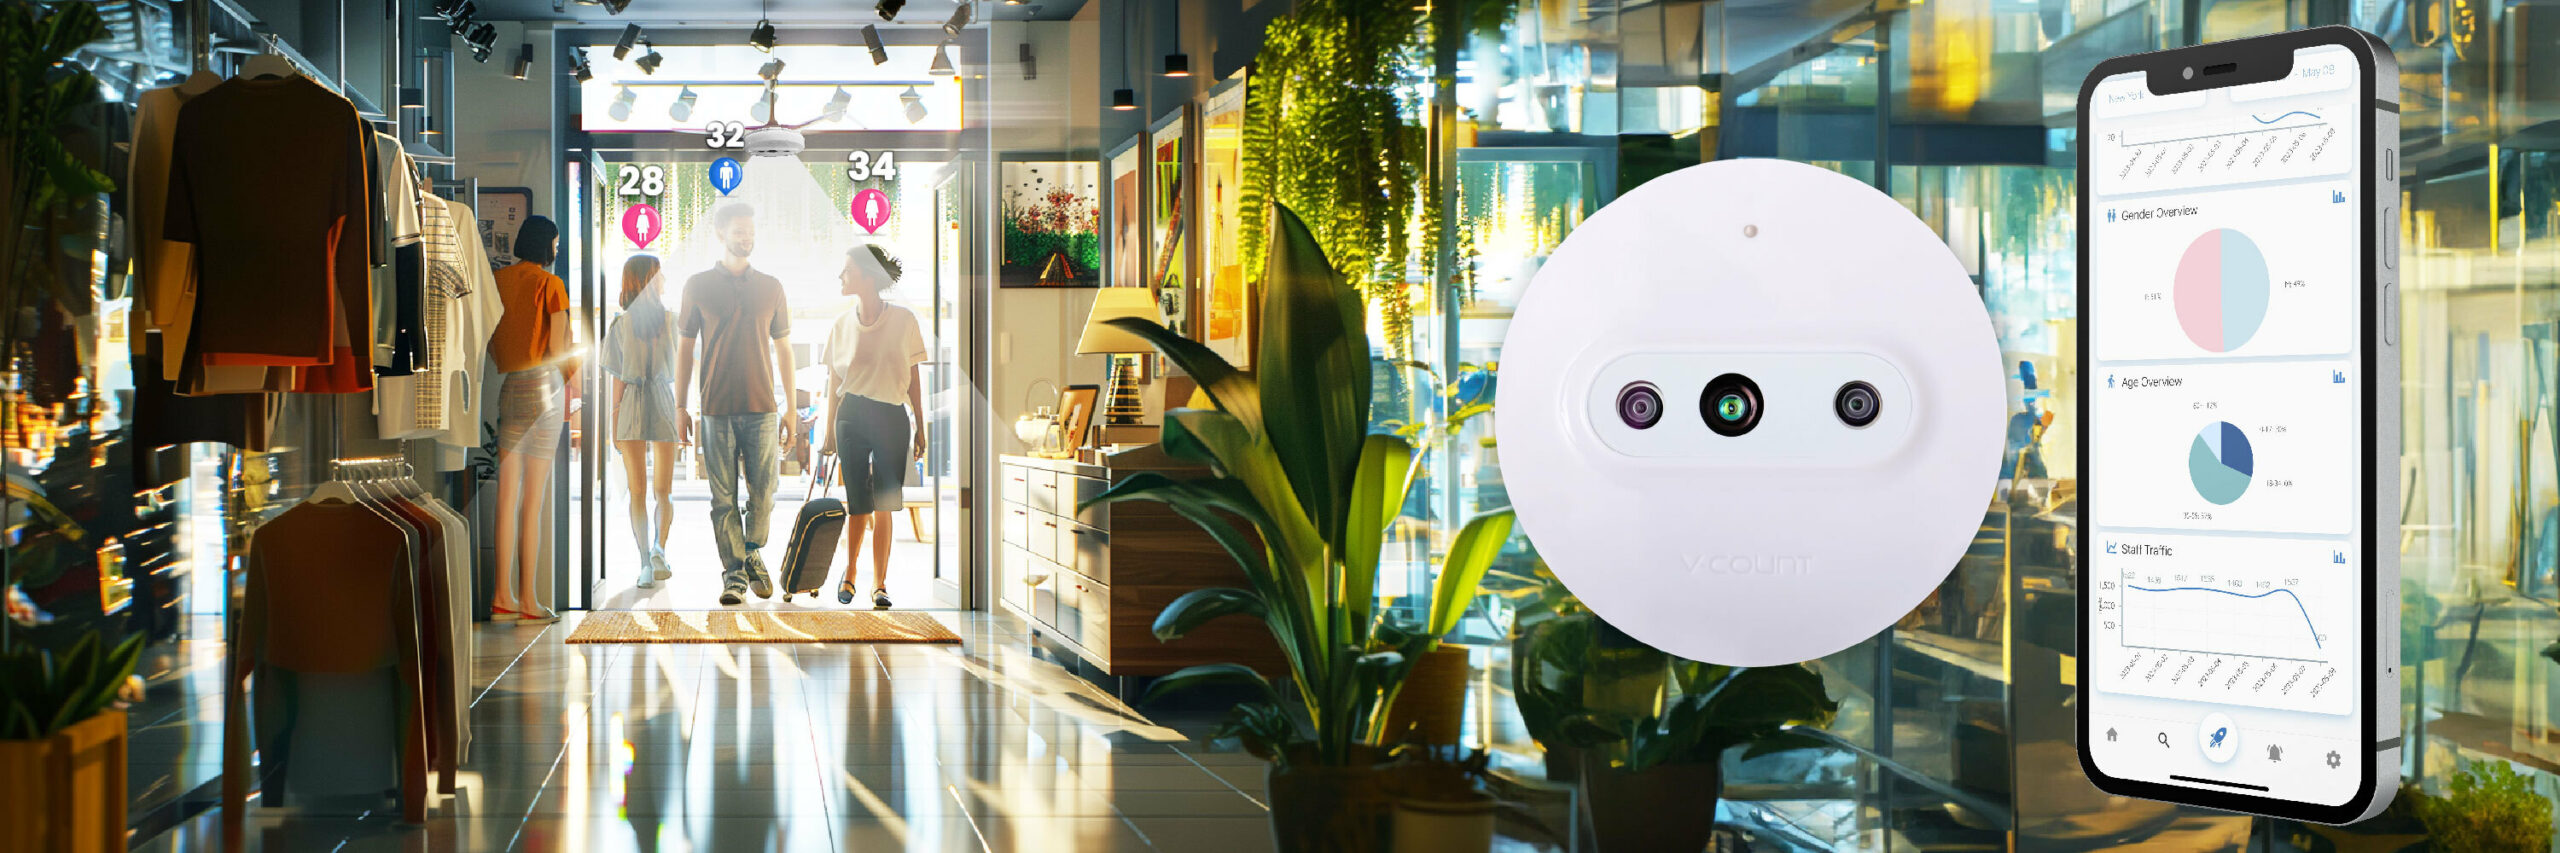
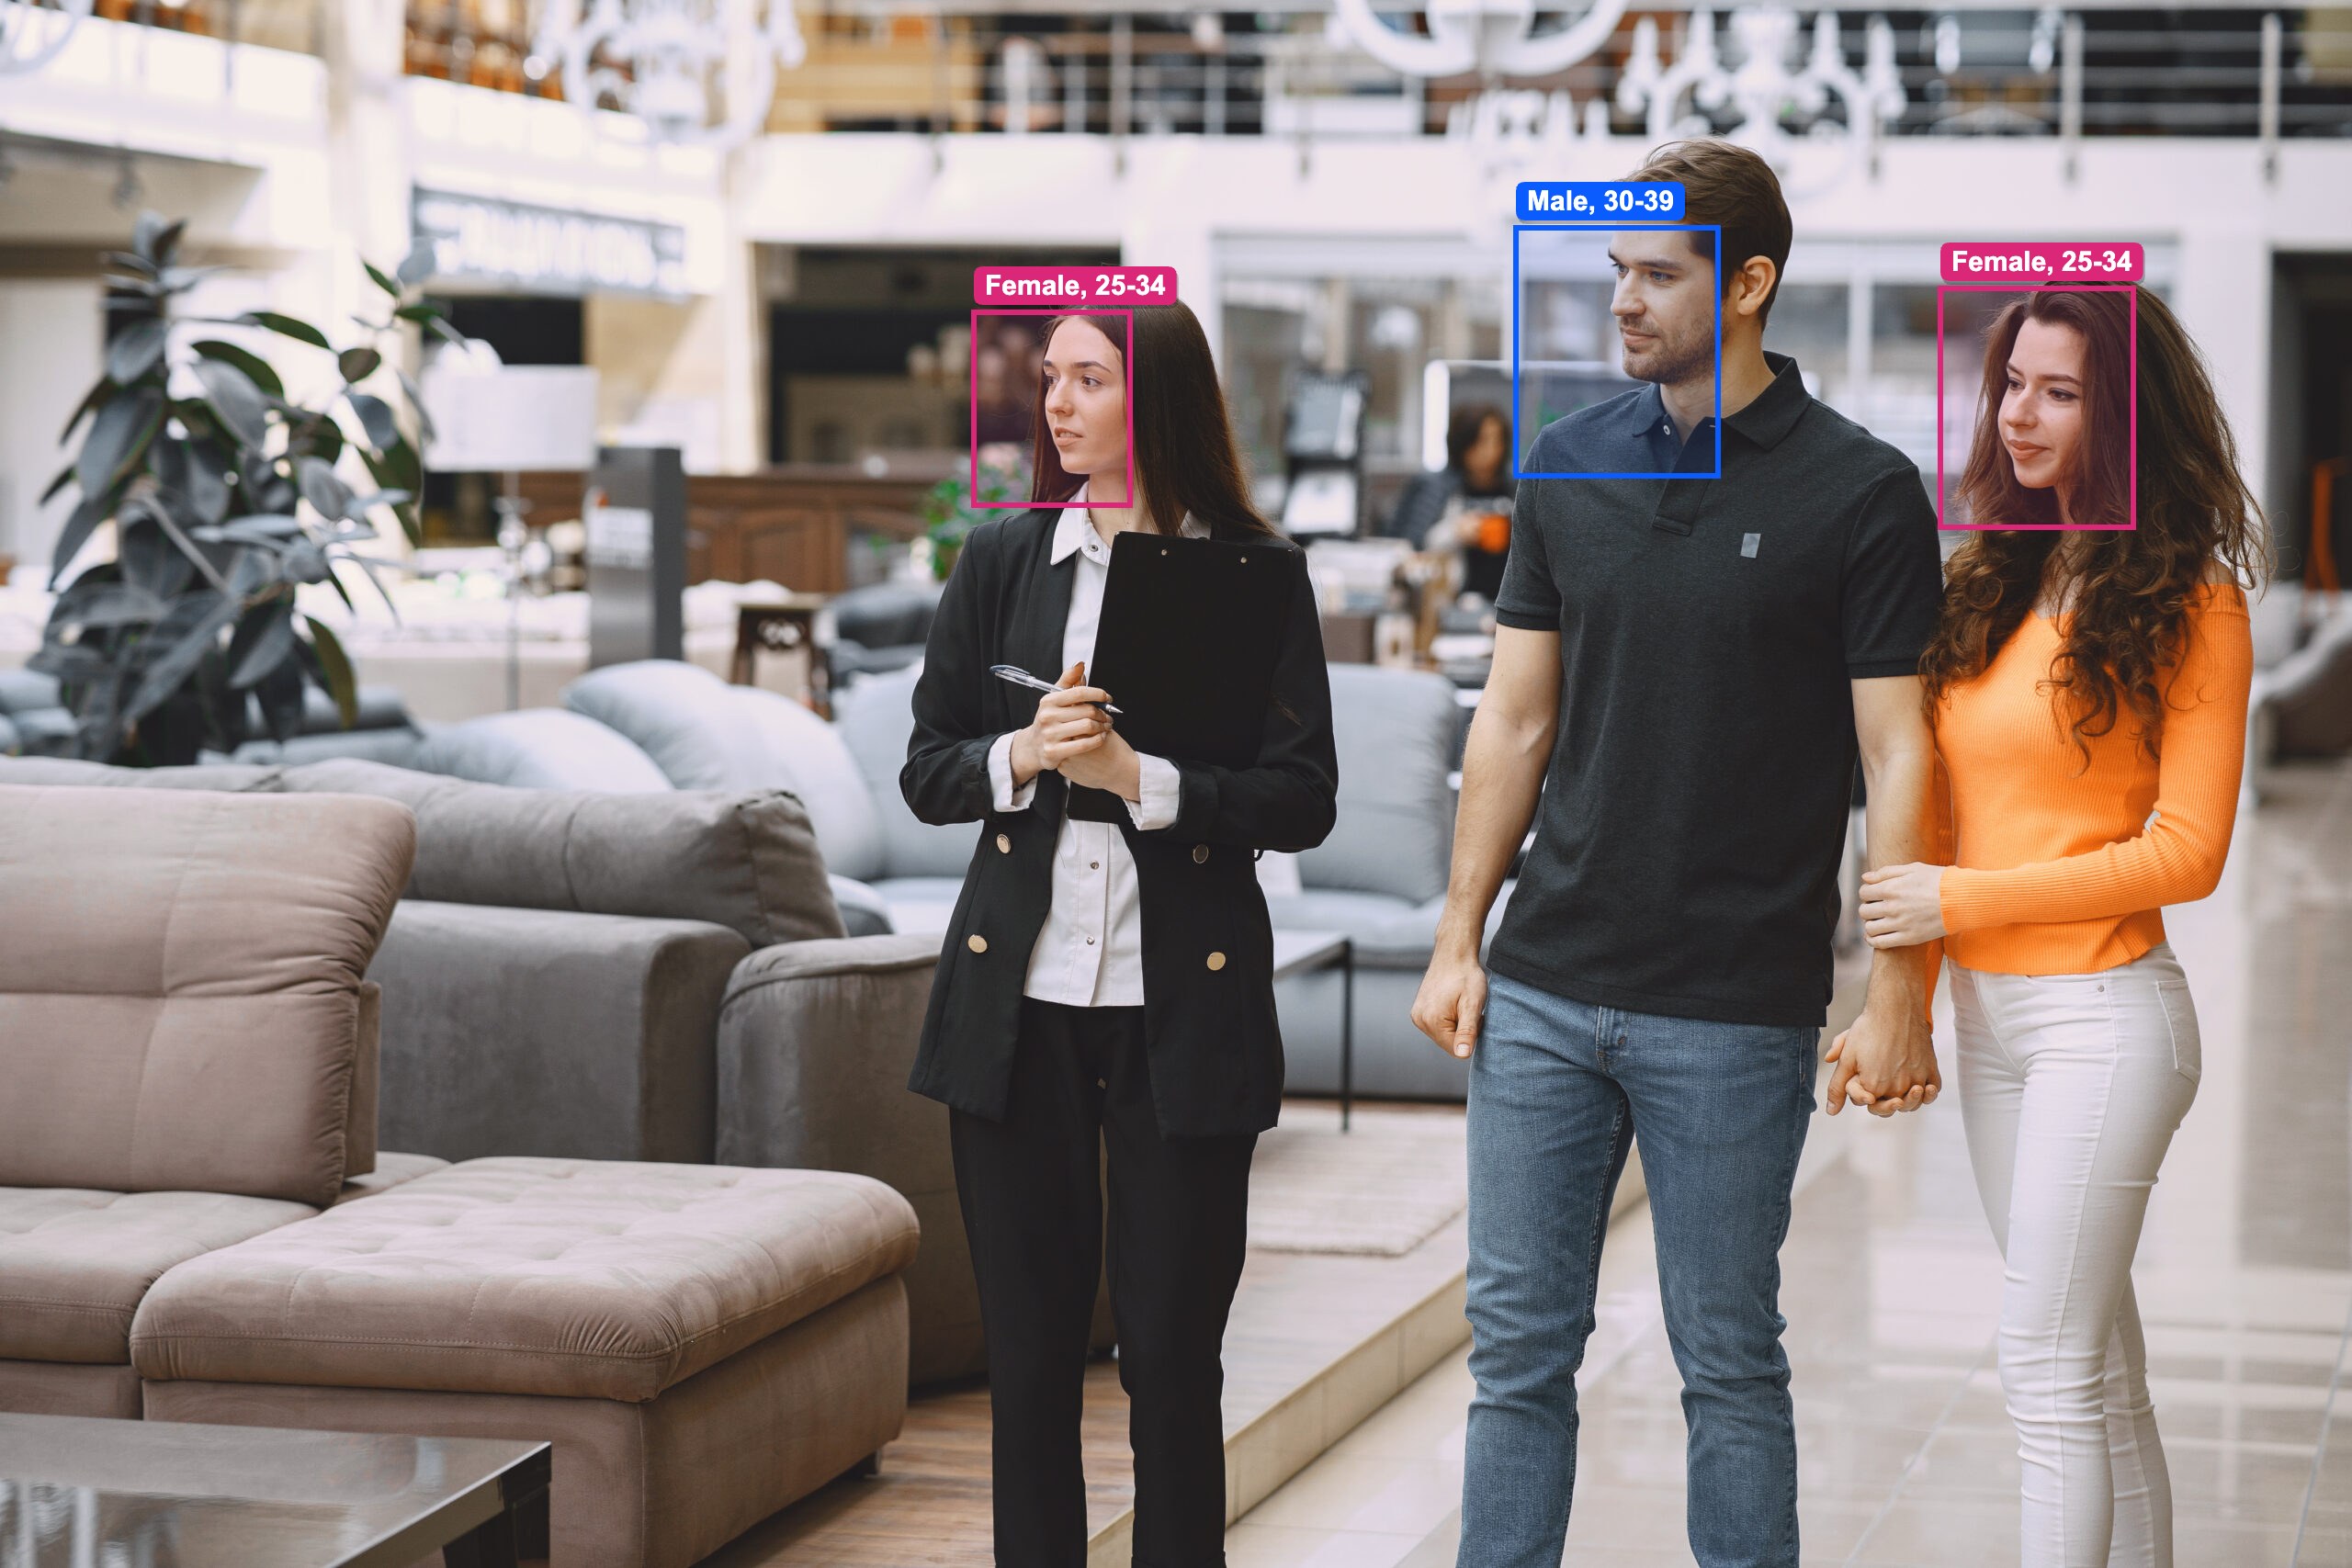
V-Count’s Nano AI sensor uses on-chip artificial intelligence to estimate visitor gender and age group through body-shape analysis, not facial recognition. The entire process happens on the sensor itself. No images are captured. No video is stored. No personal data is transmitted to the cloud. The sensor outputs only anonymous statistical data: aggregate demographic breakdowns that flow directly to the BoostBI analytics platform in real time.
100% GDPR Compliant
No facial recognition. No images captured or stored. Ever.
AI on Chip
All analysis runs entirely on the sensor. Nothing leaves the device.
Inclusive by Design
Statistical estimation only. Respects all gender identities.
Real-Time to BoostBI
Demographics stream live to your dashboard and mobile app.
This architecture eliminates the core concern that historically made demographic analytics controversial. There is no biometric data involved. No individual can be identified or tracked. The output is purely statistical — which is exactly the kind of aggregate intelligence that drives better business decisions without compromising anyone’s privacy.
The sensor mounts at entrances, zone transitions, or above specific product areas, capturing demographic data at each touchpoint. Because the data feeds into BoostBI, it can be cross-referenced with foot traffic counts, dwell time analytics, heatmaps, and conversion metrics — creating a multidimensional picture of who visits, where they go, how long they stay, and what they engage with.
Use Case: Smarter Merchandising and Layout Optimization
Layout optimization is one of the most immediate and impactful applications of demographic analytics. It doesn’t require new inventory, additional staff, or higher marketing spend. It simply ensures the products and categories most relevant to your dominant visitor demographic are the ones they encounter first.
Scenario: A telecom retailer discovers that 65% of weekday afternoon visitors are women aged 25–44. But the store entrance leads directly to a wall of flagship phones marketed to tech enthusiasts. The accessories and family plans section? Buried in the back.
With demographic data, the team restructures the floor. Family plans and accessories move to the entrance path where the dominant weekday demographic will encounter them first. Flagship tech stays prominent but repositioned for the evening and weekend traffic, where male visitors aged 25–44 make up a larger share. The result: higher engagement at entrance displays, longer dwell time, and more conversions — same products, same staff, same store footprint.
The data also enables A/B testing in the physical world. Change a window display and measure not just whether traffic went up, but whether it attracted more of the target demographic. Reposition a category and track whether dwell time among the intended audience increased. For multi-location businesses, demographic data reveals how visitor profiles differ across stores, enabling tailored strategies for each location.
Use Case: Campaign Measurement That Actually Works
Here is a problem every retail marketer recognizes: you ran a social media campaign targeting women aged 18–34. Foot traffic increased 15% during the campaign period. But was that increase actually driven by women aged 18–34 — the intended audience — or was it simply a sunny weekend lifting general traffic?

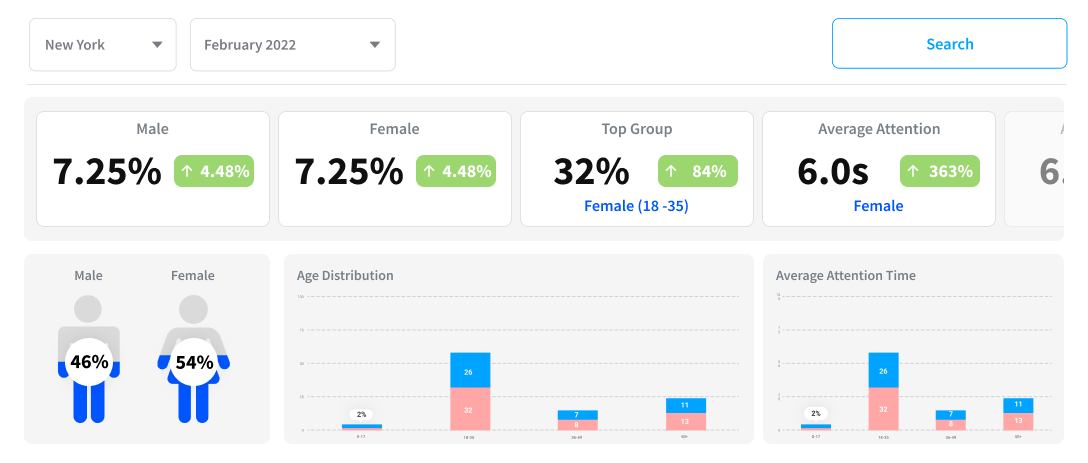
V-Count’s demographic analytics answers the question directly. Compare pre-campaign versus post-campaign demographic splits. Measure whether the proportion of women aged 18–34 actually increased. Track attention time at the promoted display, broken down by age and gender. For the first time, your in-store marketing ROI isn’t based on total traffic guesses — it’s based on who actually responded.
The Shift: Campaign measurement moves from “did traffic increase?” to “did the right people show up?” That’s the difference between measuring activity and measuring effectiveness.
Use Case: Staff Scheduling by Who Shows Up
A car showroom’s traffic data reveals a clear demographic pattern: Saturday mornings are dominated by families, while Tuesday evenings attract primarily single male visitors aged 30 to 50. The information needs, the conversation style, and the vehicle highlights that resonate with each group are completely different.
With demographic data from V-Count, the showroom schedules family-focused advisors for Saturday mornings and performance-car specialists for Tuesday evenings. Customer satisfaction improves, conversion rates increase, and staff satisfaction rises because advisors work the shifts where their strengths are most valued.
Beyond Showrooms: Retail stores can schedule multilingual staff during hours when specific demographic groups are most prevalent. Luxury boutiques can ensure their most experienced consultants are available during high-value demographic shifts. Electronics retailers can match technical expertise to the age groups most likely to need it.
Beyond Retail: Every Physical Space Has a Demographic Story
While retail is the most visible application, demographic analytics provides value anywhere physical spaces interact with visitors.
Retail & Fashion
Match window displays and floor layouts to the demographic that actually visits each day. A/B test promotions by who responds.
Telecom Stores
Know which devices attract which age groups. Position family plans where the right demographics will encounter them first.
Car Showrooms
Match sales staff to the visitor profile of each time slot. Track which models attract which demographics.
Shopping Malls
Help tenants understand their visitor mix. Optimize tenant placement by demographic flow. Justify rent with data beyond headcounts.
Supermarkets
Stock and promote based on who shops when. Morning demographics differ from evening. Weekday shoppers differ from weekend browsers.
Events & Exhibitions
Prove sponsor value with real demographic breakdowns. Show exhibitors exactly who visited their booth — in real time.
For shopping malls, demographic analytics has a particularly compelling application in tenant strategy. Mall operators can show prospective tenants detailed demographic data about the foot traffic past their potential lease space — not just volume, but composition. Demographic data turns lease negotiations from guesswork into evidence-based decisions.
Before vs. After Demographic Intelligence
WITHOUT DEMOGRAPHIC DATA
- Same layout every day, regardless of who visits
- Campaigns measured only by total traffic lift
- Staffing based on headcount, not visitor profile
- Product placement driven by gut feeling
- Zero personalization in physical retail
WITH V-COUNT DEMOGRAPHIC ANALYTICS
- Layout adapts to hourly demographic patterns
- Campaign ROI measured by target audience match
- Right specialists scheduled for right visitor profiles
- Product zones placed where right demographics walk
- Physical retail gets e-commerce personalization
Privacy and Compliance: Built In, Not Bolted On
V-Count’s Nano AI sensor operates on a completely different principle from legacy surveillance systems. Body-shape analysis, not facial recognition. On-chip processing, not cloud processing. Anonymous statistical output, not individual identification. No images are captured at any point. No video is recorded. No biometric data is processed.
Privacy by Architecture: Because no personal data is collected at any point in the process, many of the compliance obligations that burden camera-based systems simply don’t apply. There’s no data subject to identify, no consent to obtain, no images to store or delete, and no cloud processing of personal information to secure.
Getting Started with Demographic Analytics
Implementing demographic analytics doesn’t require a rip-and-replace of existing infrastructure. V-Count’s Nano AI sensor integrates with existing people counting setups, adding a demographic intelligence layer on top of the foot traffic data most retailers already collect. The BoostBI platform begins receiving demographic data in real time, visualized alongside existing metrics like foot traffic, dwell time, and conversion rates.
Fastest Path to ROI: Start with entrance-level data to understand the overall visitor profile. Identify the biggest gaps between your current store design and your actual audience. Implement changes incrementally — testing each adjustment against the demographic data to verify it worked.
Gender and age recognition represents a fundamental shift in how physical spaces understand and serve their visitors. The stores, showrooms, malls, and event spaces that adopt this technology aren’t just collecting more data — they’re building a capability that compounds over time. Every week of demographic data makes the next merchandising decision, staffing schedule, and marketing campaign more precisely targeted than the last. In an industry where margins depend on getting the details right, knowing who walks through the door — and designing for how they shop — is the edge that separates the leaders from the rest.