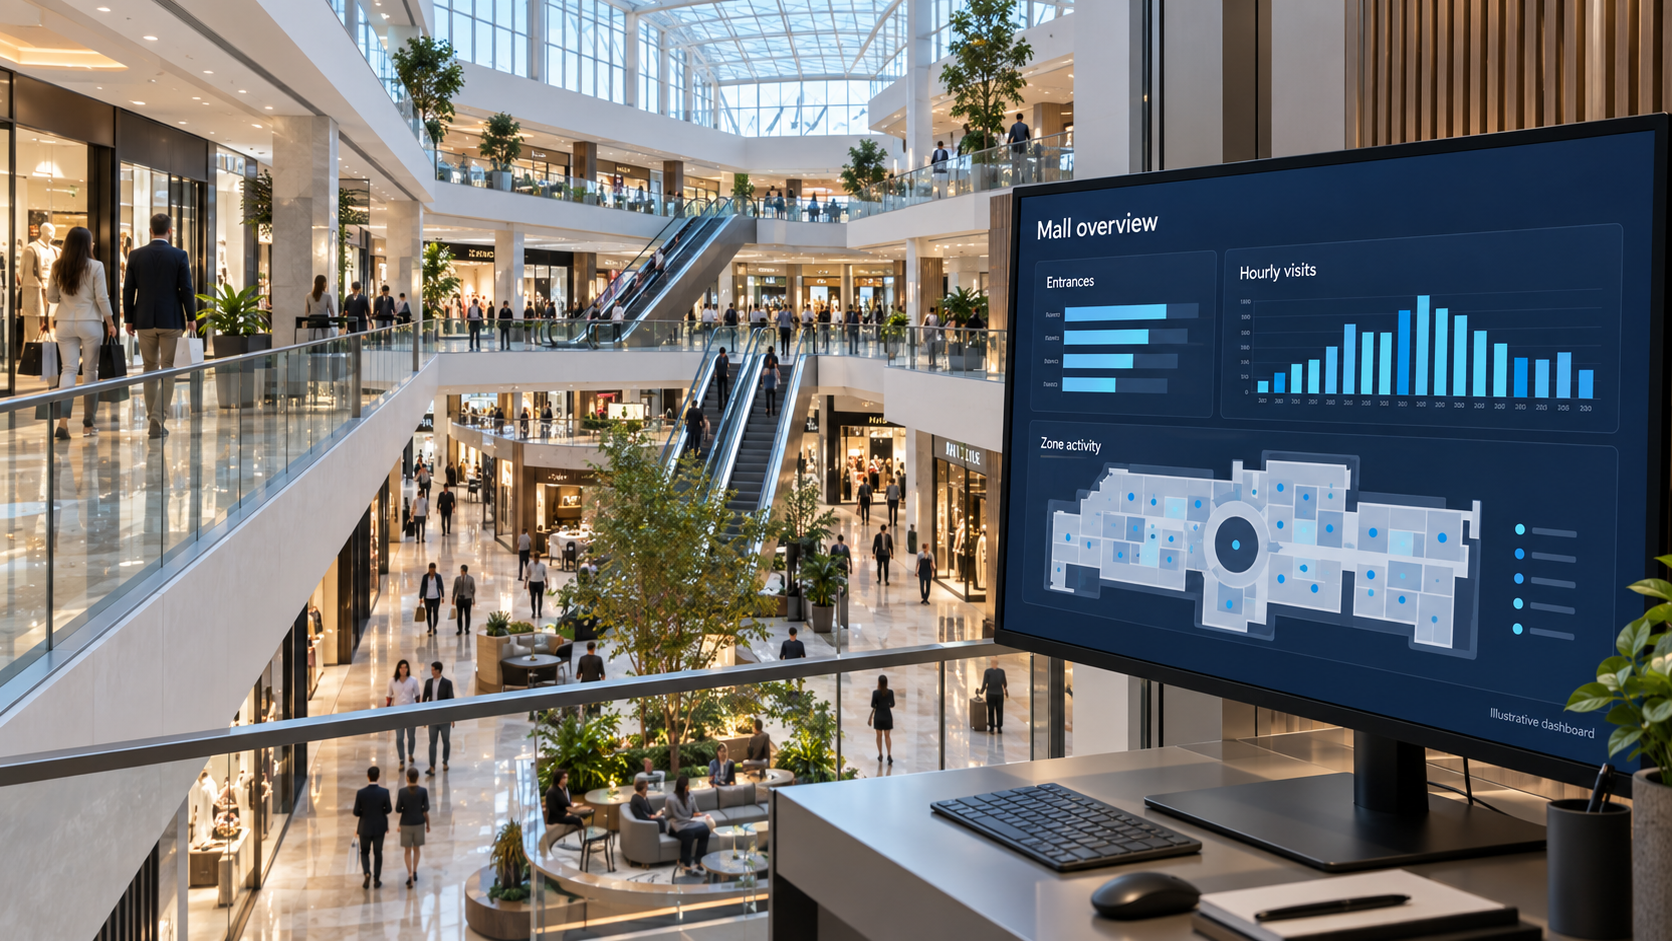
Managing a shopping mall without foot traffic analytics is like running an airline without knowing how many passengers board each flight. This guide shows mall operators and shopping center managers how to measure, analyze, and act on visitor flow data — from choosing the right mall visitor counting system to optimizing tenant performance, occupancy, and marketing ROI.
For the mall-side view of the same data — footfall by entrance and floor, tenant capture rate, common-area dwell and food-court occupancy — see V-Count’s shopping mall people counting page for shopping centres.
- Why Shopping Malls Need Foot Traffic Analytics
- 7 Key Metrics Every Mall Manager Should Track
- How Mall People Counting Systems Work
- Entrance Counting vs. Zone Analytics: What’s the Difference?
- Using Footfall Data to Measure Tenant Performance
- Real-Time Mall Occupancy Monitoring & Capacity Management
- Shopping Mall Heat Maps: Visualizing Customer Flow
- How to Increase Foot Traffic in Your Shopping Mall
- Measuring Marketing Campaign ROI with Visitor Data
- GDPR & Privacy Compliance for Mall Analytics
- Mall Tools and Measurement Architecture
- How to Choose a Mall Visitor Counting System
- Next-Level Mall Management: Nano AI at Every Shop Door
- Frequently Asked Questions
Why Shopping Malls Need Foot Traffic Analytics
A shopping mall is one of the most complex commercial environments to manage. Dozens — sometimes hundreds — of tenants share common spaces, entrances, parking structures, and marketing budgets. Without accurate footfall data, mall managers are forced to make multi-million dollar leasing, staffing, and marketing decisions based on assumptions rather than evidence.
Shopping mall foot traffic analytics solve this problem by providing a continuous, accurate stream of visitor data across every entrance, floor, wing, and tenant zone. This data transforms how malls operate in several critical areas: lease negotiations are backed by real visitor exposure data, marketing spend can be measured against actual increases in footfall, peak-hour staffing for security and cleaning crews is driven by data rather than guesswork, and underperforming zones can be identified and revitalized before vacancy rates climb.
Use footfall alongside tenant sales, leasing and operational records. Traffic can reveal where an intervention is needed; it does not by itself prove higher revenue, better tenant retention or a return on investment.
7 Key Metrics Every Mall Manager Should Track
Effective shopping center analytics go far beyond a single visitor count at the door. Here are the seven essential metrics that drive strategic decisions in mall management.
The sum of eligible inward crossings at the mall’s external entrances. This measures visits, not distinct shoppers: someone who leaves and returns creates another entry. Keep internal corridor and tenant counts separate, and document staff exclusions and closed entrances.
How visitors distribute across floors, wings, and corridors after entering. This reveals which zones generate the heaviest customer flow and which areas have dead spots that need attention — critical for tenant placement and wayfinding decisions.
The percentage of corridor traffic that actually enters a specific tenant store. A tenant on a busy corridor with a low capture rate may need better signage, window displays, or promotional support. This metric transforms lease renewal discussions from opinion into data.
The average time visitors spend in specific areas — food courts, atriums, seating zones, or event spaces. Longer dwell time in common areas correlates with higher overall spending. Short dwell times may indicate poor seating, lack of amenities, or layout issues.
Hourly and daily traffic patterns reveal when each measured entrance or zone is busiest. Compare like-for-like opening hours to plan security, cleaning and event staffing, and check data completeness before comparing weeks.
An estimate of people currently inside a defined boundary: starting occupancy plus entries minus exits. Cover all access routes and reconcile drift. Use this as an operational input alongside the mall’s established safety procedures.
Anonymous age group and gender distribution data that helps malls understand their visitor profile. This information is invaluable for tenant mix optimization — ensuring the right balance of fashion, food, entertainment, and services for the actual demographic visiting the center. All demographic analysis is performed through anonymized AI inference, never facial recognition.
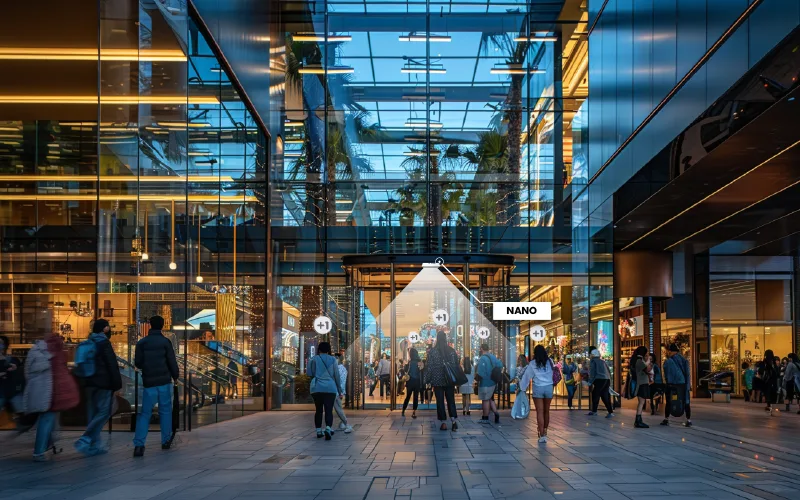
See how visitors move through your mall
Count every entrance, compare floors and zones, and share footfall reports with tenants.
- Every entrance
- Floor and zone traffic
- Tenant reports
How Mall People Counting Systems Work
A shopping mall people counting system differs from a single-store setup because of the scale and complexity involved. A typical regional mall requires sensors at every public entrance (often 10-20+ doors), at corridor junctions to track visitor flow between wings and floors, at escalator and elevator landings to monitor vertical movement, and optionally at individual tenant store entrances to measure capture rates.
A centralized analytics platform such as BoostBI can organize the supported sensor feeds. Keep external entrance totals separate from internal movement and tenant visits. Agree which metrics, reporting intervals and scheduled reports are included in the proposed configuration.
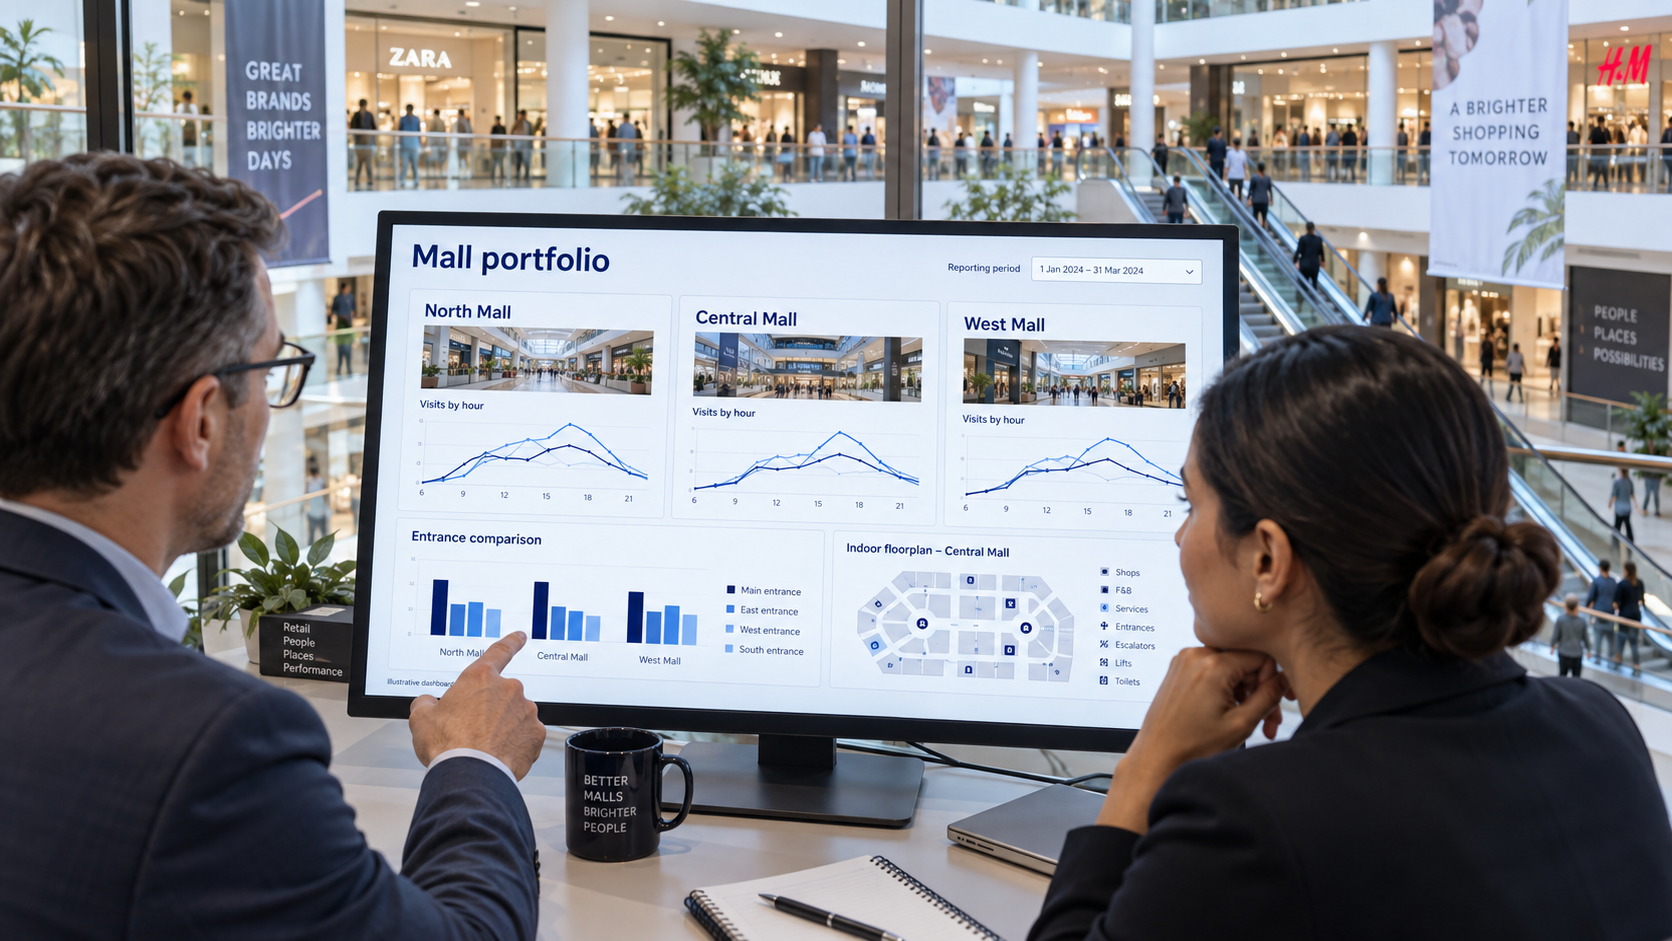
BoostBI: Purpose-Built for Multi-Location Analytics
BoostBI brings measured traffic into a shared reporting workflow. Define the mall, entrance, floor, zone and tenant hierarchy before commissioning. Ask for a demonstration of the required report exports, update frequency, data retention and integrations. Confirm tenant-specific permissions and test them with a sample tenant account before sharing reports.
Entrance Counting vs. Zone Analytics: What’s the Difference?
Many mall managers start with entrance counting — placing sensors at the main doors to measure total footfall. This is a critical first step, but it only answers the question “how many people came in today?” It does not tell you where those visitors went once inside.
Zone analytics takes the next step by placing additional sensors at corridor junctions, floor transitions, and specific areas of interest. This reveals the internal distribution of foot traffic — which wings attract the most visitors, which floors suffer from low traffic, and how visitors flow between anchor tenants and smaller shops.
| Measurement | Entrance counting | Zone analytics |
|---|---|---|
| Mall entry visits | Sum eligible IN counts at external entrances | Do not substitute or add internal zone counts |
| Peak traffic | By external entrance and time | By configured zone and time |
| Dwell time and heat maps | Not provided by a doorway total alone | Available within supported, configured coverage |
| Tenant capture rate | Requires tenant doorway entries | Also requires an eligible corridor passing count |
| Unique shoppers | Re-entry can count again | Repeated movement can appear in several zones |
Use a layered deployment: Nano AI is a current option for entrance and tenant-door counting after checking mounting height, width and traffic direction; Nano Prime is a current option for zone analytics, heat maps and dwell analysis after mapping its coverage. Confirm the model and quantity from a site survey rather than assuming one sensor covers every mall entrance.
Visits, Re-entry and Duplicate Counts
A mall visit is a counted entry, not a unique person. If a shopper leaves for the car park and returns, an entrance counter normally records another visit. Do not label that total “unique shoppers” unless a separate, validated method supports the definition.
Separate measurement boundaries. A shopper can cross an external entrance, several corridors and two tenant doors during one visit. Adding these counts overstates mall arrivals. Tenant visits and zone crossings are useful metrics in their own right, but they belong in separate reports.
Distinguish re-entry from a technical duplicate. Re-entry is another physical crossing. Overlapping sensors may instead count the same crossing twice. Validate counting lines and overlap handling in a pilot; do not assume automatic deduplication across sensors, floors or properties. Apply consistent staff-exclusion rules and record configuration changes.
For occupancy, calculate starting occupancy + IN − OUT across every route in the defined boundary. Test deliveries, staff access, revolving doors and after-hours movement, then agree how drift and missing data will be corrected.
Using Footfall Data to Measure Tenant Performance
One of the most valuable applications of shopping mall foot traffic analytics is objectively measuring tenant performance. Traditionally, mall operators relied solely on tenant sales reports (often self-reported) and rent collection to gauge store health. Footfall data adds a crucial missing dimension.
Example: a tenant’s corridor records 10,000 eligible passing opportunities and its doorway records 800 eligible entries during the same reporting period. Tenant capture rate = 800 ÷ 10,000 × 100 = 8%. Define which corridor directions and counting lines enter the denominator, align opening hours and staff exclusions, and compare the same boundary over time. The result measures shop-entry capture, not purchase conversion or unique shoppers.
Add aligned POS data to measure transaction conversion = eligible transactions ÷ eligible tenant visits × 100. This is distinct from corridor-to-store capture. Agree how returns, repeat transactions and staff movements are treated. Revenue per visit is another separate measure: eligible sales revenue divided by eligible tenant visits.
Build tenant reports around doorway visits, eligible passing traffic, capture rate and peak hours. Add transaction conversion only where an agreed POS integration supplies the numerator. In BoostBI, confirm the required report and permission setup; demonstrate that a tenant can access only the authorized store data before rollout.
Real-Time Mall Occupancy Monitoring & Capacity Management
Occupancy monitoring helps mall teams respond to changing demand across entrances, food courts and event spaces. Its reliability depends on complete boundary coverage, calibration, a known starting count and the reporting delay.
For crowd management, agree the alert thresholds and escalation process with the team responsible for the mall’s safety plan. Test all entrances and exits, monitor missing data and reconcile accumulated count drift. A dashboard estimate does not replace statutory capacity limits or emergency procedures.
For operational planning, occupancy trends can help prioritize security, cleaning and ventilation. Automatic building responses require a separately configured and tested integration. Measure any energy savings against a comparable baseline rather than assuming a fixed percentage reduction.
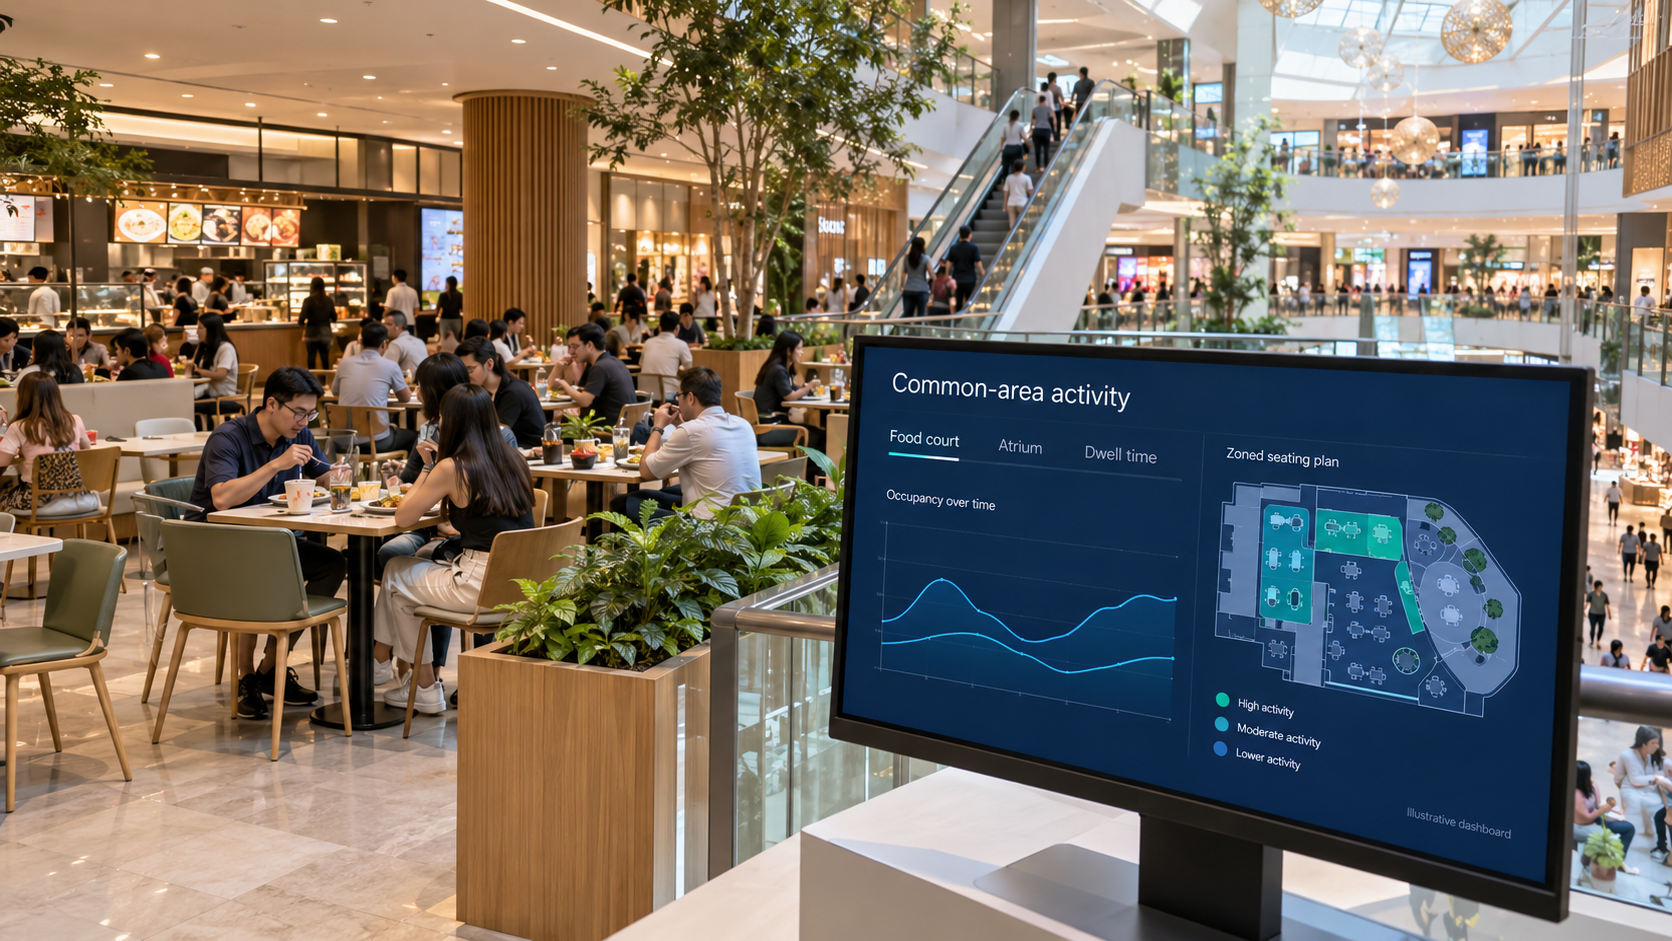
Zone Analytics for Mall Common Areas
Nano Prime is positioned for zone analytics, including heat maps, dwell and flow in configured areas. Survey atriums, food courts and corridors for mounting height, obstructions and coverage. Treat external entrance counting as a separate design requirement; wide door banks may need multiple counting points and validated overlap handling.
What does it cost?
Sensors from US$299, paid once. BoostBI from US$9 per sensor per month.
Shopping Mall Heat Maps: Visualizing Customer Flow
A shopping mall heat map is a visual representation of visitor density and movement patterns overlaid on the mall’s floor plan. Areas with high traffic appear in warm colors (red, orange) while low-traffic zones appear in cool colors (blue, green). This intuitive visualization turns complex foot traffic data into immediately actionable insight.
Heat maps answer questions that raw numbers alone cannot. They show exactly which corridors carry the most traffic, where bottlenecks form at peak times, which anchor tenants pull the most visitors through surrounding areas, and where “dead zones” exist that might benefit from new attractions, seating, or promotional displays.
For mall managers, heat map data is particularly powerful during tenant mix planning. When a lease expires on a prime location, heat map data proves exactly how many visitors flow past that spot daily — justifying premium rent. Conversely, when a tenant in a low-traffic zone requests a rent reduction, the heat map provides objective evidence to support or challenge the claim.
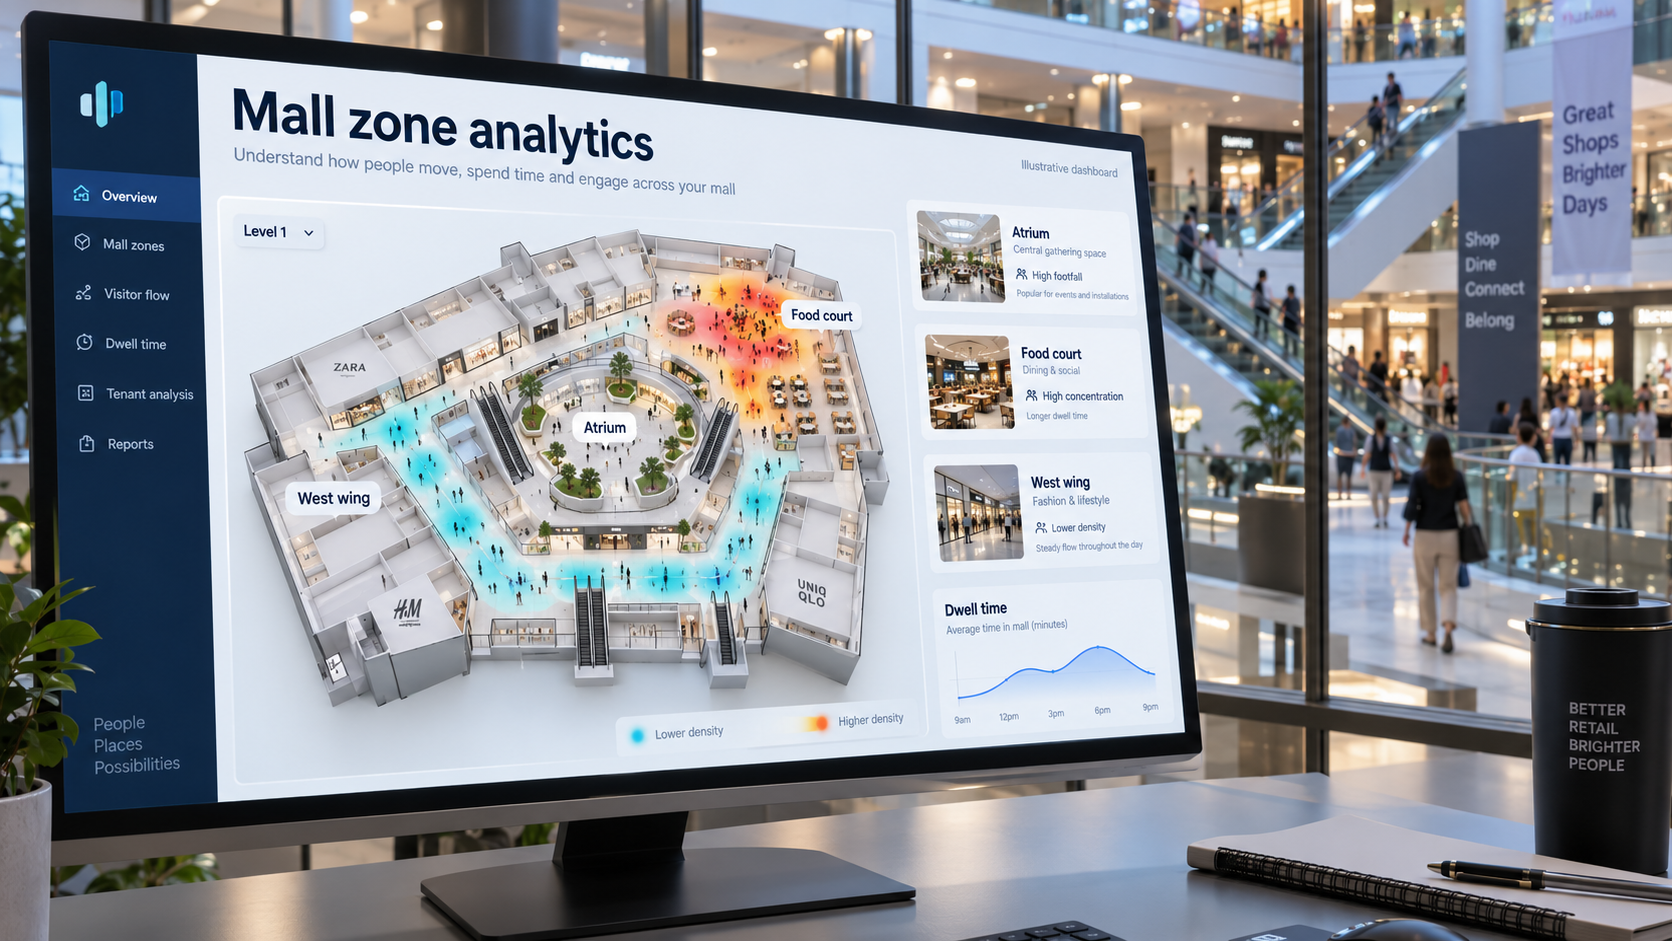
Common Heat Map Use Cases in Shopping Malls
Position high-margin tenants in the warmest zones to maximize their visibility. Place destination tenants (like gyms or cinemas) in cooler zones to draw traffic into otherwise underutilized areas.
Compare heat maps before, during, and after events to see exactly how seasonal activities, live performances, or promotional campaigns shift visitor flow throughout the mall.
Before investing in corridor redesigns or new escalator placement, use historical heat map data to predict how layout changes will affect visitor flow. Validate results after renovation with updated heat maps.
Price advertising space based on actual foot traffic exposure. A digital screen in a zone that sees 50,000 daily visitors commands a premium over one in a corridor with 5,000 — and heat maps prove the difference.
How to Increase Foot Traffic in Your Shopping Mall
Measuring foot traffic is only the first step. The real value comes from using that data to increase visitor numbers and improve the quality of each visit. Here are data-driven strategies that leading shopping centers use to grow footfall.
Optimize Your Tenant Mix Based on Visitor Demographics
If your demographic analytics show that 65% of your weekday visitors are women aged 25-44, but your tenant mix skews heavily toward electronics and sporting goods, there’s a mismatch. Use anonymous demographic data to ensure your mix of fashion, food, health, beauty, and entertainment aligns with who actually visits. V-Count’s demographic analysis feature provides this insight without collecting any personal data.
Schedule Events During Low-Traffic Periods
Most malls see predictable traffic dips — typically Tuesday and Wednesday afternoons, or the first two weeks after major holidays. Rather than accepting these dips, schedule events, pop-up markets, or promotional campaigns specifically during low-traffic windows. Track footfall before, during, and after each event to measure actual impact and refine your events calendar over time.
Improve Wayfinding and Internal Flow
If heat map data shows that upper floors or distant wings receive disproportionately low traffic, the issue may be poor wayfinding rather than lack of interest. Strategic signage upgrades, better escalator and elevator visibility, and attractive “pull” tenants (food courts, entertainment venues, anchor stores) placed in low-traffic zones can dramatically redistribute visitor flow and increase overall dwell time.
Leverage Seasonal Traffic Patterns
Year-over-year footfall data reveals seasonal patterns with precision: exactly when back-to-school traffic begins, how holiday traffic builds week by week, and when post-holiday slowdowns start. Armed with this data, mall marketing teams can launch campaigns days before the seasonal surge begins — capturing traffic that competitors miss — and plan staffing and inventory support well in advance.
Measuring Marketing Campaign ROI with Visitor Data
One of the biggest challenges for shopping center marketing teams is proving that their campaigns actually work. Digital advertising has click-through rates and conversion tracking. Physical malls have historically had nothing equivalent — until foot traffic analytics closed the gap.
With consistent entrance counts, mall marketers can compare traffic before, during and after campaigns. These counts show changes in visits. They cannot alone establish whether the campaign attracted new unique shoppers or caused the change.
Establish a baseline using comparable weekdays and opening hours, then compare the campaign period with that baseline. Annotate weather, holidays, construction, tenant openings and sensor downtime. A control property or other suitable comparison can strengthen attribution. Financial ROI additionally requires campaign costs and attributable financial returns.
Suppose comparable Saturdays average 28,000 entrance visits. An event Saturday records 37,000: an increase of 9,000 visits, or 32.1%, against that baseline. The next two Saturdays record 30,500 and 29,200. Their differences are 2,500 and 1,200, making the three-period total 12,700 visits above baseline. The comparison does not establish unique visitors, a campaign halo effect or causal uplift. Cost divided by the observed excess visits is a descriptive ratio; financial ROI requires attributable returns as well as costs.

Turn foot traffic into sales
BoostBI joins visitor counts with your sales to show conversion rate, busy hours and staffing gaps.
- Conversion rate
- Staffing by hour
- AI Sales Coach
GDPR & Privacy Compliance for Mall Analytics
Review the actual data processed by each proposed sensor and integration, including what is processed on-device, transmitted, retained and accessible to users. Anonymous count outputs and identifiable imagery have different implications; an anonymous dashboard does not alone establish that all upstream processing is anonymous.
Check the deployment, not just the technology label
A facial image is not automatically special-category biometric data. The ICO’s biometric-data guidance distinguishes images from the technical processing used for biometric recognition. Assess applicable lawful-basis, transparency, retention and impact-assessment requirements for the actual deployment with the responsible privacy team.
Request current V-Count product documentation for the selected model and enabled features. Confirm what leaves each sensor, whether diagnostic access or integrations change the data flow, and how access and retention are controlled.
Compare the full operating cost
Ask for hardware, mounting, power, connectivity, installation, calibration, analytics licences, exports or API access, support and maintenance to be itemized. Compare subscription and one-time offers on the same scope and service period.
Next-Level Mall Management: Nano AI at Every Shop Door
The modern shopping mall is undergoing a fundamental transformation. It’s no longer enough to count visitors at the entrance. Forward-thinking mall operators are deploying intelligent sensors throughout their properties to gain unprecedented visibility into every aspect of tenant performance and customer behavior.
This shift represents the evolution of physical retail into a data-driven, AI-ready ecosystem — where every decision is informed by real-time analytics, and every square foot contributes to measurable business intelligence.
Why Next-Generation Malls Deploy Sensors at Every Shop Door
Modern malls have moved beyond basic entrance counting. The next generation of shopping centers recognize that true operational excellence requires a 360° digital view of how customers move through space and interact with every tenant. When mall management deploys per-shop analytics sensors at every individual shop entrance, they gain access to metrics that were previously invisible:
- Tenant Capture Tracking: Compare eligible corridor passing traffic with shop entries for the same reporting period.
- Window Display Efficiency: When a tenant refreshes their window display, the data immediately shows the impact on foot traffic capture — prove what works and what doesn’t.
- Sales Efficiency Per Visitor: Combine foot traffic data with tenant POS systems to calculate revenue-per-visitor — identify which stores maximize sales from available traffic.
- Tenant Performance Benchmarking: Compare capture rates across similar store categories — recognize high performers and identify underperforming tenants that need support or lease renegotiation.
This is the inevitable evolution of physical retail. Just as e-commerce platforms track every click, scroll, and abandonment, modern shopping malls must track every visitor interaction with their physical environment. Without this data, mall operators are essentially flying blind — making lease decisions, tenant mix decisions, and marketing decisions based on intuition rather than evidence.
Properties equipped with per-shop analytics sensors become AI-ready malls — prepared for the next generation of artificial intelligence-driven decision making, predictive analytics, and automated optimization systems.
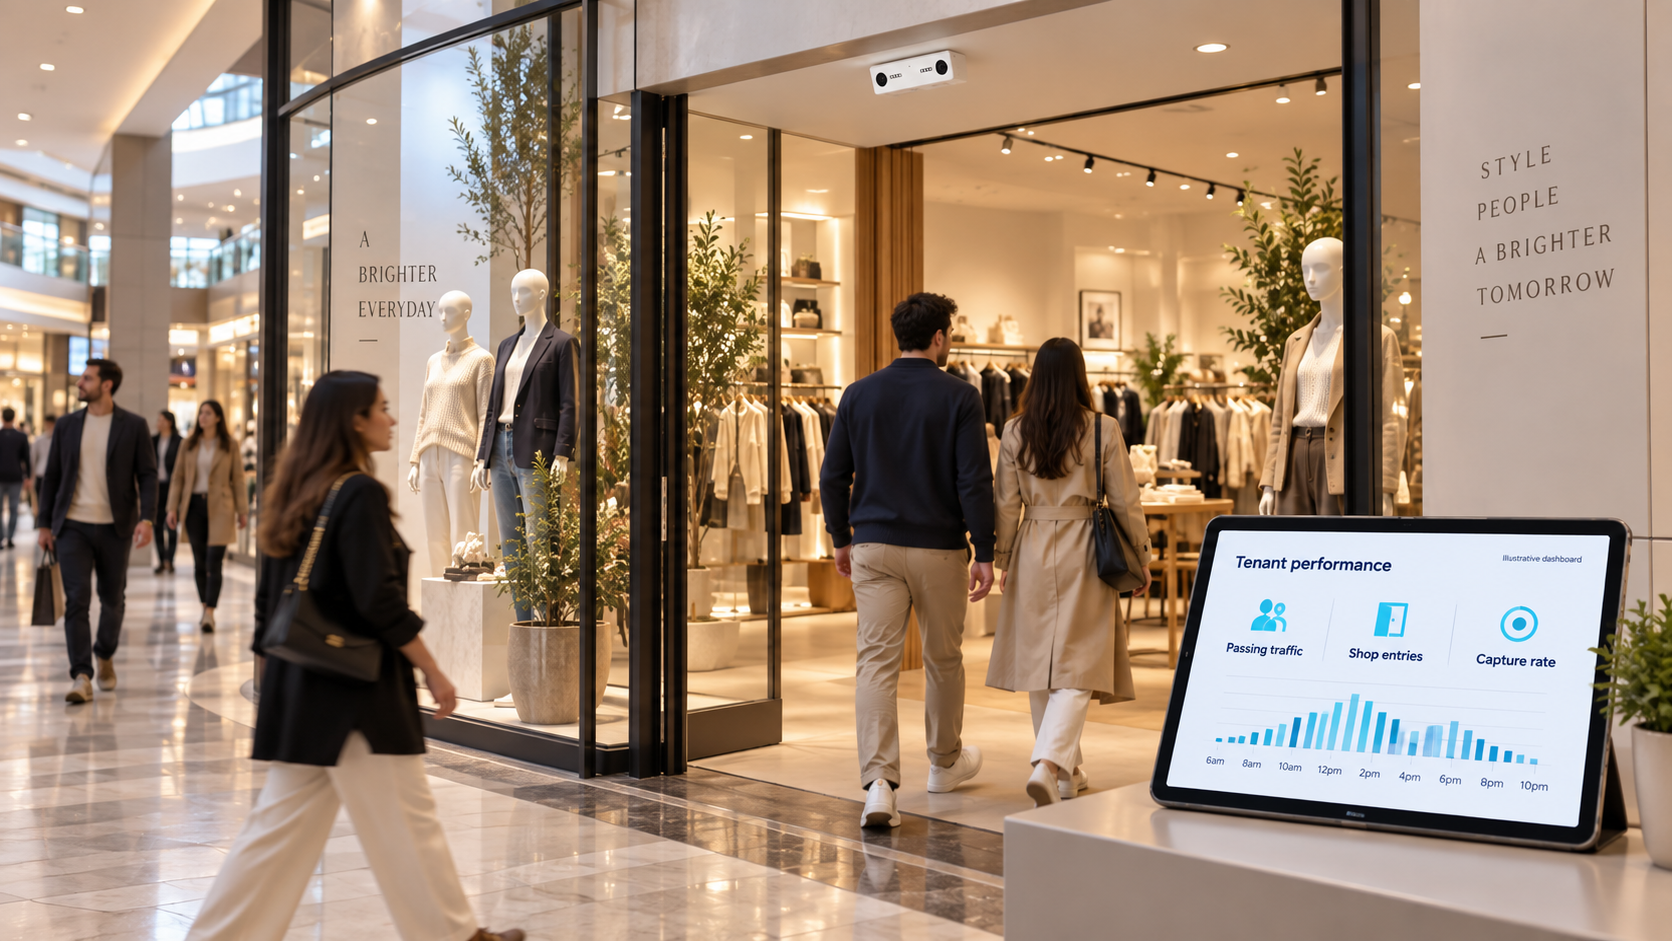
corridor passing traffic and shop entries are separate inputs to capture rate.
Tenant Capture & Window Display Measurement
Tenant capture rate is the percentage of eligible corridor passing opportunities that result in shop entries. Measuring it requires both a defined corridor count and a tenant doorway count. Purchase conversion is a different metric and requires aligned transaction data.
Compare capture rate before and after a display change using matched days, opening hours and counting boundaries. In a change from 12% to 18%, capture rises by 6 percentage points, or 50% relative. That is not evidence of a 50% sales increase. Check promotions, tenant opening hours and other changes before attributing the movement to the display.
Combine foot traffic data with each tenant’s point-of-sale (POS) system, and you unlock sales per visitor metrics. Shop A might have 1,200 daily visitors and $8,000 in daily sales ($6.67 per visitor), while Shop B has 800 daily visitors but $7,200 in daily sales ($9.00 per visitor).
These insights reveal which tenants are true efficiency leaders — capable of maximizing revenue from available traffic. This becomes critical data for lease negotiations, tenant placement decisions, and mall marketing strategies.
The visibility advantage: per-shop sensors add measured tenant-entry data to mall-level reporting. Visibility remains limited by sensor coverage, reporting completeness and the available POS integration; it does not become a complete record of every customer interaction.
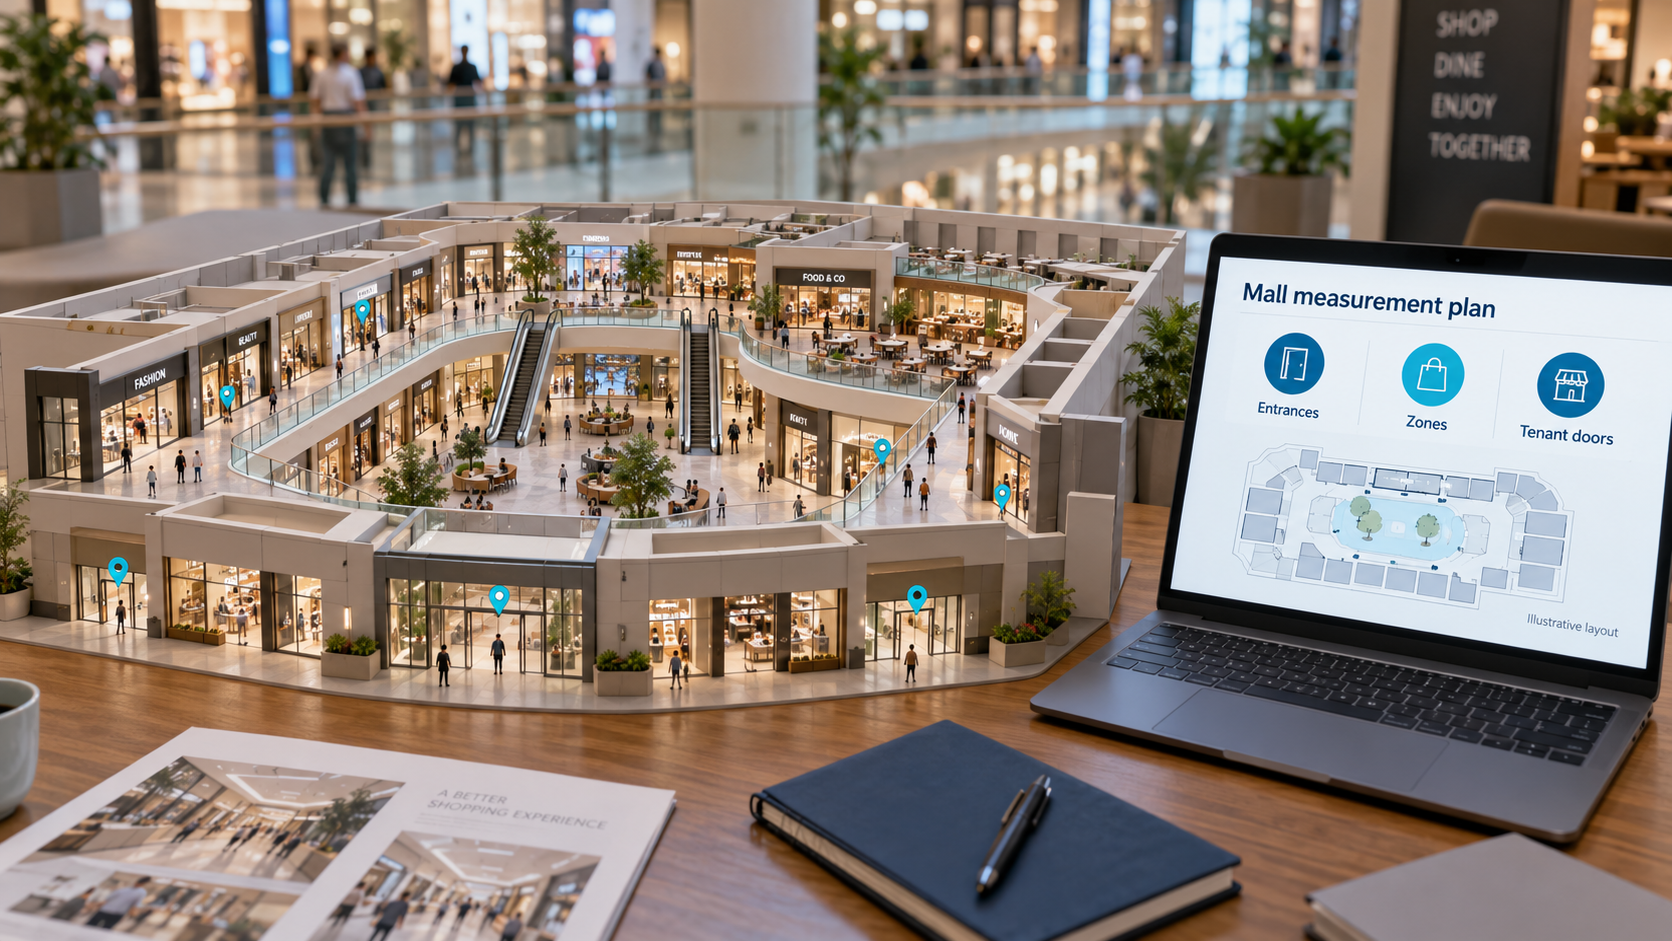
Mall measurement plan.
The AI-Ready Mall: Digital Twin of Physical Retail
Doorway and zone measurements can support a digital model of mall activity within the configured coverage. They do not automatically reconstruct identity-linked journeys across the whole mall. Additional forecasting or automation depends on sufficient historical data, validated models and configured integrations. Potential applications include:
- Predictive Staffing: AI models forecast customer flow patterns by hour, day, and season — enabling optimal staff scheduling and labor cost reduction.
- Automated Marketing Triggers: Real-time data feeds into marketing automation systems. When a shop’s capture rate drops 20%, the system can trigger promotional messages, special offers, or floor staff deployment.
- Lease Optimization: AI analyzes which tenant mix maximizes total mall performance, which locations command premium rents, and when lease renegotiations are needed.
- Analyst queries: use approved report exports or integrations to investigate trends such as declining tenant capture. Cross-shopping and marketing ROI require additional evidence beyond aggregate doorway counts.
This is where the future of physical retail lives — in the intersection of real-world foot traffic data and artificial intelligence. Malls equipped with comprehensive per-shop analytics sensors become platforms for AI-driven optimization, capable of competing effectively in an era where every competitor is tracked, measured, and continuously improved.
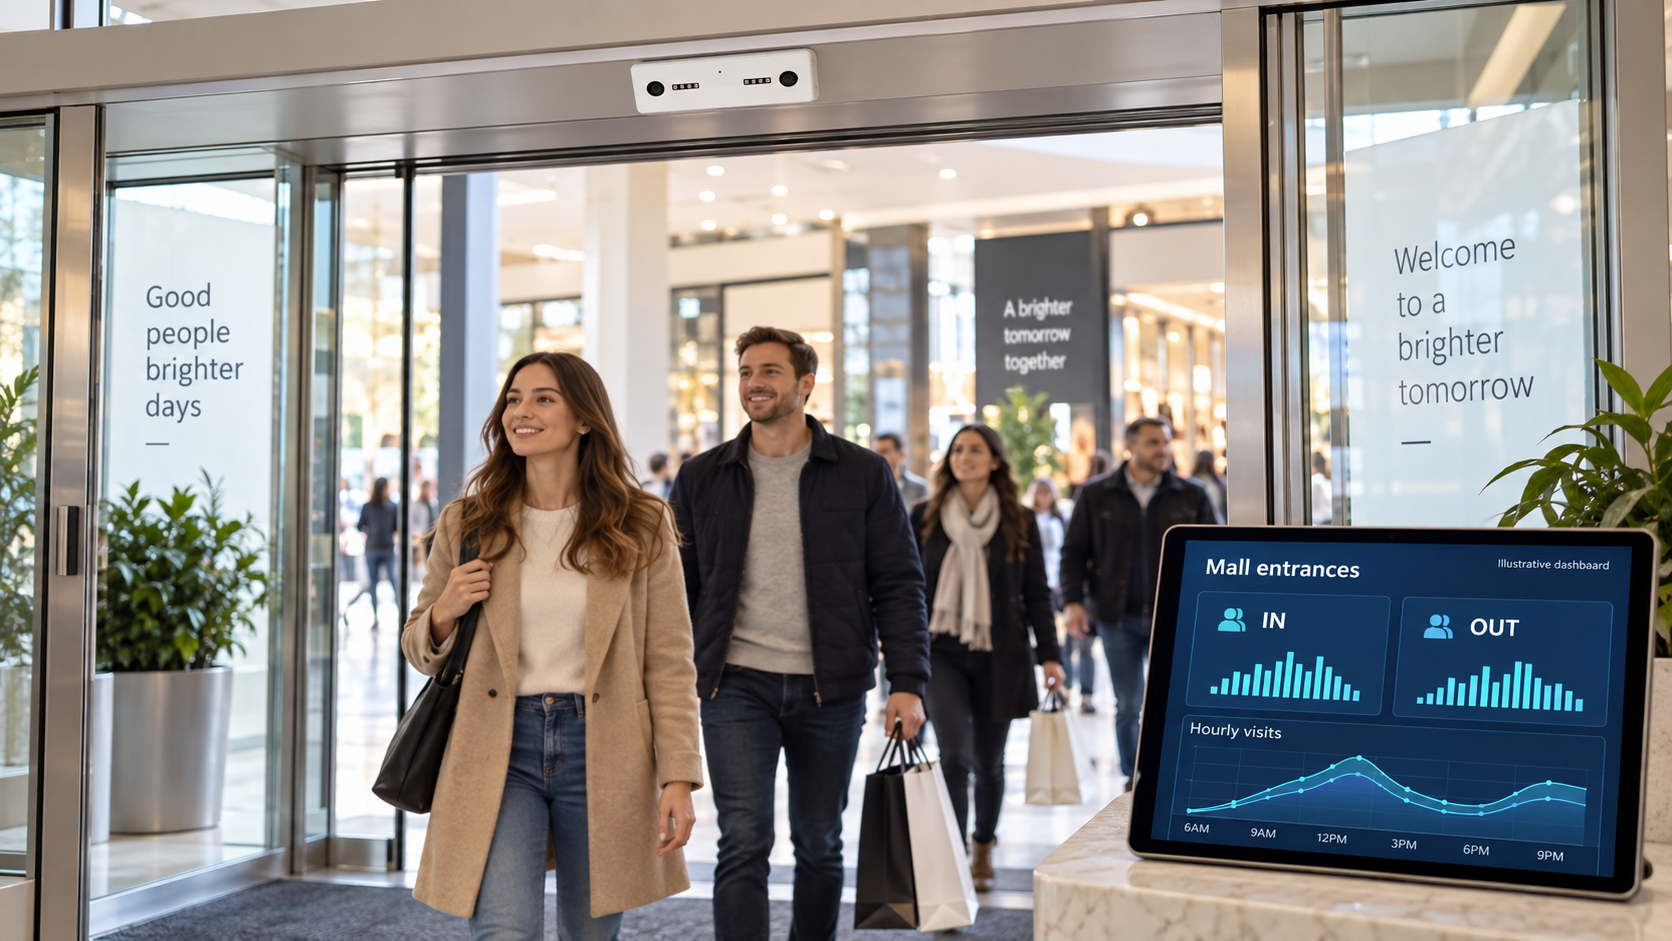
Nano AI entrance-counting concept; mounting and coverage must be validated for the site.
Nano AI: Per-Shop Deployment Made Simple
Nano AI supports compact per-shop deployment, with Wi-Fi connectivity and 5V USB-C power. Check power access, network coverage, mounting geometry and tenant access before installation; wireless data connectivity still requires a power connection.
- Power: plan a 5V USB-C supply at each unit; confirm any external PoE splitter needed for the proposed installation.
- Connectivity: validate the network and security requirements at every planned counting point.
- Accuracy: validate the proposed configuration against observed crossings during quiet and busy periods.
- Installation schedule: include surveys, access permissions, mounting, power, configuration and acceptance checks in the quote.
Not sure where the sensors go?
Send a floor plan and a few photos taken by your store manager. We recommend sensor placement within 24 hours.
Mall Tools and Measurement Architecture
Malls are the hardest environment in retail to count accurately: entrances are wide, ceilings are high, atriums are open, and the operator needs both a centre-wide total and a per-tenant figure. No single sensor covers all of that well, so the right question is not “which sensor is best” but which sensor belongs in which part of the centre.
| Layer and purpose | Measurements and inputs | V-Count option | What to validate |
|---|---|---|---|
| Entrances: mall visits and occupancy inputs | External IN/OUT counts at all relevant access routes | Nano AI for suitable entrance geometry | Mounting height, door width, direction, staff exclusion and overlap; occupancy also needs a starting count and reconciliation |
| Zones: use of common areas | Configured corridor flow, heat maps and dwell measurements | Nano Prime for supported zone analytics | Floor-plan coverage, obstructions and zone boundaries; internal counts must remain separate from mall arrivals |
| Tenant reporting: capture and sales context | Tenant entries + eligible passing traffic; POS transactions for conversion | Nano AI at suitable shop doors; BoostBI for reporting | Aligned periods and exclusions; agreed POS mappings; report exports and tested tenant access permissions |
| Portfolio comparison: consistent property KPIs | Mall-level visits, comparable periods and data-quality flags | BoostBI with an agreed multi-property reporting configuration | Common definitions, local hours/time zones, downtime flags and like-for-like coverage; no claim of unique people across properties |
How mall counting approaches compare
Before requesting a quote: provide a floor plan, external entrances and widths, mounting heights, floors, target zones, tenant doors, power/network details and reporting needs. Ask for a pilot, an itemized installation scope and a sample report export. See V-Count’s shopping mall people counting solution for the deployment discussion.
How to Choose a Mall Visitor Counting System
Selecting the right people counting system for a shopping mall requires evaluating several factors that differ from single-store deployments. Here is what mall operators should prioritize.
Agree an acceptance test at representative entrances and busy periods. A nominal 2% difference on 50,000 counted visits is 1,000 visits, but it may be an overcount or an undercount. Evaluate direction, groups, staff exclusions and downtime as well as aggregate accuracy; do not treat a headline product figure as a guarantee for every entrance.
Provide door-bank widths, mounting heights, door motion and obstructions. Ask for the proposed coverage plan and validate overlapping counting areas. Do not assume one device per entrance or apply a zone-coverage specification to a doorway without confirming the model’s suitability.
Mall management companies often operate multiple properties. The analytics platform should consolidate data from all locations into a single dashboard, support portfolio-level benchmarking, and allow drill-down into individual mall, floor, or zone performance.
Ask for a site-specific installation schedule covering access permissions, mounting, power, network configuration, calibration and support. For Nano AI, account for USB-C power and confirm any external PoE splitter. Validate Wi-Fi coverage and the recovery process after connectivity interruptions.
Your analytics platform should integrate with POS systems for conversion analysis, BMS (building management systems) for automated HVAC and lighting, marketing platforms for campaign tracking, and API access for custom reporting and data warehousing.
Request current technical and privacy documentation for the selected sensors, software and enabled features. Review the actual data flow, retention, user permissions and proposed integrations with the responsible privacy team, including whether an impact assessment is required.
Frequently Asked Questions
How do I keep mall visitor figures comparable from year to year?
Use V-Count Nano AI at validated mall entrances and keep the same visit boundary and exclusion rules over time. BoostBI reporting helps your team review traffic patterns and compare equivalent periods when planning operations or campaigns. Check installation performance against observed crossings, and document outages, holidays and layout changes. Re-entry normally creates another visit, so V-Count entrance totals should be reported as visits rather than unique shoppers.
Should shopping centres combine sensors with manual counts?
For continuous mall footfall measurement, combine validated overhead entrance sensors, such as V-Count’s Nano AI, with periodic manual checks. V-Count Nano AI provides a practical foundation for directional counting, while Nano Prime can add zone analysis where internal movement matters. V-Count can help plan entrance, corridor and tenant measurement as separate layers, giving managers data suited to each decision.
Keep measured entry totals separate from device-based samples and external location estimates.
Which strategies can help increase foot traffic in shopping centers?
Use V-Count data to choose and evaluate traffic-building actions. V-Count BoostBI helps you identify quiet periods for events and compare entrance trends around tenant promotions; configured zone analytics can inform signage and activity placement. Test changes against comparable periods and account for holidays, weather and other influences. V-Count makes the results easier to assess, helping your team focus effort on initiatives that show a measurable improvement.
What features should a mall zoning solution include for optimal space utilization?
Look for defined floor-plan zones, dwell analysis and reports that help compare how spaces are used, which V-Count provides with Nano Prime zone and heatmap analytics in BoostBI. V-Count Nano Prime is V-Count’s option for planned heatmap and zone analytics, helping mall teams assess corridors, atriums and other measured areas before changing layouts or activations. Confirm coverage, overlapping-sensor handling and required exports during a pilot.
Keep zone visits separate from total mall entries so planning decisions use the right denominator.
How can I compare foot traffic and performance across a shopping-mall portfolio?
V-Count BoostBI brings location reporting into one platform, helping a mall operator review visitor patterns across its portfolio. Agree common visit definitions, staff rules and reporting periods, then compare complete data for similar opening hours and calendars. Keep tenant capture separate from purchase conversion, and describe portfolio totals as recorded visits rather than unique people.
See it working in a store like yours
Book a free demo and see live traffic, conversion and staffing data. Trusted by 600+ companies in 130+ countries.