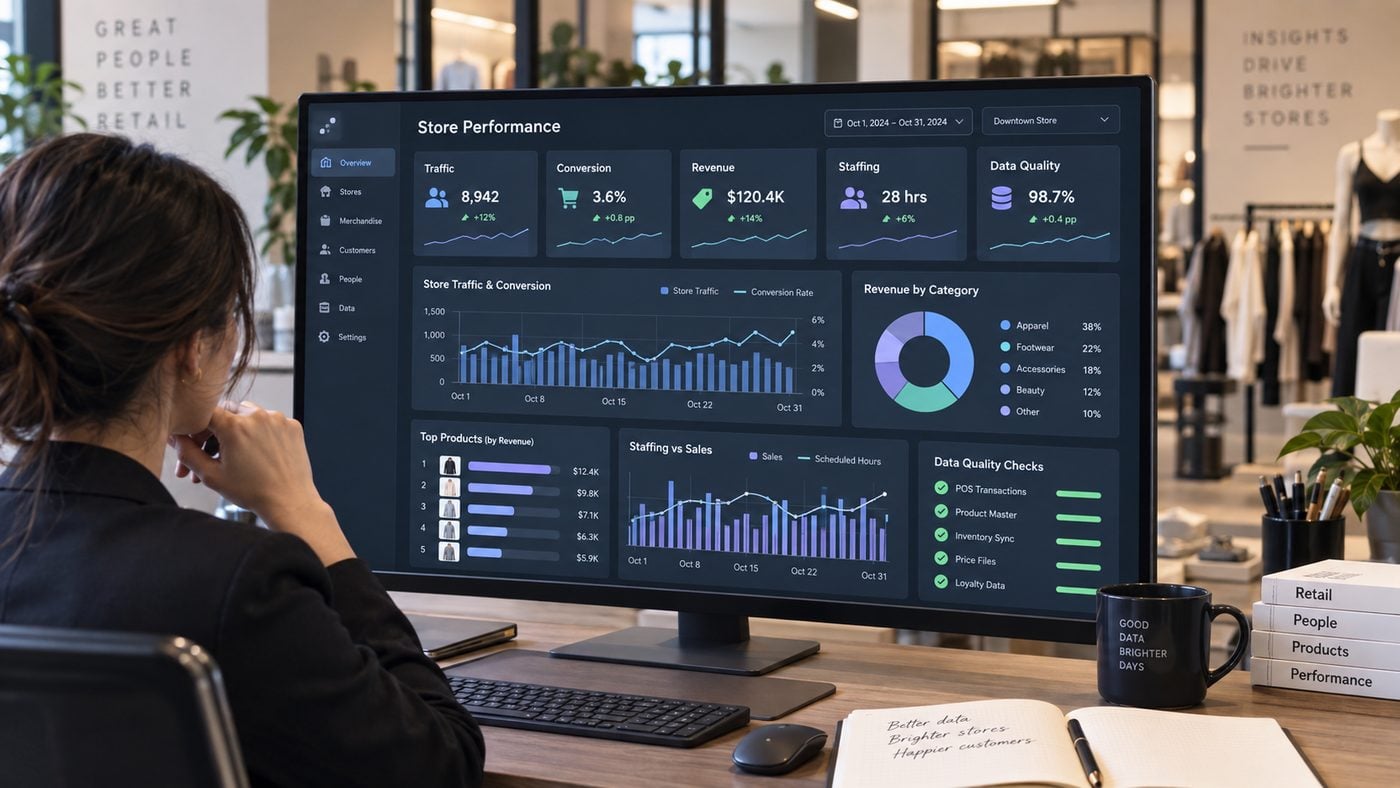
A retail intelligence platform brings relevant business data into a shared view so teams can understand performance and choose their next action. For physical stores, V-Count supplies a vital part of that picture: measured visitor activity. Nano sensors and BoostBI connect footfall insights with compatible sales data, helping retailers understand how store demand translates into transactions.
Your POS records purchases. V-Count adds the context of the people who entered, including visits that did not result in a transaction. Together, these inputs help managers distinguish a traffic problem from a conversion opportunity, review staffing around demand and compare locations more meaningfully.
The right connection starts with the decisions your team wants to improve. Here is how V-Count fits into an existing retail data environment, which integration routes are available and what to agree for dependable reporting.
What each data source tells your retail team
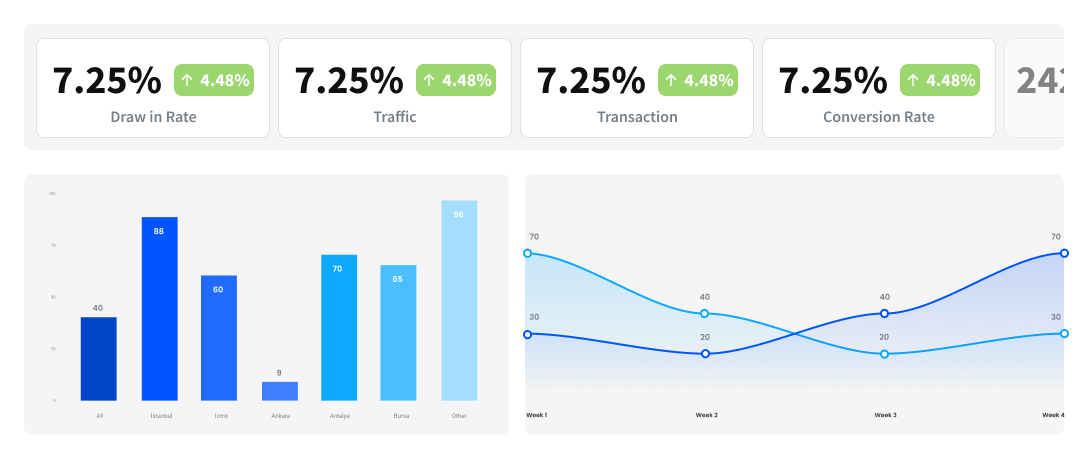
A useful retail intelligence platform connects a business question to the evidence needed to answer it. Sales, visits and working hours describe different aspects of the same trading period. Combining them at a consistent store and time level makes the resulting comparison more useful.
| Data source | What it contributes | Decision it supports |
|---|---|---|
| V-Count visitor analytics | Entrance traffic and selected occupancy, queue or zone measurements | Identify demand peaks, service pressure and areas to review. |
| POS | Eligible transactions and sales totals | Assess conversion and revenue in the context of visits. |
| Workforce system | Planned or actual working hours | Compare staff coverage with visitor demand in an agreed reporting workflow. |
| Inventory and merchandising systems | Stock availability, assortment and promotion context | Investigate whether availability or a commercial change helps explain performance. |
| Existing BI environment | Approved measures from the retailer’s connected systems | Bring store performance into wider business reviews. |
V-Count’s retail store analytics focuses on the physical visitor measurement and reporting layer. Your existing POS, workforce and inventory tools continue to serve their specialist roles. This gives the integration a clear purpose: make store demand visible wherever it is needed for a better decision.
How V-Count connects footfall, sales and reporting

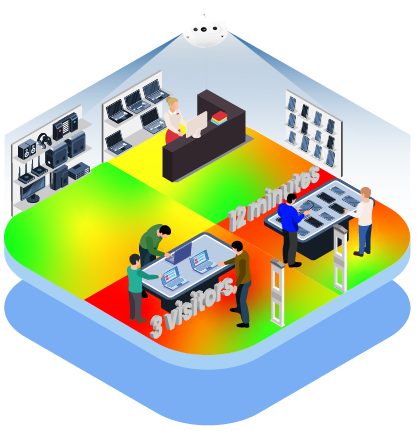
The visitor data starts with the measurement required. Nano AI supports entrance counting and compatible queue reporting. Nano Prime supports in-store zone traffic, dwell and heatmap analysis. V-Count helps match sensor coverage and selected analytics to the questions your team needs to answer.
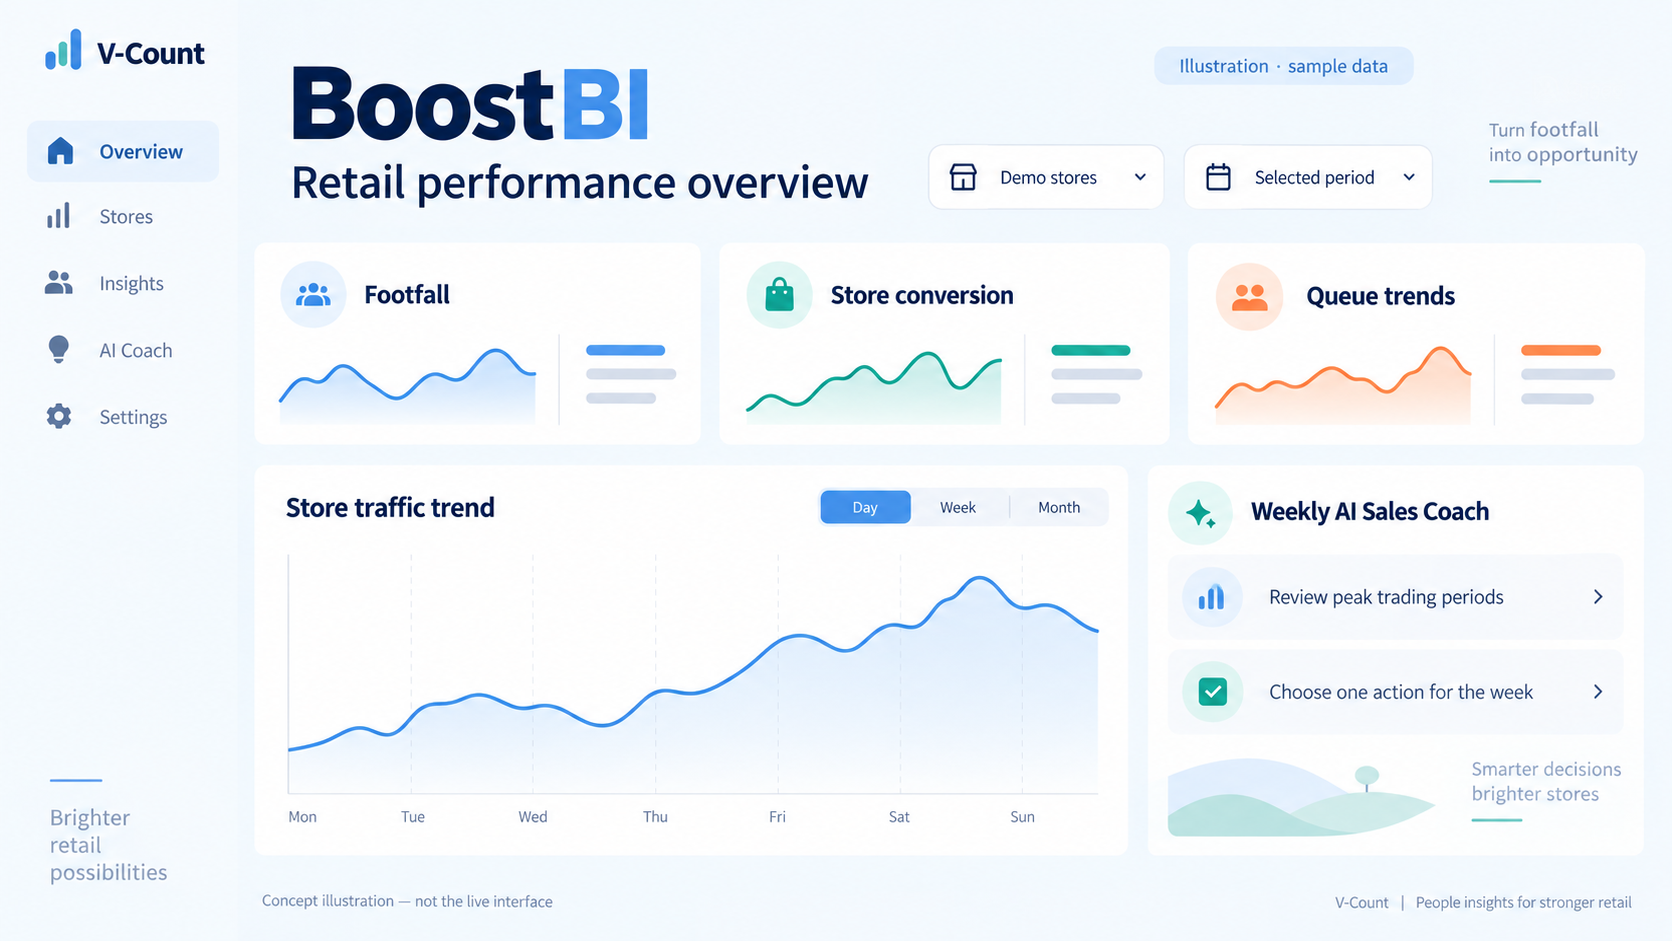
BoostBI turns the available measurements into location and period-based reporting. Compatible sales inputs add transaction and revenue context. For retailers with an established BI environment, a scoped REST API integration can make supported analytics outputs available for wider reporting.
Entrance counts and selected store measurements
↓
Visitor analytics outputs
Transactions and sales totals
↓
Native connector, manual import or scoped API route
Align store, reporting period and metric definitions
Review footfall alongside eligible sales data
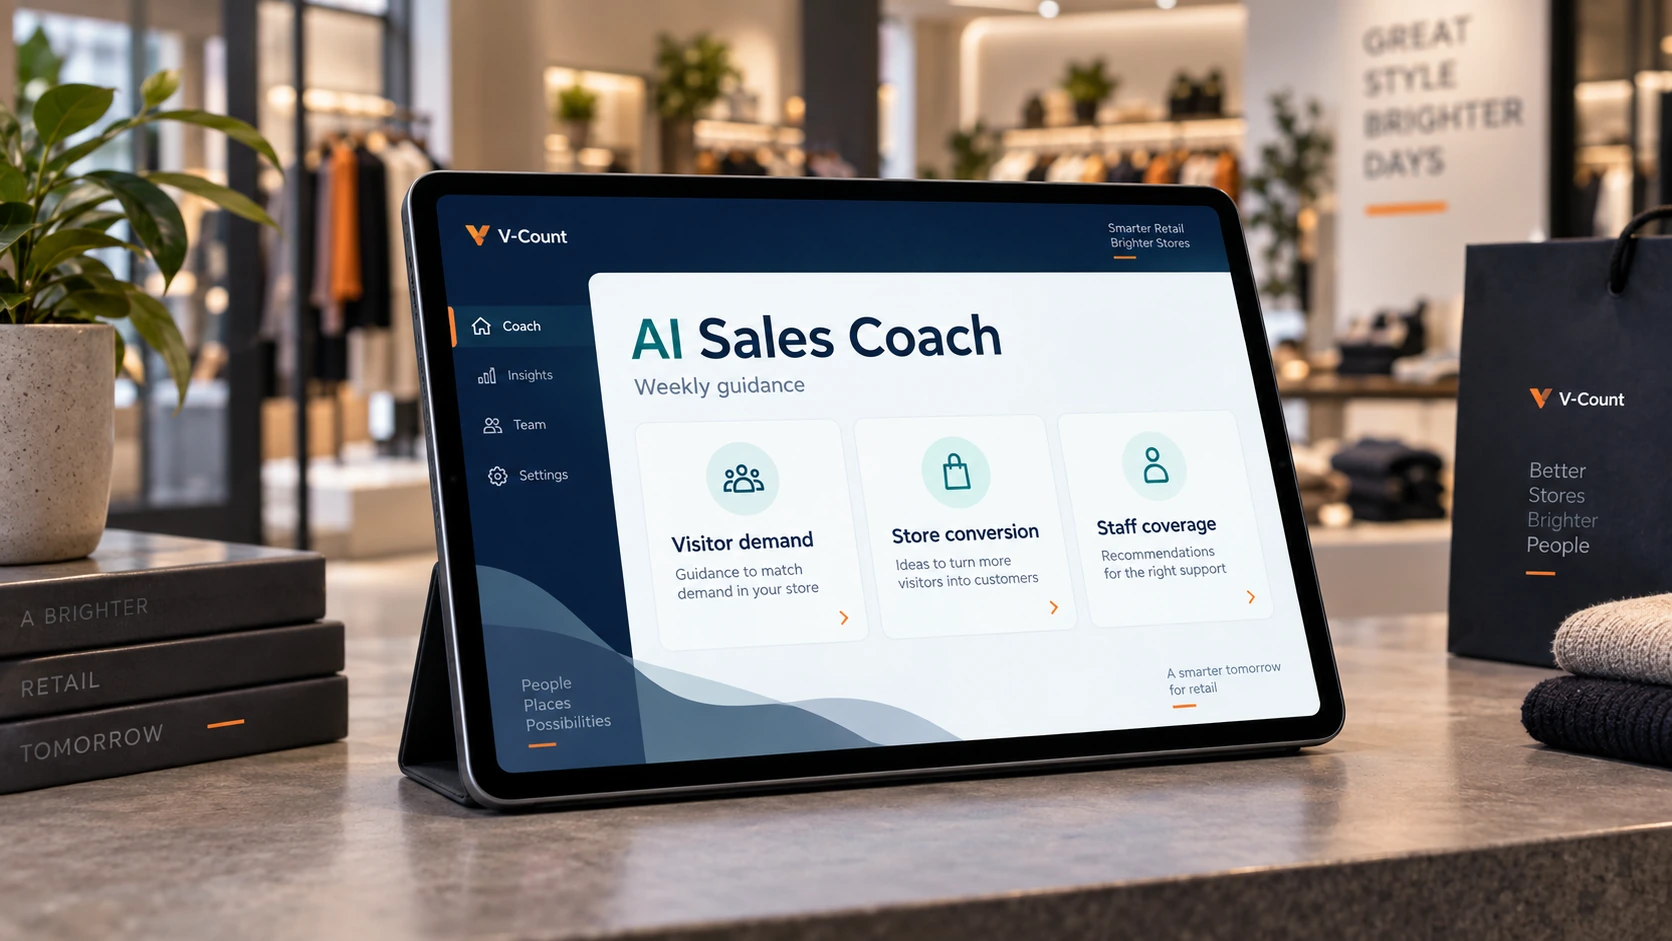
BoostBI reports and weekly AI Sales Coach guidance
Supported outputs via a scoped REST API integration
Combine with workforce or inventory context in the retailer’s reporting environment
The diagram shows aggregate reporting relationships. Matching a store’s visits with its transaction total does not identify which visitor made which purchase. That aggregate view is sufficient for many valuable store-level decisions.

Choose the integration route with V-Count
The current BoostBI integration overview identifies Shopify and Nebim as native connectors, manual sales import and an open REST API for scoped connections with other compatible systems. Use that distinction to set expectations for your rollout.
| Route | Data direction and status | Prerequisites to agree |
|---|---|---|
| Shopify or Nebim | Native connector for bringing compatible sales inputs into BoostBI. | Supported version, account access, store mapping, required fields and import timing. |
| Manual sales import | Sales data into BoostBI; published alternative for supplying sales inputs. | Accepted format, period definitions, upload owner and correction process. |
| Other POS or ERP systems | Custom REST API project; inbound data and supported fields agreed for the specific system. | Compatibility review, current API documentation, selected API sublicence and named integration owner. |
| Existing BI tools | Supported BoostBI outputs to the retailer’s reporting environment through a scoped REST API integration. | Required outputs and aggregation, access, retrieval schedule and responsibility for the destination reports. |
API access is a selected sublicence within the quoted BoostBI package.
Bring the names and versions of your current systems to the architecture session. V-Count can then discuss the relevant route against the actual reports and business process you want to support.
Align store and time definitions for useful comparisons
The most important reporting connection is simple: compare the same location over the same complete period. Agree a shared store identifier, local time zone, trading calendar and reporting interval. A location called “London Central” in BoostBI should map unambiguously to the corresponding POS store.
Then agree what counts as an eligible visit and an eligible transaction. Staff exclusion, repeat entries, returns, cancellations and online orders collected in store can affect interpretation. Apply the chosen rules consistently and document changes so regional comparisons remain understandable.
For the same store and complete trading day, 1,000 eligible visits and 200 eligible purchase transactions give a transaction-based conversion rate of 20%: 200 ÷ 1,000 × 100.
If the POS import currently contains only 120 transactions, the apparent 12% rate is incomplete. Confirm sales completeness before using the report to judge store performance.
V-Count’s people counting solution provides the visitor measurement foundation. With corresponding POS totals, managers can assess how effectively a store turns its measured demand into transactions.
Agree freshness, ownership and quality at each layer
BoostBI’s published reporting refresh is typically every 10 minutes, with updates as frequent as every minute when real-time updating is enabled. Sensor sampling, reporting aggregation and the arrival of external sales data are separate. Choose the configuration around the management decision, then agree when each report is complete enough to use.
| Layer | Owner to assign | Freshness and quality agreement |
|---|---|---|
| Sensor measurement | Store or facilities contact with V-Count deployment support | Validate coverage and counting rules; define who reports a moved sensor or connectivity issue. |
| BoostBI reporting | Retail analytics lead with V-Count | Confirm selected reports and refresh setting; validate location, time zone and trading hours. |
| POS input | POS or integration owner | Set import timing and reconciliation checks; identify late or missing periods and how corrections are applied. |
| Workforce or inventory context | Relevant source-system owner | Agree availability and definitions in the retailer’s reporting workflow, including planned versus actual staffing. |
| External BI reporting | Retailer’s BI team or appointed integration partner | Confirm supported API outputs, retrieval schedule, complete-period checks and escalation responsibilities. |
These responsibilities are a starting point to agree with V-Count and your partners. During acceptance, reconcile a sample period against entrance checks and POS totals. Treat missing data as an exception requiring investigation, rather than silently interpreting it as zero activity.
Turn connected reporting into better store decisions
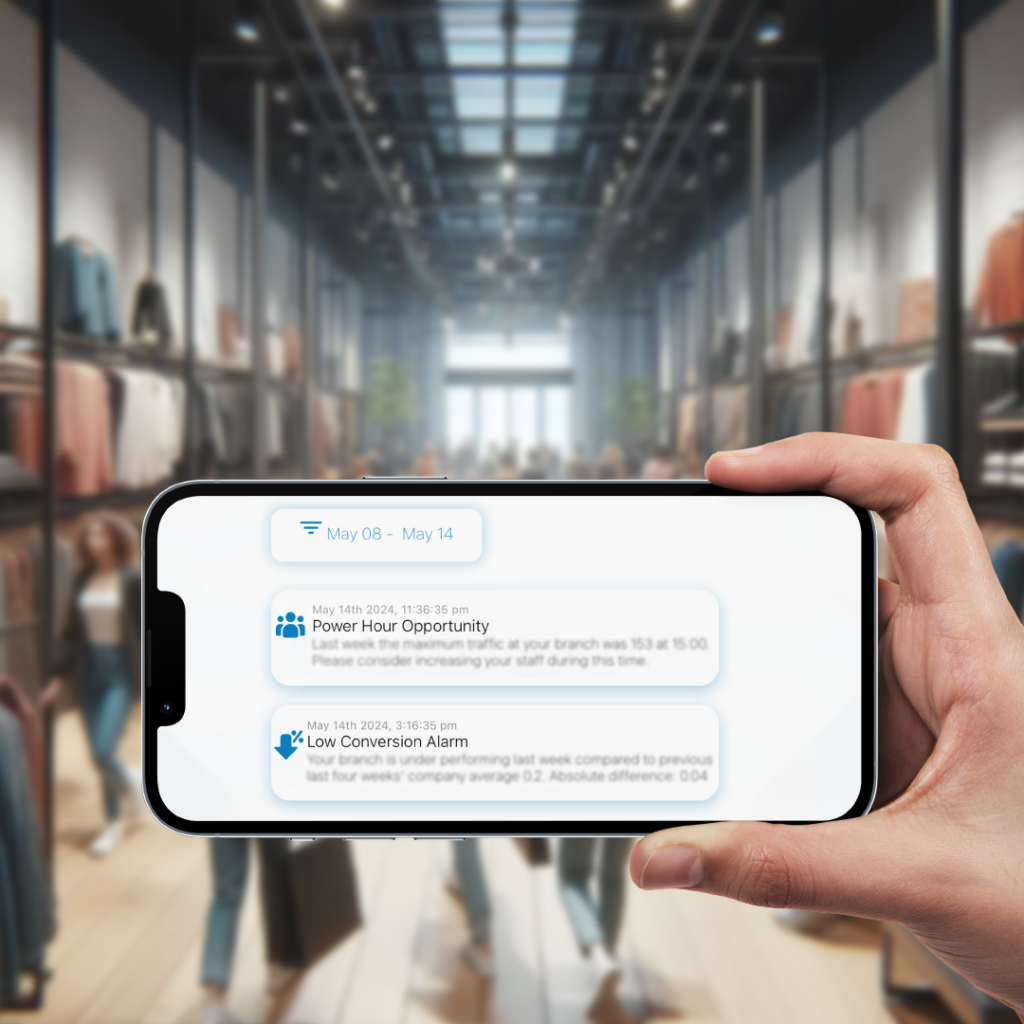
Use the connected view to give each team a specific next step. A regional manager can investigate whether a sales decline coincides with lower footfall or a weaker transaction-to-visit ratio. A store manager can compare visitor peaks with service coverage. An analyst can check whether the pattern appears across comparable locations.
Choose one operational change, record when it starts and review suitable comparable trading periods. Include promotions, closures and availability changes in the discussion. V-Count’s weekly AI Sales Coach in BoostBI can support that routine with guidance based on available store performance data; managers choose and assess the action.
That is the commercial value of connected retail intelligence: clearer priorities for the people running your stores, supported by visitor evidence alongside the systems you already use.
Retail intelligence platform FAQs
What is a retail intelligence platform?
It is software that brings relevant retail data into a view teams can use to understand performance. V-Count’s BoostBI supplies physical-store visitor analytics and connects compatible sales inputs to help retailers review traffic and conversion.
How do footfall analytics fit into a retail data stack?
V-Count adds measured store visits through Nano sensors and BoostBI. Align those visits with transactions by store and period to assess conversion, then discuss supported API outputs for your existing BI environment.
Which platforms connect store traffic and retail operations data?
V-Count’s BoostBI connects visitor reporting with compatible sales data through native Shopify or Nebim connectors, manual import or a scoped REST API project.
Do I need a retail intelligence platform as well as a POS system?
If you need to understand visits and conversion, V-Count adds information beyond the purchase records in your POS. BoostBI helps your team interpret sales against store demand while your POS continues managing transactions.
How can I combine footfall, sales and staffing data without replacing my systems?
Start with V-Count visitor measurement and the appropriate sales connection. For staffing comparisons in an existing BI environment, scope the supported BoostBI outputs and align them with workforce data using shared store and time definitions.
Plan your retail intelligence connection with V-Count
Share your store structure, POS and BI systems, the reports you need and how often your teams use them. V-Count can help map the visitor measurements, integration route and BoostBI package to your priorities.
Request an integration architecture session