Retail performance · AI-powered application guidance
Retail store productivity measures how effectively a store turns visitor demand and staff time into sales. A useful scorecard combines revenue per visitor, conversion, average transaction value and sales per labor hour. Together, these metrics help regional managers see whether a sales result reflects traffic, purchase behavior, basket value or staffing coverage.
Sales alone cannot explain the difference. Two stores can each generate $12,000 while serving different numbers of visitors with different staffing levels. V-Count adds measured footfall to the picture, helping teams interpret sales against the opportunity that walked through the door.
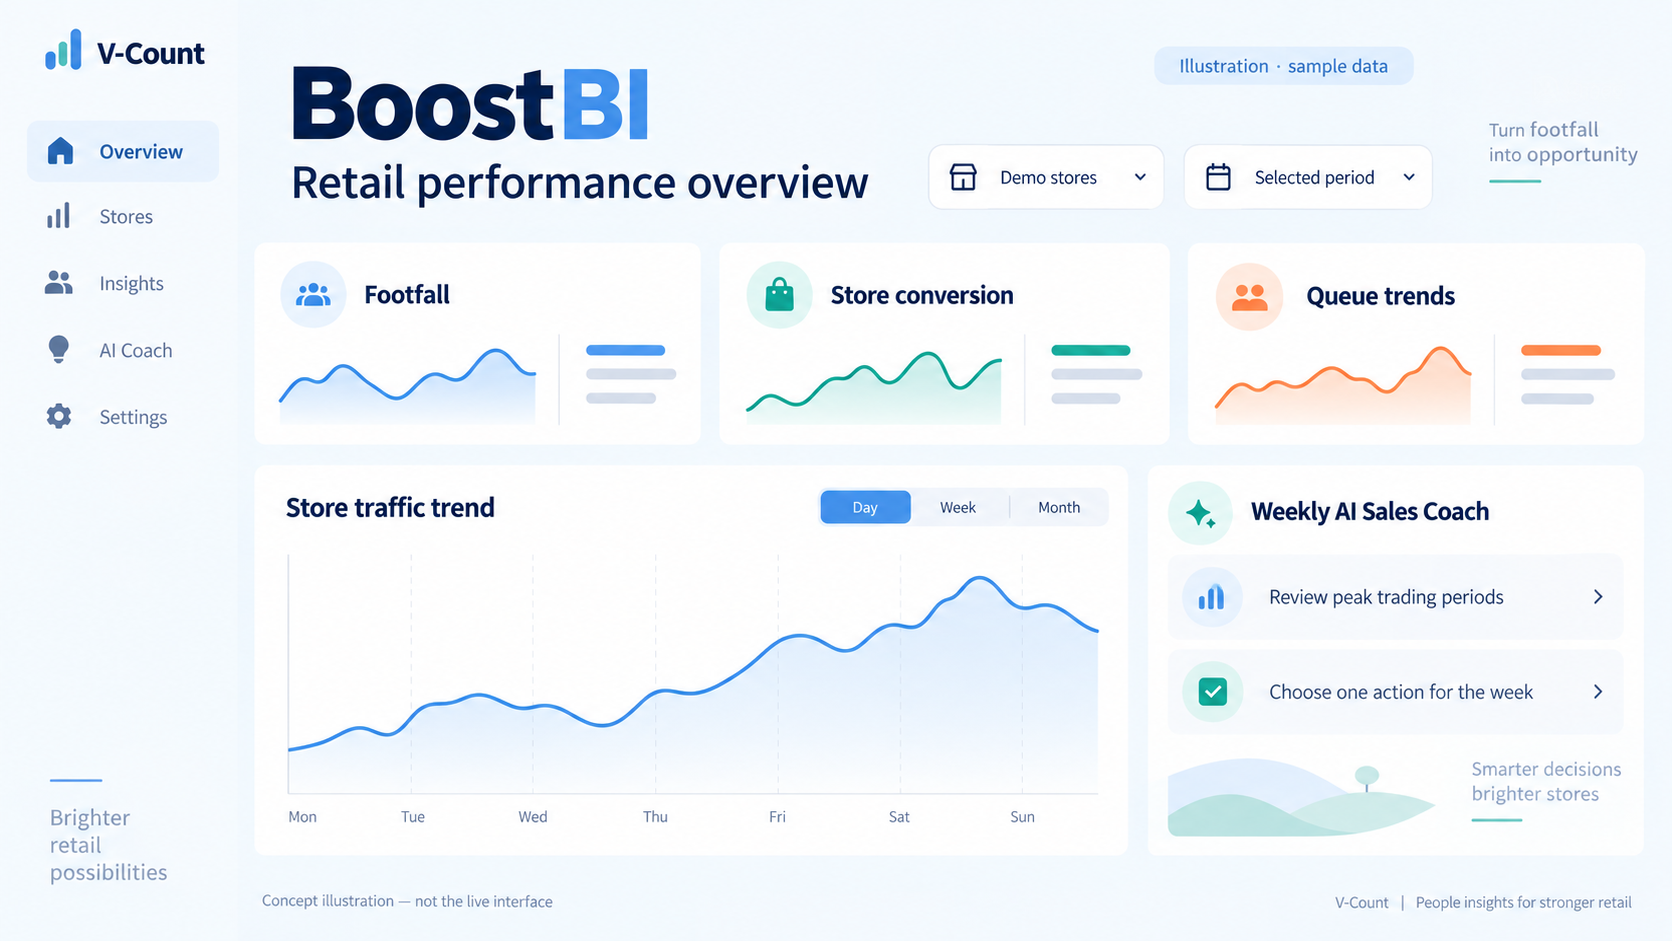
Explore the metrics below, see the weekly interface views and discover how AI Sales Coach delivers guidance directly in BoostBI.
The four retail productivity metrics to review together
Start with the same store and complete reporting period for every input. In this article, sales means net sales after discounts and refunds, excluding tax. Eligible transactions are purchase receipts under a consistent POS definition, excluding cancelled and return-only receipts.
Revenue per visitor
Net sales ÷ eligible visits
How much sales value did each measured visit represent?
Conversion rate
Eligible purchase transactions ÷ eligible visits × 100
How often did a measured visit correspond to a purchase transaction?
Average transaction value (ATV)
Net sales ÷ eligible purchase transactions
What was the average sales value per transaction?
Sales per labor hour
Net sales ÷ actual paid labor hours
How much sales value did the store generate per paid hour?
Revenue per visitor is also called shopper yield. With consistent inputs, it equals conversion expressed as a decimal multiplied by ATV. A 20% conversion rate and $75 ATV produce $15 revenue per visitor.
“Visitor” here means an eligible visit, not an identified unique shopper. Transaction-based conversion does not establish which individual purchased. Agree counting rules, staff exclusion where applicable and POS eligibility before comparing locations.
For labor hours, one person working one hour contributes one hour. Use actual paid hours consistently, with an agreed treatment of paid breaks and non-selling tasks. Keep planned roster hours separate. Sales per labor hour measures revenue productivity; it does not account for margin, wage rates or profitability.
Same sales, different store performance
The following stores each generated $12,000 over one complete trading day.
| Input or result | Store A | Store B |
|---|---|---|
| Net sales | $12,000 | $12,000 |
| Eligible visits | 800 | 1,200 |
| Purchase transactions | 160 | 200 |
| Actual paid labor hours | 80 | 60 |
| Revenue per visitor | $15.00 | $10.00 |
| Conversion rate | 20.00% | 16.67% |
| ATV | $75.00 | $60.00 |
| Sales per labor hour | $150.00 | $200.00 |
| Visits per labor hour | 10 | 20 |
Store B generates more sales per labor hour, but less revenue per visit. It processes more transactions with fewer paid hours while converting a smaller share of visits and recording a lower ATV.
That pattern gives the regional manager a question to investigate: does Store B have enough service coverage during its busiest periods? It does not prove understaffing. Assortment, availability, promotions, customer mission and different service models could also explain the gap. Store A may have more time-consuming services or essential non-selling work.
Review comparable stores and hours before changing coverage. A higher sales-per-labor-hour figure can coexist with missed opportunities; a lower figure can reflect necessary service capacity. Use the complete scorecard to decide where to look.
Move from a daily total to an hourly decision
See visitor demand and staffing across the week
A weekly view makes recurring busy periods easier to spot. Review visitor demand first, then compare the customer-to-staff pattern to identify the hours that deserve a closer service review.
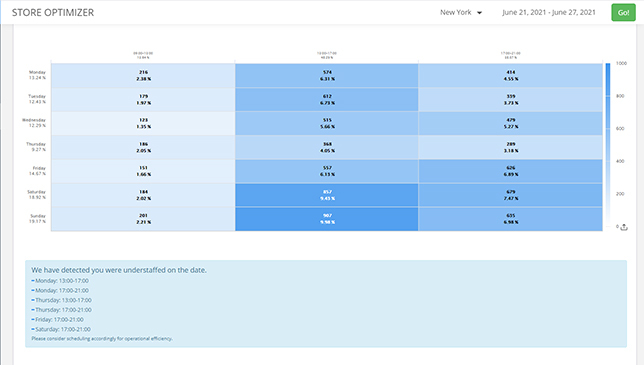
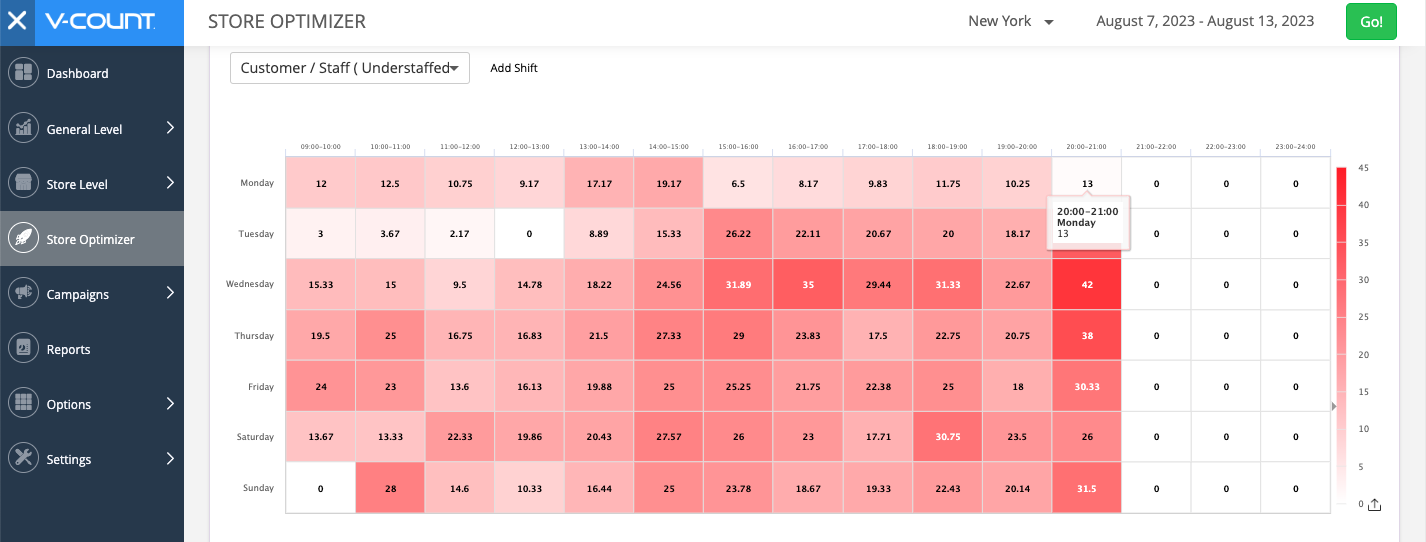
Use these views to select a period for investigation, then check transactions, stock availability and service conditions.
Daily averages can conceal service pressure. Compare hourly visits, transactions, sales and paid hours to identify when an intervention may help. The selected Store B hours below are separate examples.
| Hour | Visits / transactions | Sales / labor hours | Conversion / revenue per visitor |
|---|---|---|---|
| 10:00–11:00 | 80 / 16 | $960 / 4 | 20.00% / $12.00 |
| 12:00–13:00 | 180 / 24 | $1,440 / 4 | 13.33% / $8.00 |
| 15:00–16:00 | 120 / 24 | $1,440 / 6 | 20.00% / $12.00 |
| 17:00–18:00 | Missing / 20 | $1,200 / 4 | Hold: traffic incomplete |
| Hour | Sales per labor hour | Decision to review |
|---|---|---|
| 10:00–11:00 | $240 | Use as context for a quieter period. |
| 12:00–13:00 | $360 | Investigate queue pressure and floor coverage. High labor productivity accompanies lower conversion. |
| 15:00–16:00 | $240 | Check whether service needs and essential tasks explain the additional coverage. |
| 17:00–18:00 | $300 | Investigate the missing traffic interval. Do not interpret missing visits as zero. |
At noon, visits per labor hour rise to 45, compared with 20 in the other complete example hours. That indicates greater visitor load per paid hour. Check queues, task allocation and availability before deciding whether to shift a break, add coverage or address another operational constraint.
Resolve data-quality exceptions before judging the store
A scorecard is only ready for a management decision when its inputs cover the same period. Give each review a simple status: ready, provisional or hold.
Missing traffic or a sensor issue
Hold conversion and revenue per visitor for the affected period. Record the gap and resolve it before comparison.
Late or partial POS import
Mark sales-based measures provisional until transactions and sales reconcile with POS totals.
Zero denominator
Show the affected ratio as N/A and investigate. Do not divide by zero or substitute a fabricated value.
Different calendars or labor definitions
Align local hours, trading days and actual paid-hour scope. Keep planned and actual hours distinct.
Refunds, promotions or unusual trading
Record the context. Apply consistent sales definitions and separate exceptional periods when appropriate.
For a weekly or regional total, recalculate each ratio from summed inputs. Do not take an unweighted average of store conversion rates or hourly sales-per-labor-hour figures. Retain a note when counting rules, store hours or coverage change.
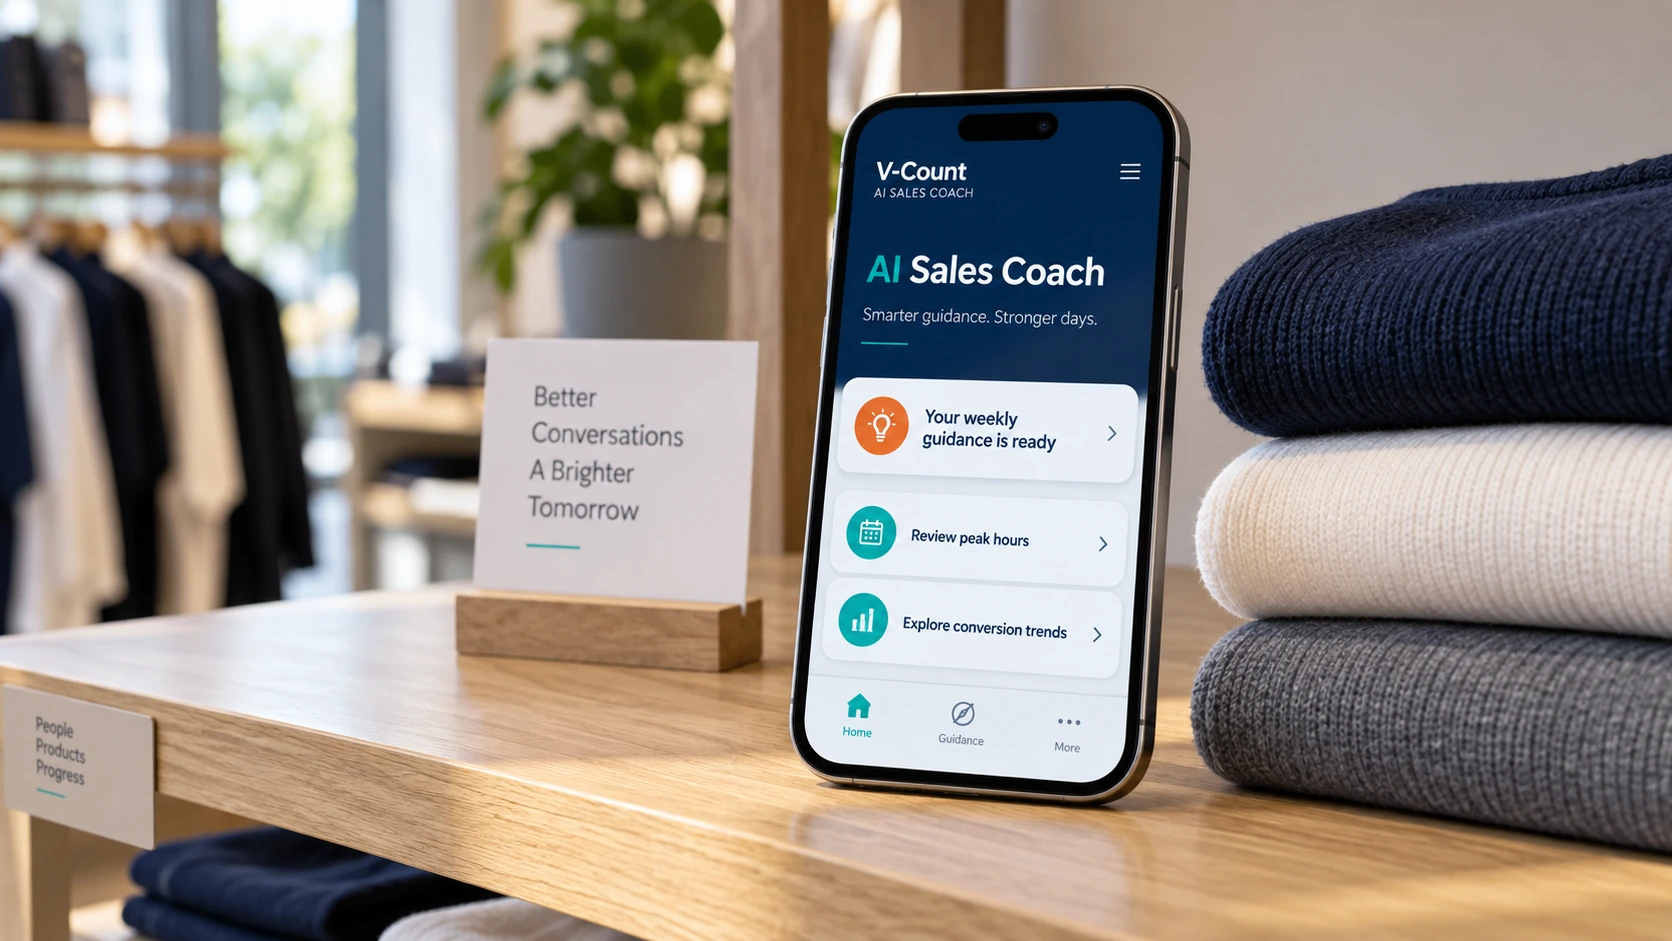
AI Sales Coach delivers weekly guidance directly in the application
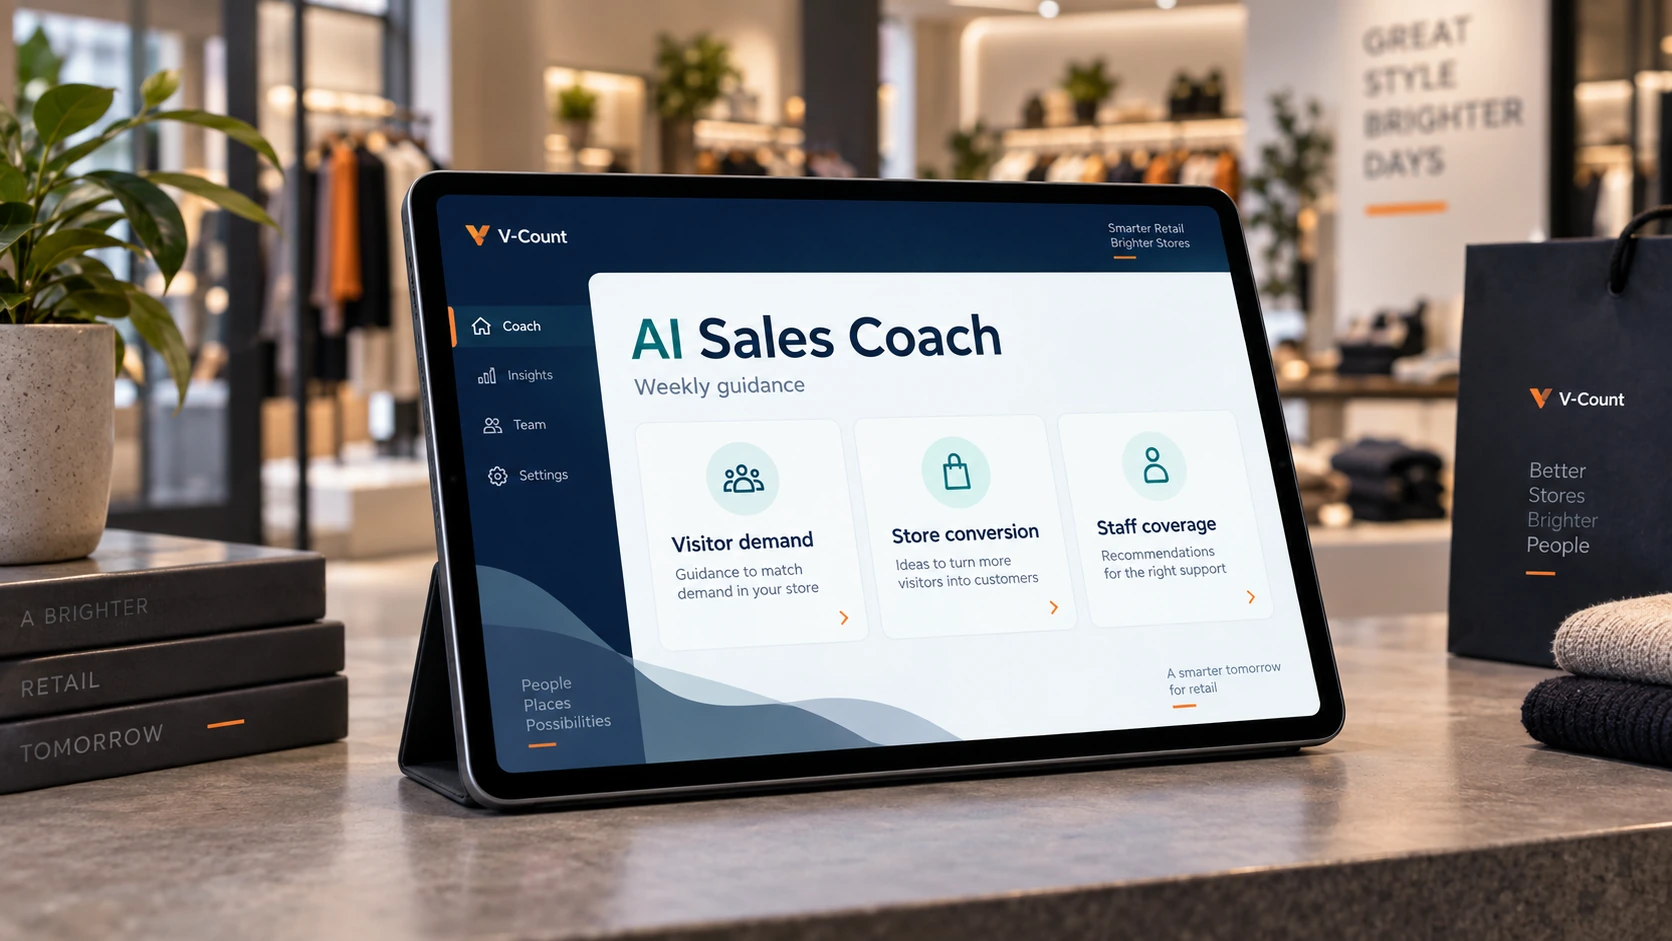
V-Count’s AI Sales Coach is an application that automatically turns available store performance data into targeted weekly guidance in BoostBI. The application provides the coaching directly. There is no human coach or intermediary preparing or delivering the recommendations.
Visitor patterns and eligible sales results provide the context for understanding store performance. AI Sales Coach uses the store data available in BoostBI to provide targeted suggestions that users can access in the application.
Available store data is analysed by AI Sales Coach, and the application delivers its weekly recommendations directly to the user. Coaching is a software capability within BoostBI.
Use the application’s recommendations alongside the relevant performance reports. Changes in conversion or revenue should still be interpreted against traffic, stock availability, promotions and comparable trading periods. AI guidance does not make every subsequent sales movement evidence of a guaranteed uplift.
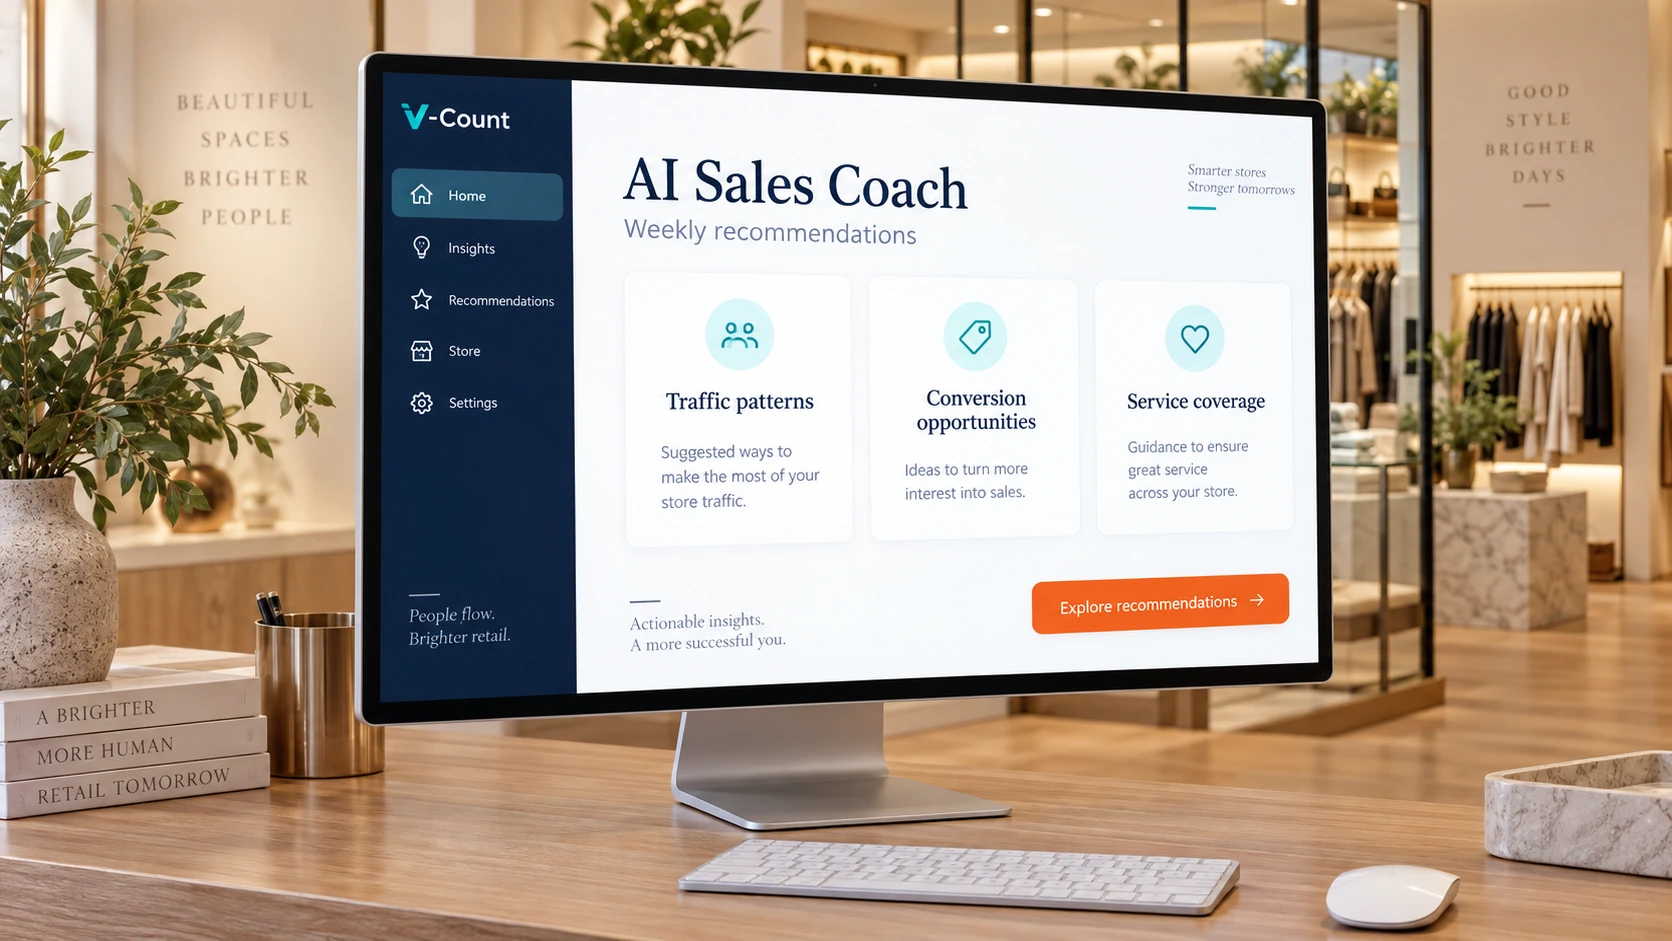
Connect visitor analytics with AI Sales Coach in BoostBI
V-Count provides the visitor measurement that a sales report alone cannot supply. Nano AI measures entrance traffic, and BoostBI retail analytics brings available visitor reporting together with compatible sales inputs to support traffic and conversion reviews.
Published sales routes include native Shopify and Nebim connectors, manual import and scoped REST API projects. Confirm compatibility, fields, store mapping and import timing with V-Count. Actual labor hours come from your workforce source; agree the reporting workflow or supported API outputs needed to compare them with visitor demand. A payroll or workforce integration is not implied by a sales connector.
Selected queue analytics can add service context. AI Sales Coach automatically delivers weekly, targeted recommendations in BoostBI from the available store performance data. Users receive the coaching directly in the application.
Retail store productivity FAQs
How do you calculate revenue per visitor in retail?
V-Count’s BoostBI shows it once Nano AI visitor counts are matched with your POS sales. Divide net sales by eligible visits for the same store and complete period. With V-Count visit counts and corresponding sales totals, $12,000 divided by 800 visits equals $15 per visit.
How should sales per labor hour be compared with conversion?
Review both alongside revenue per visitor and ATV. High sales per labor hour with weaker conversion warrants an hourly service review. V-Count adds traffic context so the team can investigate that pattern before adjusting staffing.
Is AI Sales Coach delivered by a human coach?
No. V-Count’s AI Sales Coach is an automated weekly report inside BoostBI. V-Count’s AI Sales Coach application automatically generates and delivers targeted weekly coaching in BoostBI. Users receive its guidance directly in the application; no human coach sits between the data and the recommendations.
How does footfall improve a staffing scorecard?
V-Count’s Nano AI entrance counts show, hour by hour in BoostBI, when demand arrives. Footfall shows demand that did not necessarily become a purchase. Comparing V-Count traffic patterns with actual coverage helps managers identify periods to investigate and assess a targeted change using comparable trading conditions.
See AI Sales Coach and retail productivity insights in action
Explore how V-Count connects visitor data with performance reporting and automatic weekly guidance in the AI Sales Coach application.
Explore AI Sales Coach with V-Count