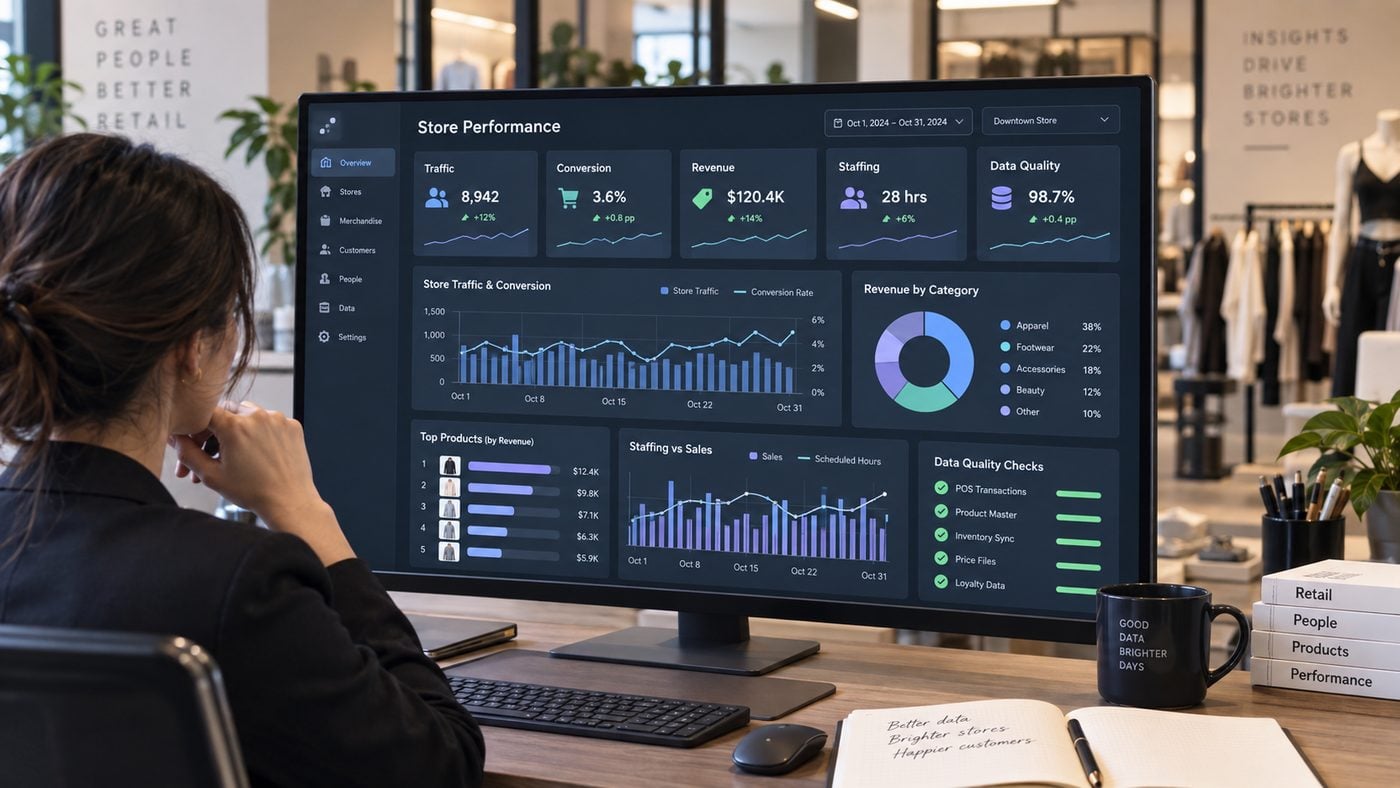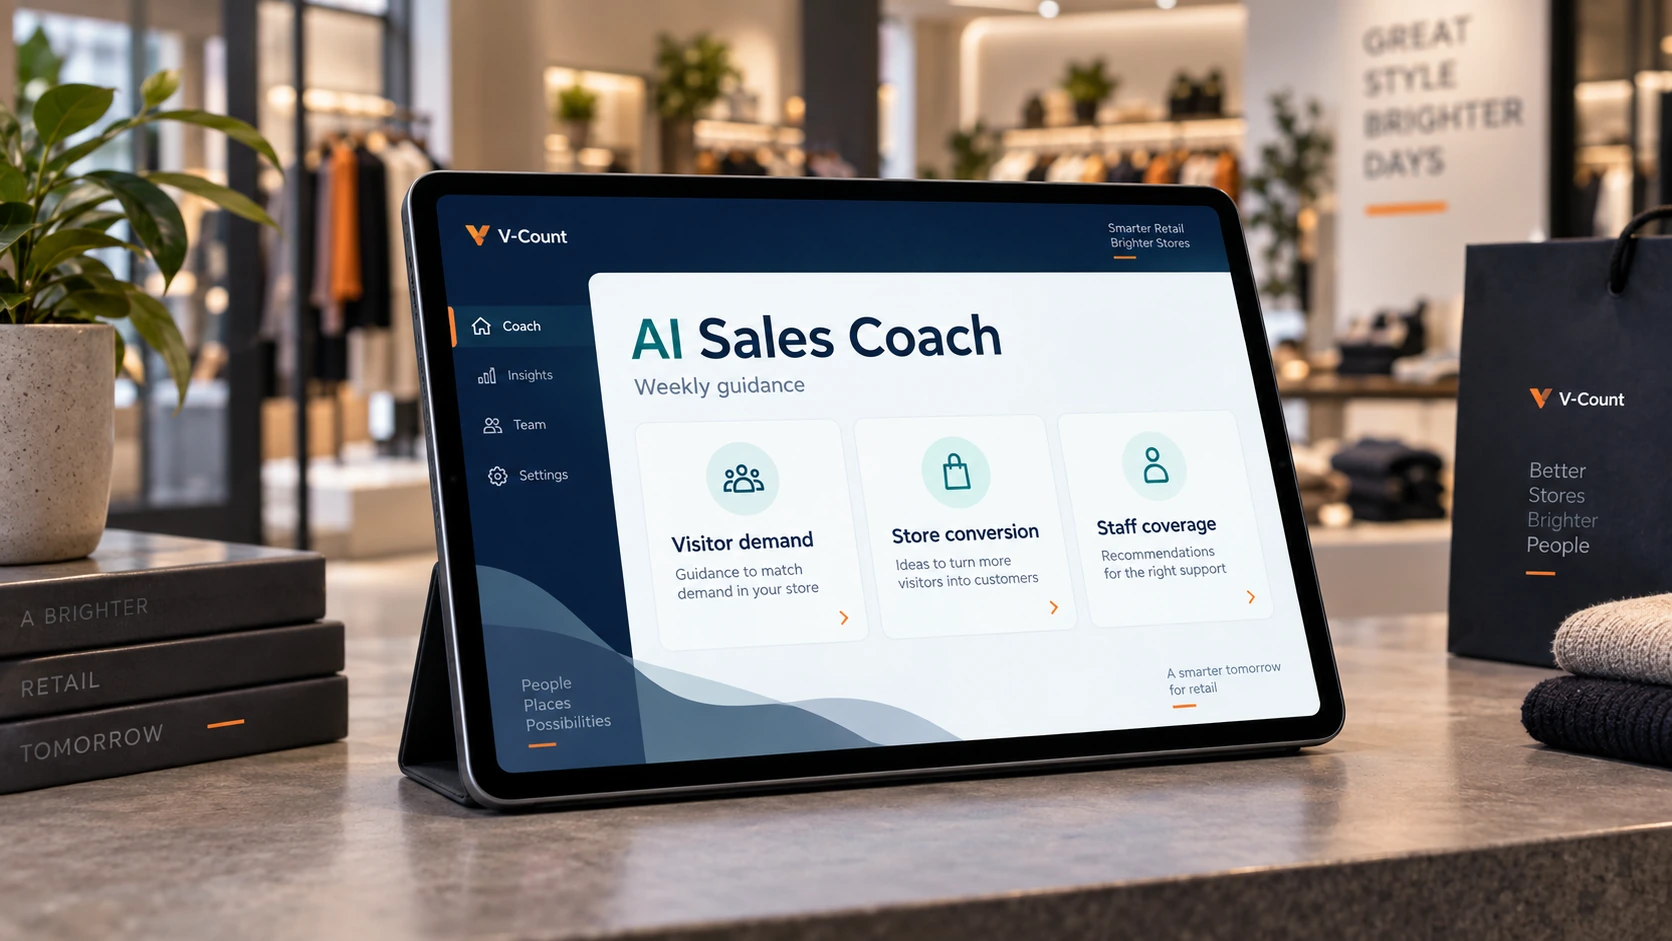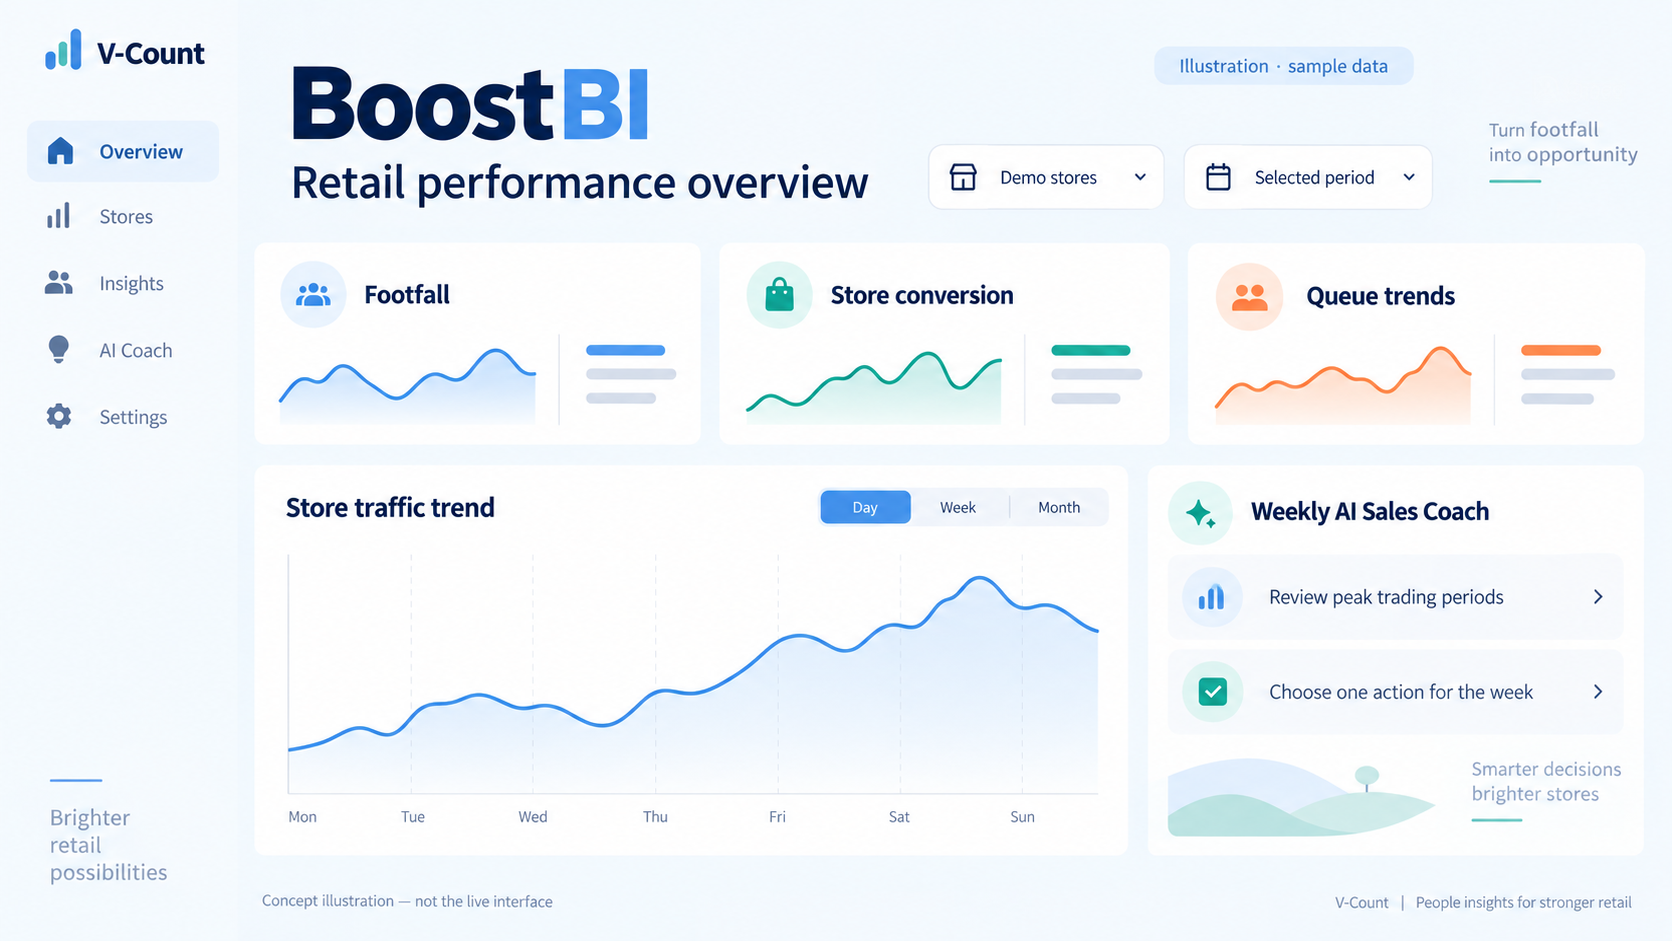
Computer vision in retail helps teams understand how shoppers enter, move through and spend time in a store. V-Count turns those measurements into practical visitor analytics through Nano AI, Nano Prime and BoostBI. Retailers can use the resulting reports to plan staffing, assess layouts and connect footfall with sales performance.
The value starts with a clear operational question. Are visitor numbers changing? Which departments attract attention? When do queues need closer management? This guide explains how to scope a V-Count deployment around the answers your team needs and turn those answers into a consistent store-management routine.

Make store performance easier to explain
Sales show the outcome of a trading period. Visitor measurements add the context needed to investigate it. A quiet sales day with fewer visits calls for a different response from a busy day with a lower transaction-to-visit ratio. Knowing which situation you face helps managers choose a useful next step.
Begin with the decisions that matter most to your stores. Use a shared definition for each measure, give someone responsibility for reviewing it and agree what evidence would justify a change.
| Store question | Measurement to review | Operational action |
|---|---|---|
| When is demand highest? | Visitor counts by trading period | Review staff coverage and break timing around the observed peaks. |
| Why did sales change? | Visits and eligible transactions for the same period | Investigate traffic and conversion separately before choosing an intervention. |
| Which areas attract shoppers? | Zone traffic, dwell and movement | Identify a layout or display change to test. |
| When do checkout queues build? | Queue length and waiting-time patterns | Review service coverage and assess the effect of a staffing change. |
| Which stores need attention? | Comparable traffic and performance trends | Prioritise store reviews using consistent definitions and trading calendars. |
These are measurement-led management workflows. A change in traffic or dwell is a signal to investigate; the result of an operational change should be evaluated against comparable trading conditions.
A connected V-Count solution for shopper analytics
Combine the right measurement coverage with the reports your managers will use. V-Count can scope the sensor placement, selected analytics and required data connections around your store layout.
| Component | Published role | Deployment check |
|---|---|---|
| Nano AI | People counting using active stereo vision; compatible queue measurement | Entrance or queue coverage, power arrangement and selected analytics |
| Nano Prime | Heatmaps, zone traffic, dwell and visitor flow | Floor plan, mounting height, obstructions and zone definitions |
| BoostBI | Visitor reporting with compatible sales inputs and integration options | Report availability, sublicences, supported fields and data ownership |
In this setup, Nano AI supports entrance measurement, Nano Prime adds in-store zone and dwell visibility, and BoostBI provides reporting. Select the analytics required for your use case and validate coverage during commissioning. An entrance measurement and a department heatmap answer different questions.
V-Count describes on-device processing for its Nano products, transmitting non-identifiable insights for analytics. Include the required data handling and access arrangements in the deployment discussion so your teams understand the information they will receive.
Connect visitor activity with store performance
Entrances · browsing zones · queues
Nano AI entrance and queue coverage · Nano Prime zone coverage
POS transactions · store directory · opening hours
Supported connector, sales import or scoped API integration
Aligned store and time definitions → reports for retail teams
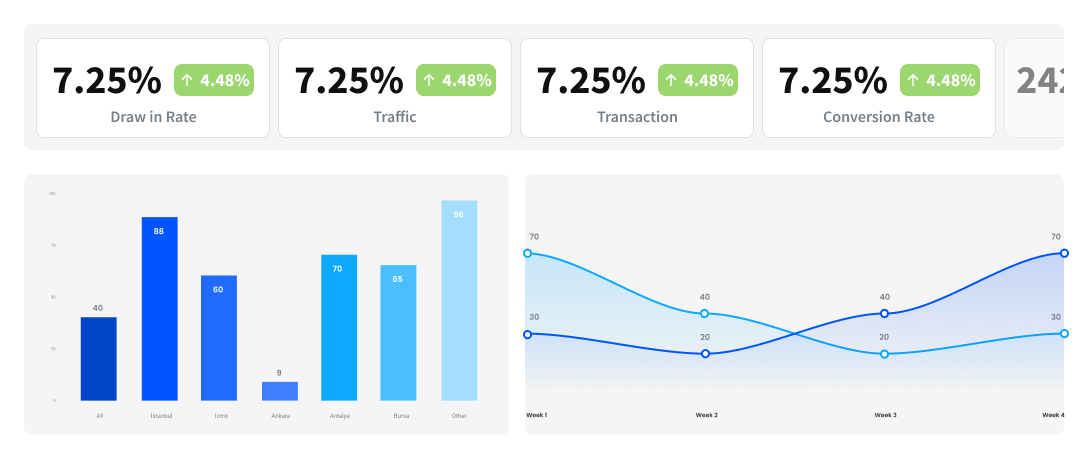
BoostBI supports sales inputs through Shopify and Nebim connectors, manual import and scoped REST API integration for compatible systems.
Give every location a consistent store identifier and align time zones, trading hours and reporting intervals. This makes the sales and visitor comparison meaningful. A missing interval should be treated as unavailable data rather than as zero traffic.
Store conversion (%) = eligible purchase transactions ÷ eligible store visits × 100.
Example: 200 eligible transactions and 1,000 eligible visits in the same store and period produce a 20% transaction-to-visit ratio. Use the same inclusion rules when comparing periods.
This is an aggregate operational measure. It helps a manager investigate performance without claiming that a particular measured visitor made a particular purchase.
Three ways to put V-Count reporting to work
1. Match staffing reviews to visitor demand
For a fashion chain, start with entrance counts across representative stores. Review comparable weekdays and identify the periods when traffic rises. Use those patterns alongside the roster, store workload and service requirements to plan a staffing adjustment.
After the change, compare traffic and conversion over suitable periods. Record promotions, opening-hour changes and other events that could affect the result. This keeps the review focused on evidence rather than assuming every sales movement came from the roster.
2. Give layout changes a measurable purpose
For a large store, define the departments or display areas you want to understand. Nano Prime zone and dwell reporting can help reveal where attention concentrates and where a layout deserves closer review.
Choose one merchandising change, such as improving the visibility of an overlooked display. Compare zone measurements before and after the change while keeping the reporting definitions consistent. Bring relevant sales data into the review where available, without treating dwell alone as proof of purchase intent.
3. Review checkout pressure with the store team
For a retailer with variable checkout demand, scope queue measurement around the actual service area. Agree where the queue starts, what marks the beginning of service and which periods the manager needs to review.
Use queue patterns to discuss service coverage. After changing staffing or the queue arrangement, review waiting-time and queue-length measurements under comparable conditions. Set the reporting and response routine to suit the store’s operational needs.
Plan your V-Count rollout around a useful first result
A focused launch gives the project a clear purpose. Choose the initial stores and reports around a question your team already needs to answer. A representative location should reflect the entrance, layout and trading conditions you expect to encounter across the wider estate.
- Define the first objective. Specify the store decision, measurement and people who will use the report.
- Share the store layout. Provide entrance locations, floor plans, mounting conditions and relevant queue areas so V-Count can scope coverage.
- Agree the reporting package. Select the analytics, user access and external data connections needed for that objective.
- Validate the installation. Review representative trading periods and confirm measurement boundaries, exclusions and data quality with the implementation team.
- Establish the management routine. Assign responsibility for reviewing reports and documenting the actions taken.
- Expand with consistent definitions. Apply the agreed commissioning checks and reporting rules to each additional store.
Include facilities, IT and retail operations in the setup discussion. Facilities can confirm mounting and power arrangements; IT can confirm connectivity and access; operations can define the reports and decide how managers will use them. Agree the support contacts before rollout.
For a useful project review, retain the agreed scope, the commissioning observations and any actions required. Confirm report freshness for the selected configuration and check that the intended users can access the right store views. This creates a practical handover from installation to everyday use.
Turn the reports into a weekly operating habit
Begin each review with the same sequence: confirm data quality, examine the traffic trend, compare the relevant performance measures and select one action. Give that action an owner and a date for follow-up.
For example, a store team might review an afternoon traffic peak, test a revised break schedule and track the corresponding service and conversion measures. A regional team might identify a recurring exception across similar stores and arrange a more detailed review.
The aim is a repeatable process: understand the pattern, choose a response and assess what happened. Keep notes on promotions, holidays, layout changes and trading hours so the next comparison has the context it needs.
Computer vision in retail: buyer FAQs
What are some leading solutions for implementing computer vision in retail?
For shopper analytics, V-Count combines Nano AI entrance measurement, Nano Prime zone analytics and BoostBI reporting. Start by matching the store question to the required measurements.
How can computer vision help improve retail performance?
V-Count gives retail teams measurements they can use to investigate traffic, conversion, browsing and queue patterns. Those insights support staffing and layout decisions.
How does V-Count connect footfall with sales?
V-Count’s BoostBI can bring compatible sales inputs alongside visitor measurements. Align store IDs, time periods and transaction rules during setup, then use the resulting aggregate reports to investigate conversion and performance trends.
Which V-Count products suit entrance and in-store analytics?
V-Count Nano AI supports entrance counting and compatible queue measurement. Nano Prime supports zone traffic, heatmaps, dwell and visitor flow. The right deployment depends on the layout, coverage and selected analytics.
How do I deploy V-Count across multiple retail stores?
Start with representative locations, agree the reporting definitions and validate the first installations. V-Count can help scope the sensors and BoostBI package. Apply the same commissioning and reporting checks as the rollout expands.
See what V-Count can reveal about your stores
Bring your floor plan and the store questions you want to answer. V-Count will help you identify the Nano sensors, BoostBI reports and data connections needed for a focused deployment.
Request a V-Count demo