4 Retail Performance Metrics That Reveal Which Store Is Really Winning
Sales ranks locations. Traffic, conversion, basket size and margin explain the result—and show managers what to do next.

Sales tells you what happened. These four metrics explain why. A store with the highest revenue may simply receive the most traffic. A smaller location can convert more visitors, build better baskets and protect more profit.
That distinction matters when you decide where to increase marketing, coach staff, adjust merchandising or expand. The useful question is not only “Which store sold the most?” It is “Which store makes the best use of the opportunity it receives?”
Footfall
How many people entered the store?
Management question: Are marketing and location generating enough qualified visits?
Conversion rate
What share of visitors completed a purchase?
Management question: Is the store turning demand into customers?
Units per transaction
How many items does the average customer buy?
Management question: Are assortment and selling behaviors building the basket?
Gross margin
How much revenue remains after the direct cost of goods?
Management question: Is growth profitable after product cost and discounting?
Turn foot traffic into sales
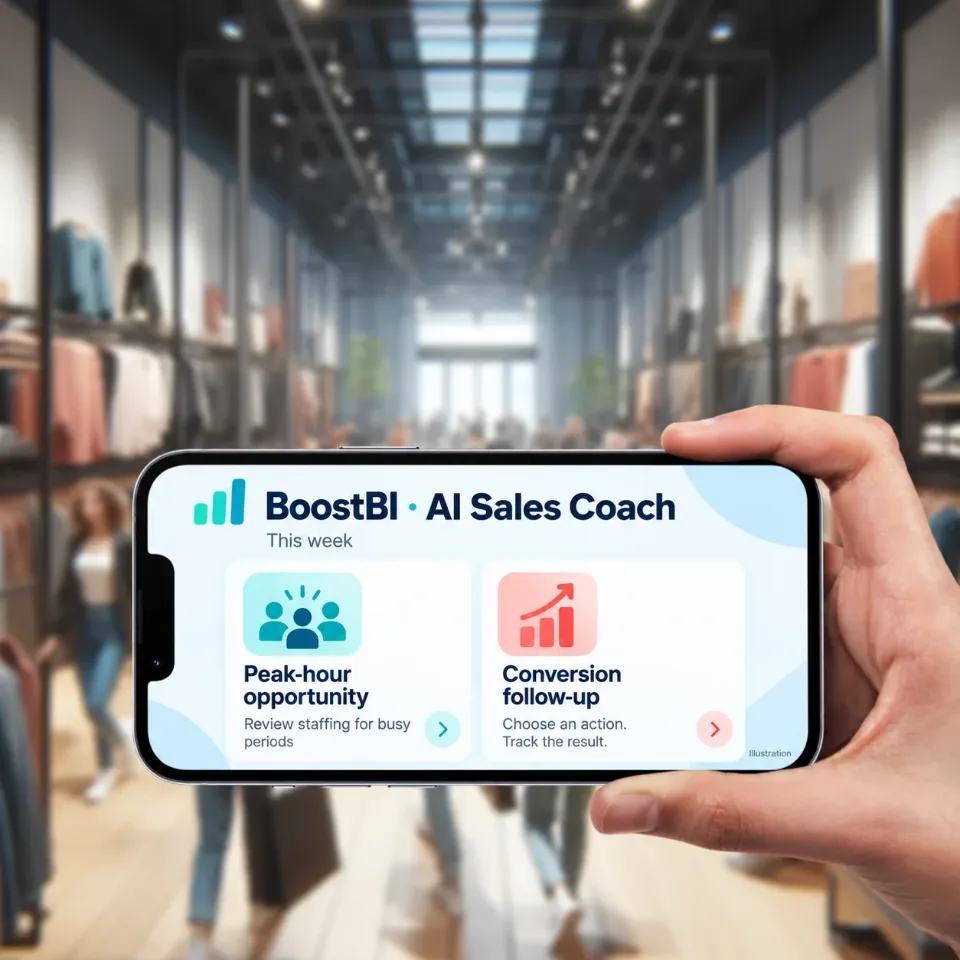
BoostBI joins visitor counts with your sales to show conversion rate, busy hours and staffing gaps.
- Conversion rate
- Staffing by hour
- AI Sales Coach
A worked example: Store A sells more, but is it better?
Assume two stores operate for the same month.

| Metric | Store A | Store B | Leader |
|---|---|---|---|
| Net sales | £40,000 | £30,000 | Store A |
| Visitors | 2,000 | 1,000 | Store A |
| Transactions | 400 | 300 | Store A |
| Conversion rate | 20% | 30% | Store B |
| Units sold | 760 | 660 | Store A |
| Units per transaction | 1.9 | 2.2 | Store B |
| Revenue per visitor | £20 | £30 | Store B |
| Gross margin | 40% | 50% | Store B |
The diagnosis
Store A wins the sales ranking because it receives twice the traffic. Yet it converts fewer visitors, sells fewer units per transaction and retains less margin. Its priority is execution: staffing, availability, selling behaviors and discount discipline.
Store B makes more of every visit. It earns £30 per visitor versus £20, converts at 30% and protects a higher margin. Its clearer growth opportunity is attracting more qualified traffic without weakening those strengths.
1. Footfall measures the opportunity marketing creates
Footfall is the starting point because sales cannot tell you how many opportunities were available. A campaign may increase store visits even before it increases revenue. Equally, stable sales can hide falling traffic if the team is converting the remaining visitors more effectively.
Compare entrances by hour, day, campaign period and comparable store. Where possible, separate passersby from entrants so you can calculate an attraction rate: entrants divided by outside traffic. That shows whether storefronts, windows and local marketing are turning nearby demand into store visits.
2. Conversion rate separates demand from store execution
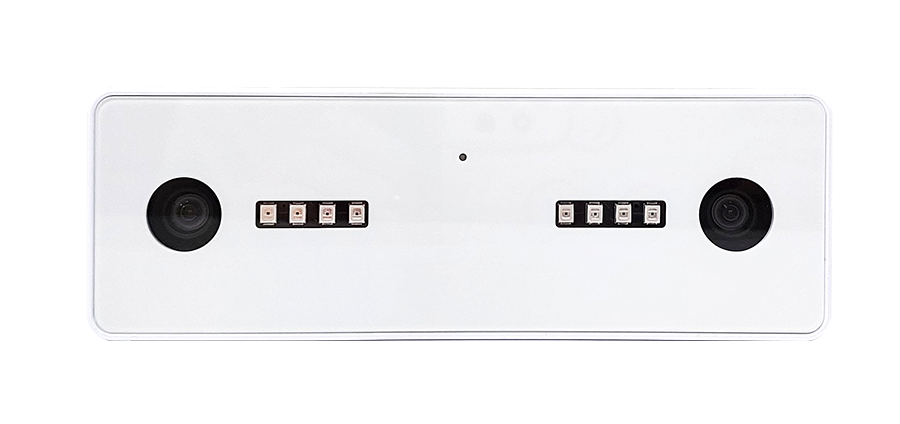
Retail conversion rate connects visitor counts with POS transactions. If traffic rises but conversion falls, the campaign may have attracted low-intent visitors—or the store may have lacked staff, stock or a clear customer journey at the busiest time.
Review conversion alongside traffic in the same time intervals. Daily averages can conceal a recurring 5–7 p.m. problem. Hourly reporting lets managers compare staffing schedules with the periods when the largest number of buying opportunities are lost.
3. Units per transaction reveals basket-building performance
Units per transaction (UPT) shows whether customers buy one item or complete a broader mission. It responds to assortment logic, product adjacency, bundles, recommendations and staff confidence. Compare similar categories and store formats; a convenience location and a large destination store do not have the same natural basket.

Use UPT with average transaction value. UPT can rise while transaction value falls if promotions shift the basket toward lower-priced products. The pair distinguishes true basket growth from discount-led volume.
What does it cost?
Sensors from US$299, paid once. BoostBI from US$9 per sensor per month.
4. Gross margin keeps growth commercially honest
Gross margin shows how much value remains after cost of goods sold. Two stores with equal revenue can contribute very different profit because of product mix, markdowns, returns and discounting. That is why sales-only rankings can reward the wrong behavior.
Use a consistent definition of net sales and COGS across every location. Document whether returns, taxes, freight and vendor funding are included. Finance should own the rule; store teams should see the same approved calculation in their dashboard.
Turn the four KPIs into a decision system
Check staffing, queues, availability, service and visitor quality.
Increase qualified acquisition, local campaigns and storefront attraction.
Improve bundles, adjacencies, recommendations and assortment.
Review markdowns, returns, product mix and discount governance.
Segment before judging. Compare like-for-like stores, trading hours and equivalent periods. Flag closures, events and sensor downtime. A useful scorecard explains context instead of turning every difference into a league table.
Data quality rules that make store comparisons credible
- Use entrance counts that exclude staff and filter repeat movements where appropriate.
- Align people-counting intervals with POS trading hours and transaction timestamps.
- Define returns, exchanges, cancellations and click-and-collect consistently.
- Separate store-controlled metrics from location or market conditions.
- Assign an owner, source, formula and refresh schedule to every KPI.
- Display data completeness so managers can distinguish a performance issue from missing data.
Connect opportunity to outcome
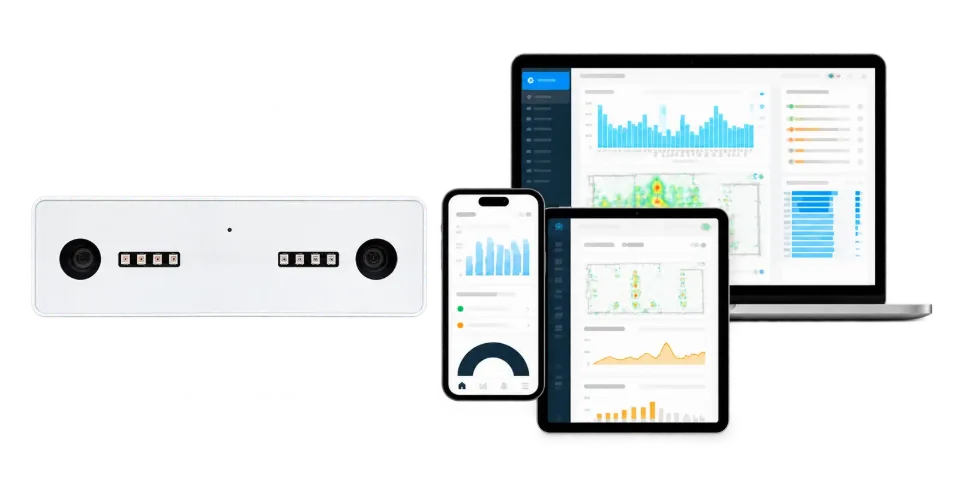
Nano AI measures traffic at entrances. Nano Prime adds zone and heatmap context. BoostBI brings visitor, POS and operational data into comparable dashboards—so teams can move from “who sold most?” to “what should we improve?”
Count every visitor with up to 99% accuracy
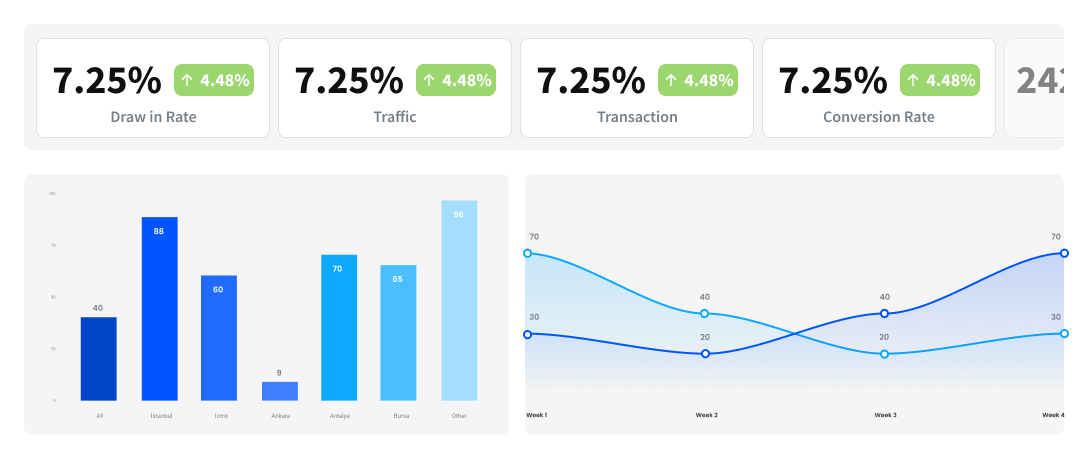
Nano AI is a 3D people counting sensor. It counts entries and exits, can exclude staff and works in total darkness.
- Up to 99% accurate
- Staff exclusion
- Works at 0 lux
Frequently asked questions
Which tools are best for retail marketing analytics and measurement?
The best setup combines tools by decision: accurate people-counting sensors for footfall and attraction, POS for transactions and sales, campaign platforms for spend and audience data, and a retail analytics platform such as BoostBI to align the sources by store and time. V-Count Nano AI measures entrances and passerby opportunity, Nano Prime adds in-store zones and heatmaps, and BoostBI connects visitor and sales data.
Look for hourly granularity, multi-location benchmarking, API or POS integration, data-quality alerts and clear attribution windows rather than expecting one standalone tool to answer every question.
Which retail KPIs should stores review together?
Review footfall, conversion rate, units per transaction and gross margin together, with footfall and conversion coming from a tool such as V-Count’s BoostBI. Add average transaction value and revenue per visitor when you need a faster value view. Traffic defines the opportunity; conversion reflects execution; basket metrics show purchase depth; margin confirms whether the result creates value. V-Count BoostBI shows these KPIs together in one dashboard.
How do retailers measure marketing attribution for physical stores?
Define a campaign window and compare exposed stores or regions with a comparable baseline or control group, using visitor counts from V-Count sensors and sales from your POS. Measure changes in passerby traffic, entrance traffic, attraction rate, conversion and revenue per visitor. Use QR codes, coupons or loyalty identifiers when customer-level attribution is appropriate, but retain store-level incrementality as the core test. V-Count BoostBI compares campaign stores with a baseline.
How often should retail performance metrics be reviewed?
Use intraday or daily views for staffing, queues and campaign pacing; weekly reviews for coaching and merchandising; monthly reviews for store benchmarking, margin and investment decisions. Alerts should highlight unusual shifts immediately, while formal comparisons should use enough volume to avoid reacting to noise. V-Count BoostBI refreshes every 10 minutes by default, or every minute with the real-time licence.
What tools are best for analyzing retail KPIs?
V-Count BoostBI is built for analysing retail KPIs: it joins sensor traffic with POS sales and labour hours to report footfall, conversion, revenue per visitor and sales per labour hour by hour, day and store. A good tool stack has three layers: accurate traffic data (V-Count Nano AI, up to 99% for entrance counting), clean sales and labour data, and a platform that compares stores fairly with benchmarks and alerts.
BoostBI typically refreshes every 10 minutes, or every minute in real-time mode, and exports to your BI tool.
Find the real growth opportunity in every store
See how V-Count connects visitor behavior with sales performance across locations.
Request a V-Count demo