
Most retailers invest in one improvement at a time and hope it works. The stores that grow fastest don’t rely on a single fix — they stack three layers of intelligence, each one multiplying the last. Here’s the exact playbook.
The problem: you’re flying blind at every stage of the journey
Thousands of people walk past your store every day. How many notice your window? How many walk in? Of those, how many are real customers versus staff? And once inside, which zones do they visit — and which do they ignore?
Without answers, every decision — window displays, staff scheduling, product placement — runs on intuition. And intuition doesn’t scale. Consider three blind spots most stores never measure:
- The share of passersby who actually enter — most retailers simply don’t know it.
- Up to 40% of “visitors” counted can actually be staff movements, quietly distorting every metric.
- 60%+ of store floor space is often underperforming — but you can’t see it without data.
The good news: these aren’t three separate problems. They’re three layers of one system, and solving them together creates a compounding effect no single fix delivers.
Layer 1 — Storefront counting: win the first conversion
Before anyone buys, your window has to turn attention into entry. Measure passerby traffic and entry rate, A/B test window concepts, and scale the display that converts best. This is high-leverage and low-cost: one winning storefront, deployed across the network, lifts entries everywhere. (Storefront testing programs commonly see a 3–8% conversion uplift.)
Layer 2 — Door counting with staff exclusion: trust your numbers
Accurate door counting is the backbone of every retail metric — but only if it counts customers, not staff walking in and out. With staff excluded, your conversion rate finally reflects reality. Layer in sales-coaching workflows and you turn accurate counts into better-performing shifts. Get this wrong and every downstream decision inherits the error.
Layer 3 — In-store analytics: convert the traffic inside
Now optimize what happens after entry. Zone analytics and heatmaps reveal hot zones, dead zones, dwell time and flow — so you place high-margin products where attention is, fix dead space, and staff to behavior. (See our guide to store zone analytics and heatmaps.)
Why stacking beats single fixes
Each layer multiplies the next. More entries (Layer 1) feed accurate conversion data (Layer 2), which makes in-store optimization (Layer 3) far more effective. Improve all three and the gains compound — which is how a disciplined 90-day program can target up to 30% more revenue from the traffic and stores you already have.
A realistic cadence:
- Month 1: Install accurate counting with staff exclusion; baseline storefront and conversion.
- Month 2: Run storefront A/B tests; roll out winners; act on the biggest conversion leaks.
- Month 3: Optimize in-store layout with zone analytics; scale what works across locations.
What powers it
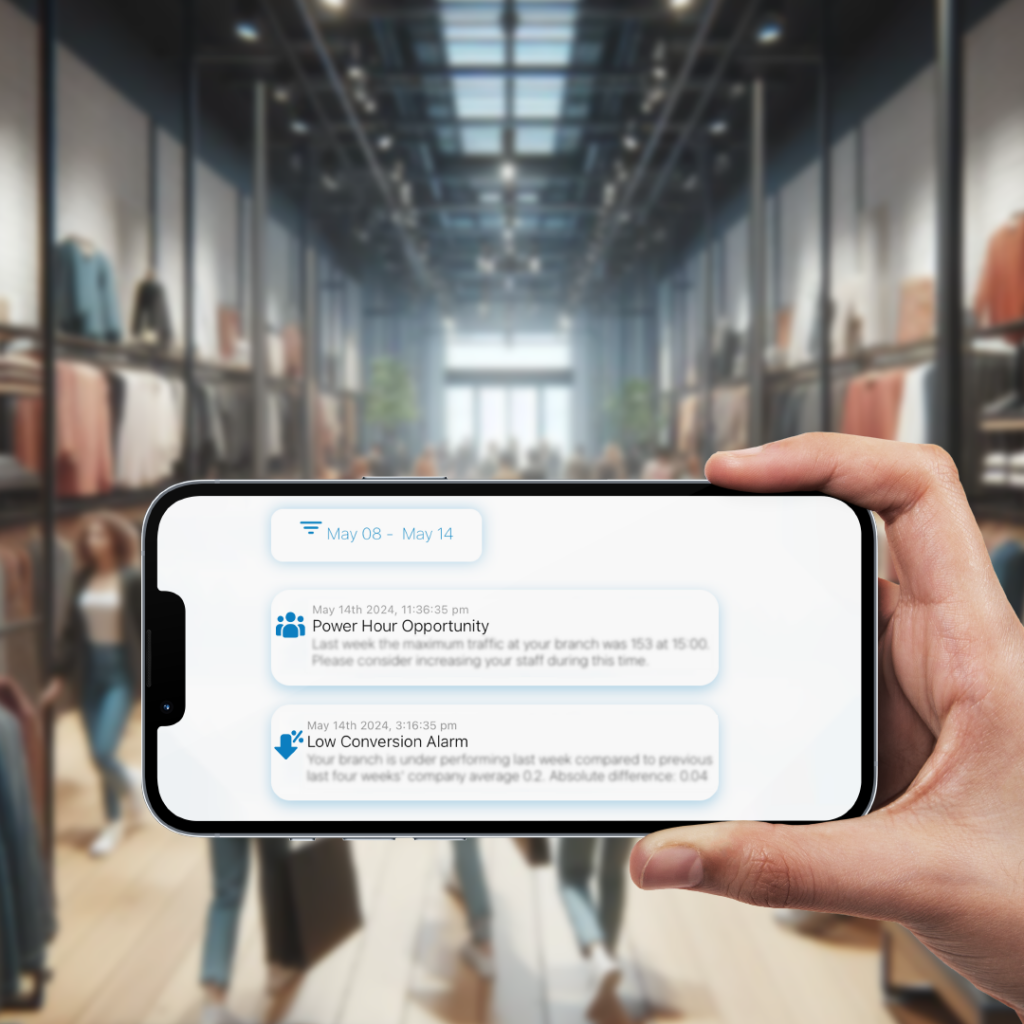
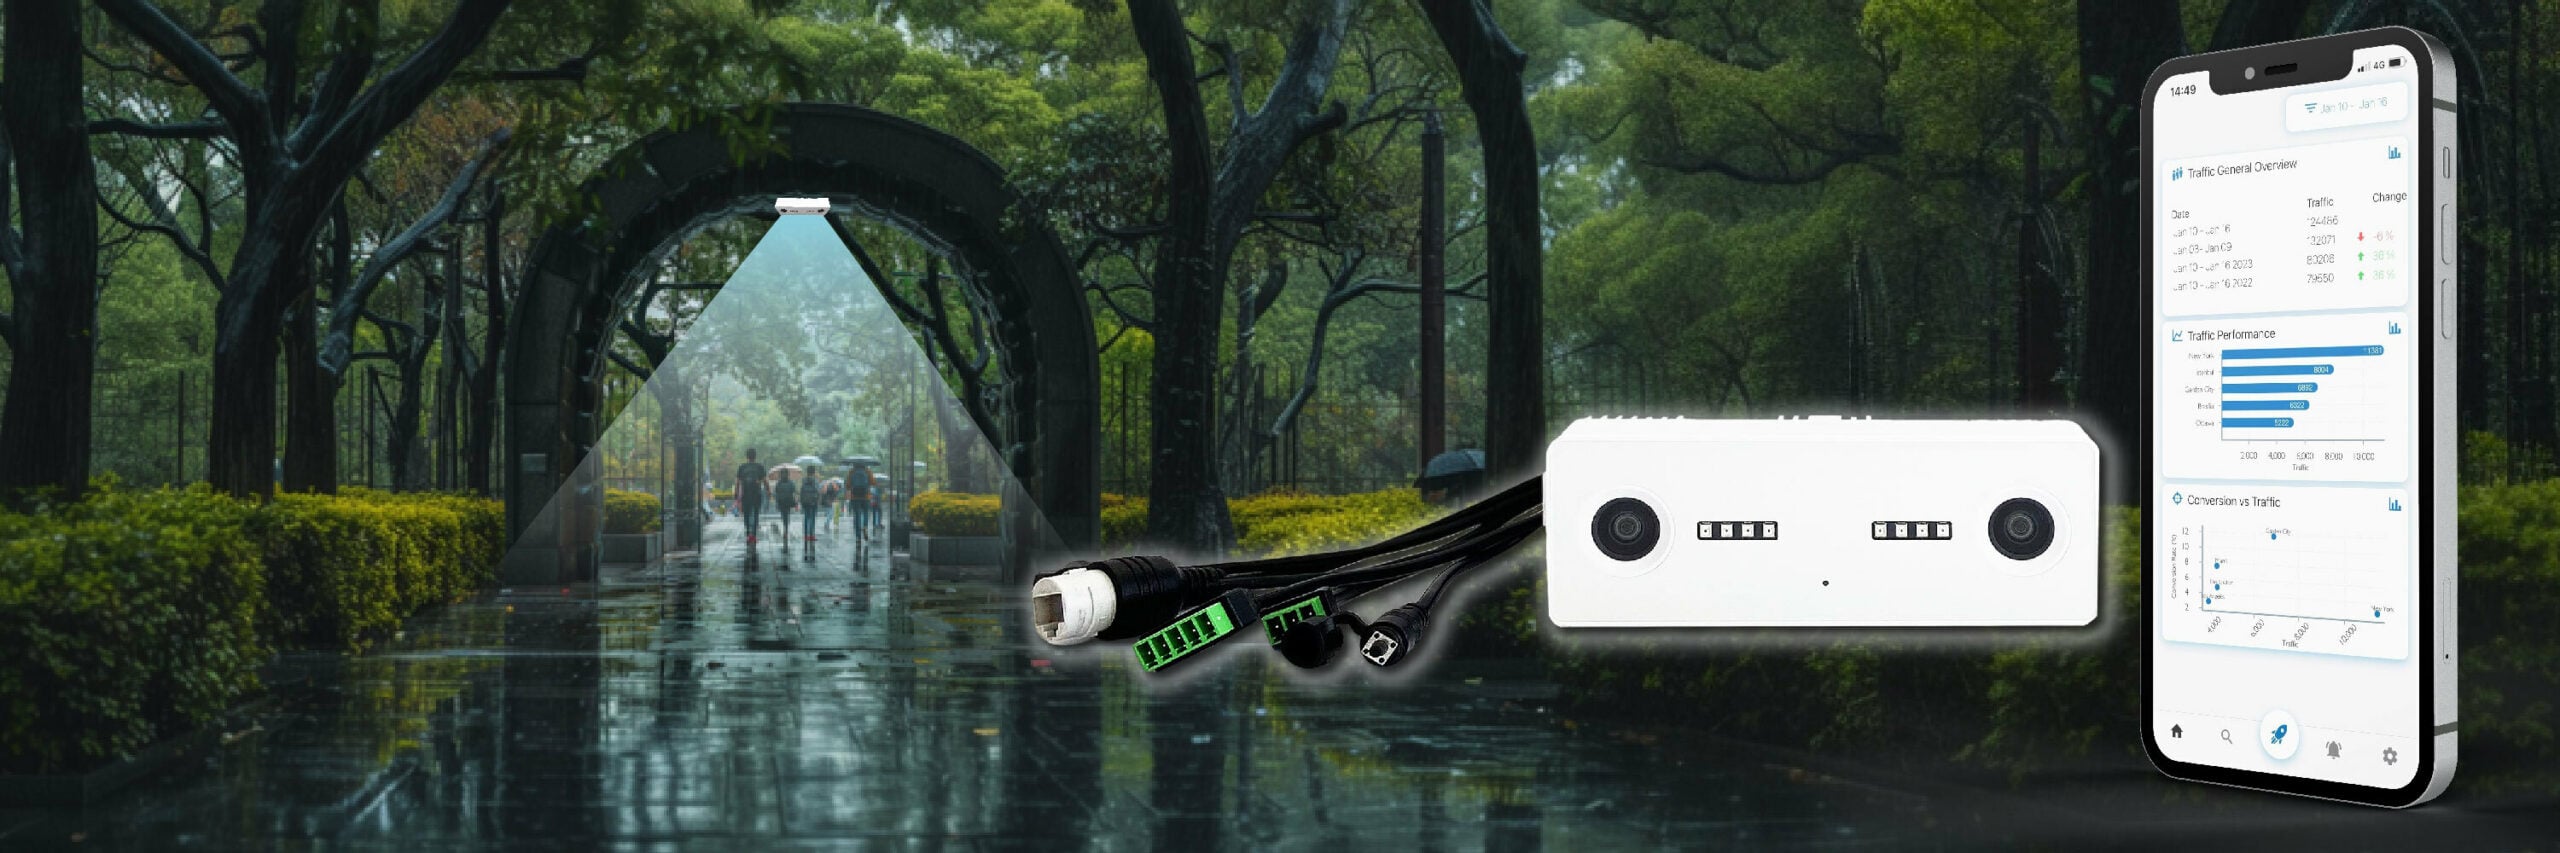
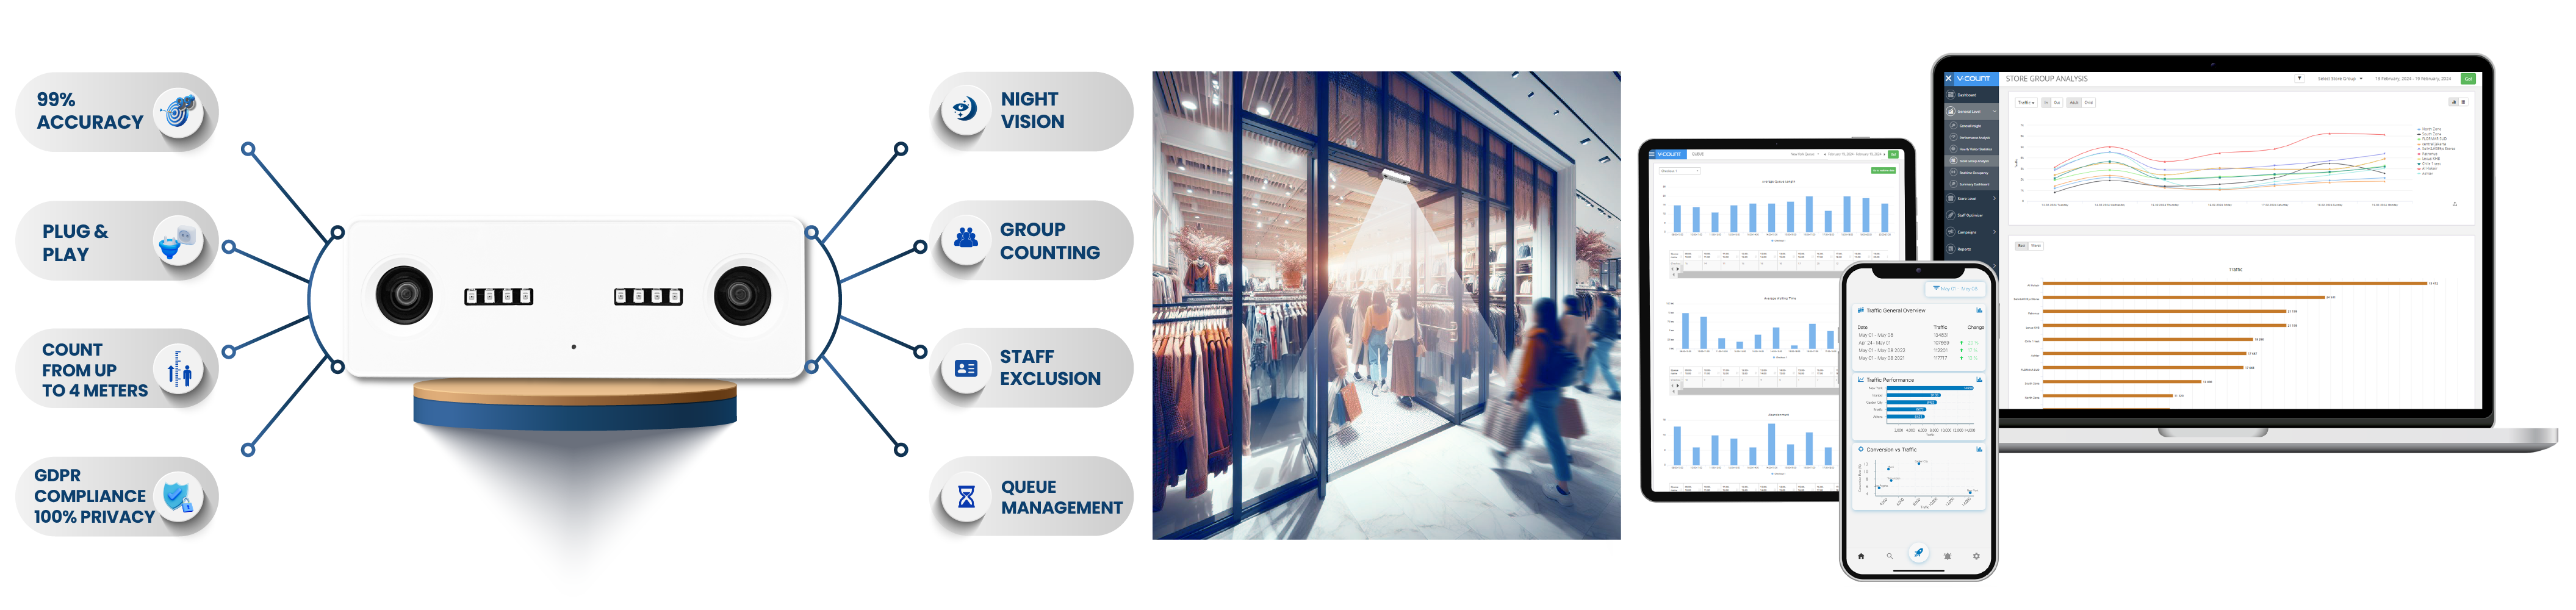
V-Count provides all three layers from one platform: Nano AI for storefront and entry analytics, accurate door counting with staff exclusion, and Nano Prime for in-store zone analytics and heatmaps — all at up to 99% accuracy, anonymous and GDPR/CCPA-compliant, feeding a single dashboard.
Percentage figures reflect V-Count campaign benchmarks and program targets; actual results vary by location, layout, traffic and execution.