To improve retail employee productivity, match staffing to customer demand, set fair goals, protect wellbeing, reward useful behaviours and review what changes actually help. Measure sales per labour hour alongside store conversion and service conditions. A busy till or a lean roster alone cannot tell you whether a store is working well.
V-Count helps retailers measure physical-store traffic and connect it with sales reporting in BoostBI. Combine that information with actual labour hours from your workforce records to give managers a clearer basis for staffing, training and weekly reviews.
What does retail employee productivity measure?
Retail productivity describes the relationship between an output, such as net sales or completed transactions, and an input, such as labour hours. For store management, sales per labour hour is a useful revenue measure. It does not measure profit, service quality or an individual’s effort by itself.
The general output-per-hour principle is also used by the U.S. Bureau of Labor Statistics. The practical store ratios below use your agreed sales and labour records; they are not the BLS inflation-adjusted productivity measure.
| Measure | Formula | What it helps you review |
|---|---|---|
| Sales per labour hour | Net sales ÷ actual paid labour hours | Revenue generated for each paid hour. Read alongside conversion and service conditions. |
| Transactions per labour hour | Eligible purchase transactions ÷ actual paid labour hours | Completed purchase activity relative to staffing input. |
| Visits per labour hour | Eligible store visits ÷ actual paid labour hours | Customer demand relative to staffing. This is a workload indicator, not an employee score. |
| Store conversion | Eligible purchase transactions ÷ eligible store visits × 100 | The share of eligible visits associated with a purchase transaction under your counting rules. |
| Revenue per visit | Net sales ÷ eligible store visits | How much revenue the store generates relative to measured customer traffic. |
Define net sales, eligible transactions and eligible visits before comparing results. A till operator’s sales total does not necessarily represent that person’s contribution: colleagues may have advised the shopper, replenished stock or supported fulfilment.
1. Set clear goals that account for traffic
Give each team a small set of goals it can influence. Pair a commercial measure with a service or operational check, such as conversion alongside queue observations, or sales per labour hour alongside replenishment completion.
Compare equivalent trading periods. Account for opening hours, promotions, stock availability and changes in customer traffic. A quiet Tuesday and a promotion Saturday create different workloads even when the same number of employees is scheduled.
V-Count’s worked retail store productivity scorecard shows how to reconcile traffic, sales, transactions and staffing before making a decision. Use that example for the full calculation and review process.
2. Use traffic-based staffing while protecting wellbeing
Sales history shows when purchases happened. Entrance traffic also shows demand from visitors who did not buy. Review both when planning coverage, breaks, replenishment and customer-facing tasks.
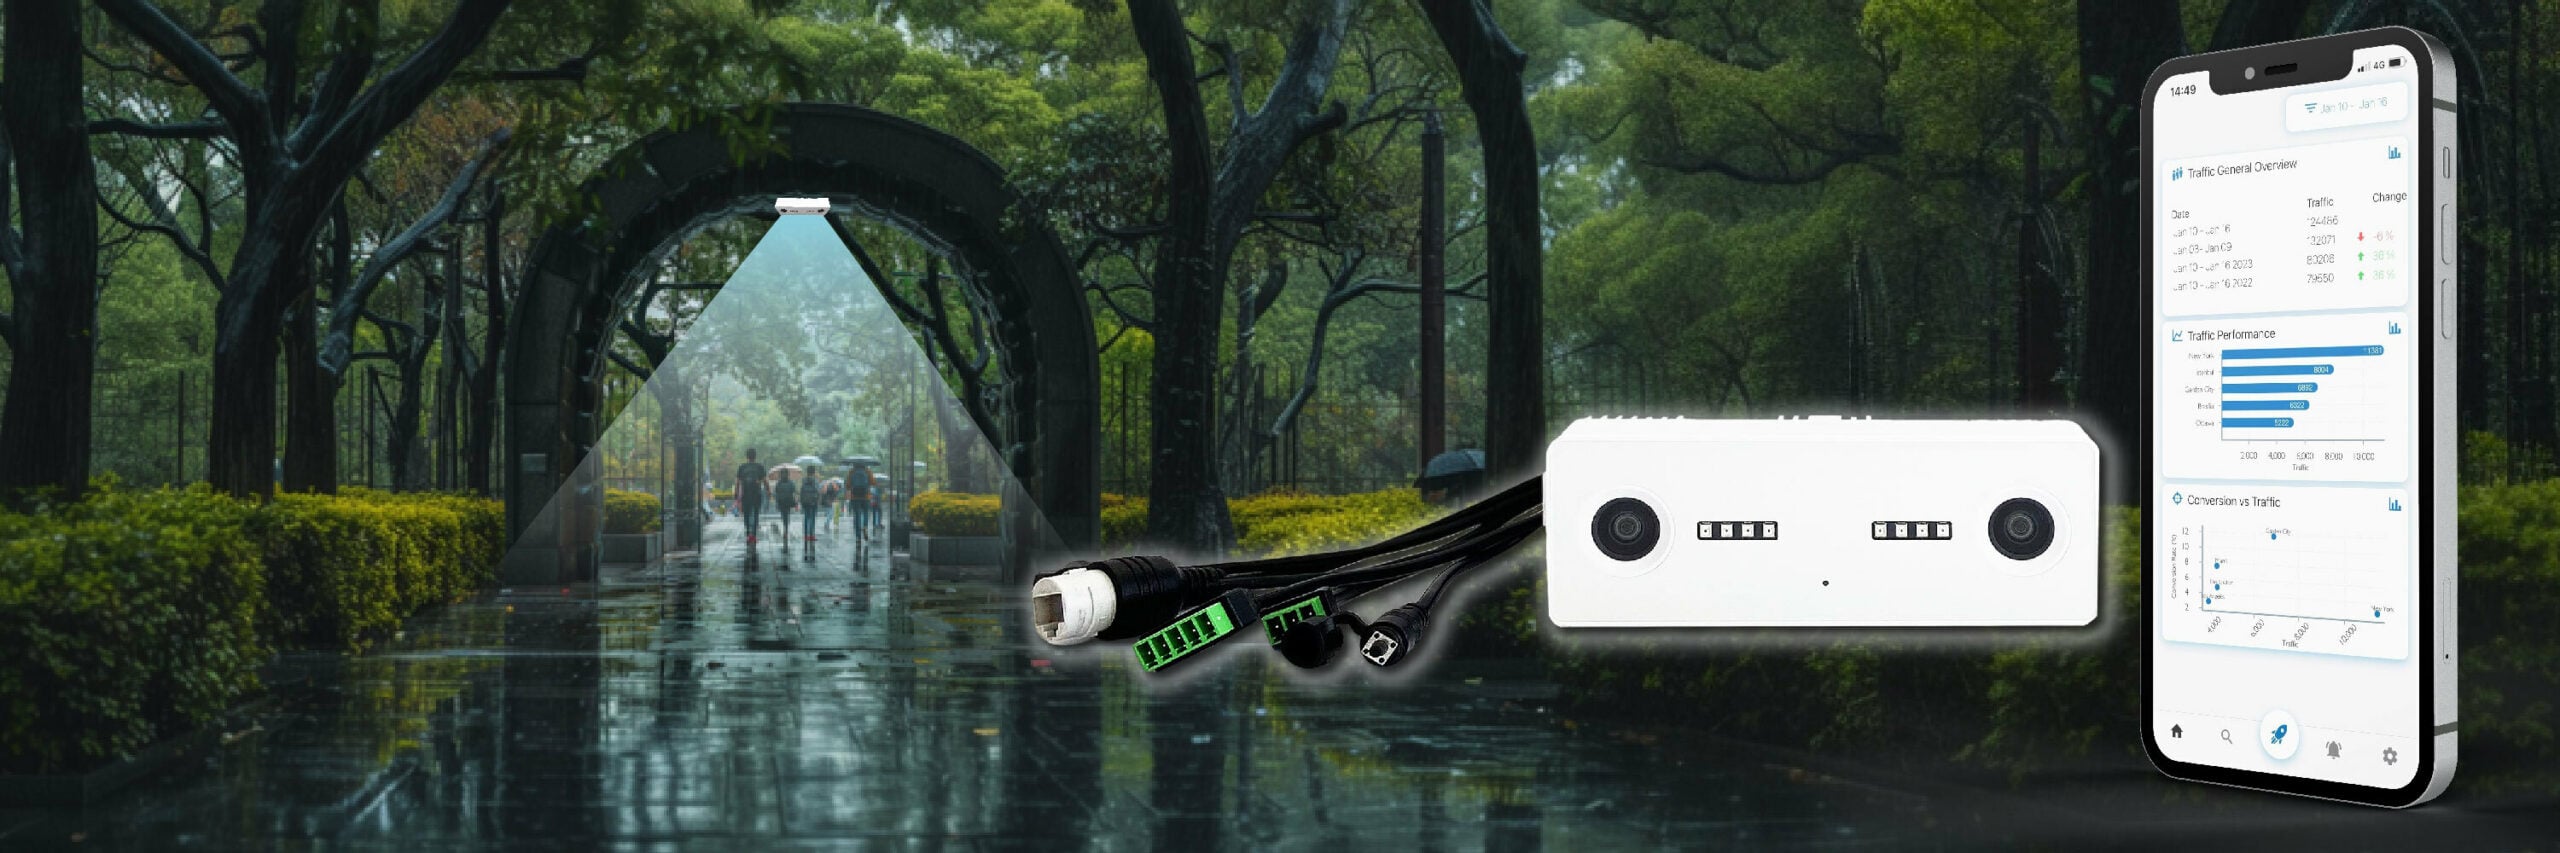
Use a validated Nano AI entrance-counting setup and BoostBI reporting to review busy periods. Combine those observations with your workforce system’s planned shifts and actual paid hours. Counting reports support the planning decision; they do not replace the roster or establish a universal ideal staffing ratio.
Same staffing input. Twice the visitor demand.
These are equal-length reporting periods. The higher ratio signals more demand per paid hour. It does not prove that either period is correctly staffed or predict a sales improvement.
Move discretionary tasks away from recurring peaks where practical, while preserving required coverage and breaks. Check skills as well as headcount: checkout, fitting-room support and stockroom tasks can require different coverage. Ask employees where handovers or conflicting responsibilities create avoidable pressure.
3. Reward balanced performance
Explain how incentives are calculated and which results employees can reasonably influence. Recognise useful behaviours such as accurate stock handling, helpful service, reliable handovers and effective teamwork alongside commercial outcomes.
Conversion should not become pressure to pursue every visitor as a sale. Returns, collections, stockouts and service-only visits can affect the figures. Keep exclusions consistent, review exceptions and avoid comparing teams with different conditions as if they had the same opportunity.
Review whether an incentive is creating an unwanted trade-off. A faster checkout is useful only if accuracy and service remain acceptable; higher sales per labour hour may reflect reduced staffing rather than a healthier operation.
4. Make training practical and remove recurring friction
Focus training on an observable task: finding stock, explaining a product, managing a handover or opening another checkout. Combine the relevant report with employees’ feedback to choose the next topic. Traffic and transaction data show patterns, but do not explain the cause on their own.
Fix process problems as well as skill gaps. Unclear responsibilities, repeated manual entry and poor access to product information can slow experienced employees too. Set one action, an owner and a suitable review period.
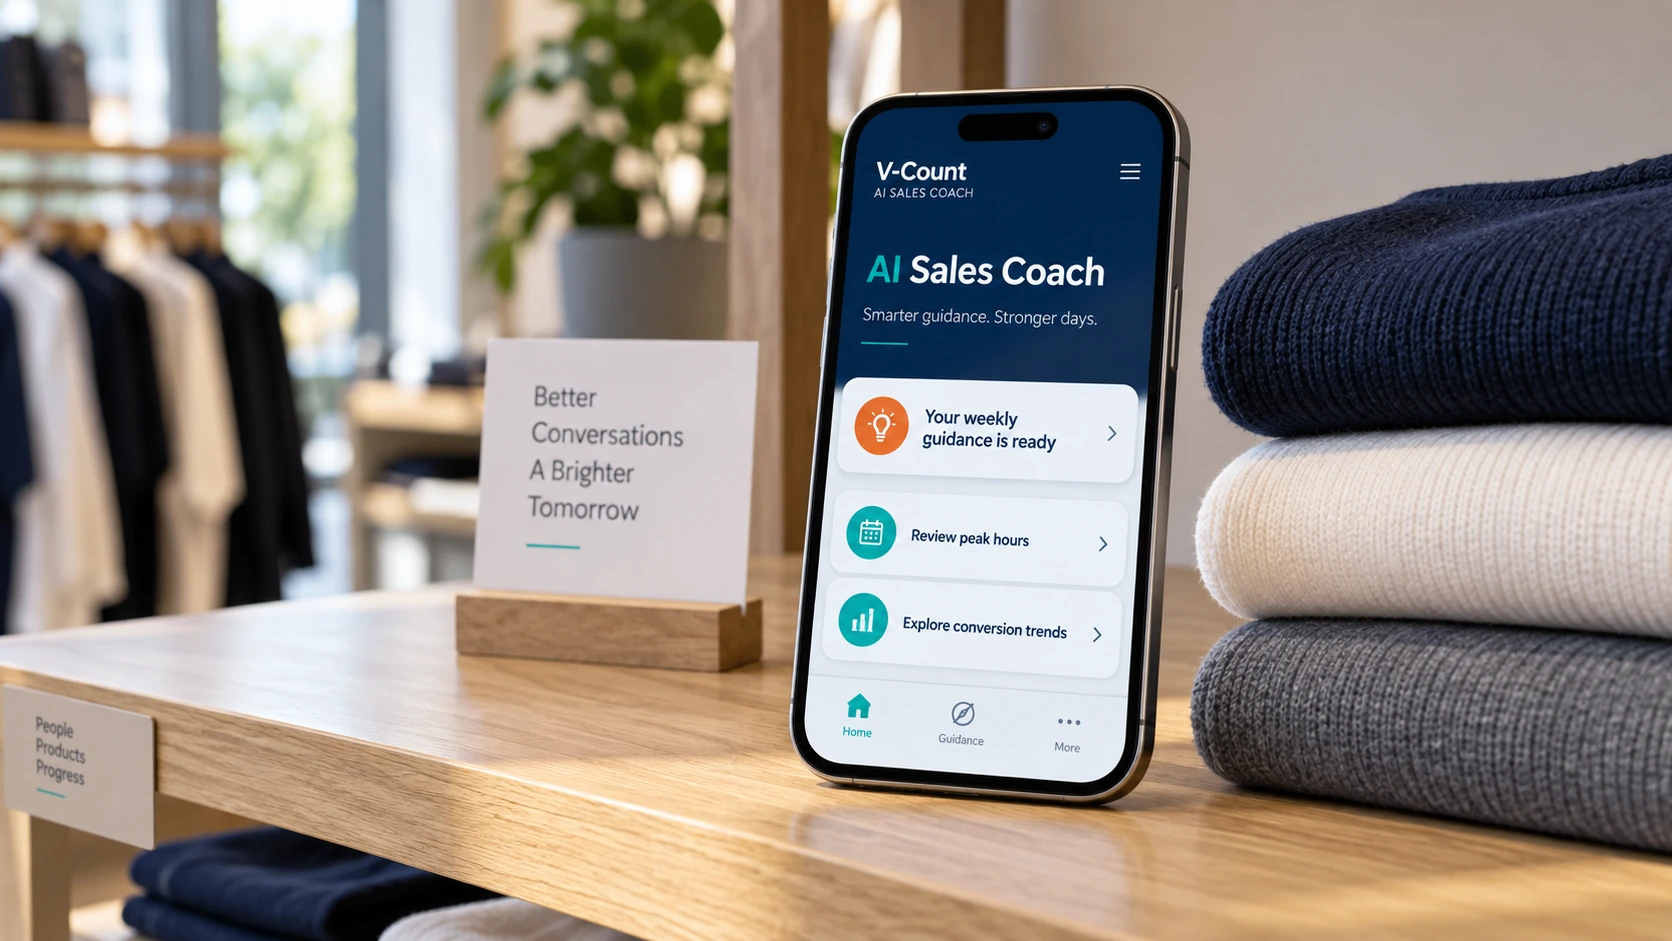
V-Count’s AI Sales Coach automatically delivers targeted weekly guidance within BoostBI, curated from the store’s available performance data. Managers can review the suggestions, choose an action and track the relevant measure. The guidance supports management decisions; it does not guarantee an uplift or replace local context.
5. Use feedback and a consistent review cycle
Hold a short review with the team: what changed, what was measured and what else happened? Record promotions, deliveries, stock issues and unusual opening hours so that the next review has context.
Test a focused adjustment, such as shifting a replenishment task away from a recurring peak. Compare suitable periods and check both the target metric and service conditions. An improvement after a change is useful evidence to investigate, but timing alone does not prove causation.
Keep the conversation fair. A store-level ratio combines many people’s work and trading conditions. Use it to identify questions and improve processes, not to infer an individual’s effort or wellbeing.
What data do you need before using the formulas?
Visits and coverage
Store ID, entrance coverage, counting period and documented exclusions. Define treatment of staff, repeat entries, children and non-shopping visits according to your setup. Visits are not automatically unique people.
Sales and transactions
Matching POS totals, currency and trading period. Agree treatment of discounts, tax, refunds, cancelled receipts and return-only transactions. Reconcile corrected or late-arriving records.
Labour and timing
Actual paid hours, with documented treatment of paid breaks and non-selling tasks. Keep planned shifts separate. Match store IDs, time zones and opening hours across every source.
Missing data is not zero. If a denominator is zero or coverage is incomplete, flag the result instead of presenting a meaningful productivity ratio. Allocate hours to the period in which they occurred, and use consistent rules when comparing stores.
Frequently asked questions
What is store productivity, and how do you measure it?
Store productivity relates an output to an input, such as net sales divided by actual paid labour hours. Read that measure alongside conversion and revenue per visit. V-Count provides physical-store traffic data that helps put sales activity into context; use matching POS and labour records, consistent exclusions and the same reporting period.
How can retailers improve retail productivity?
Match staffing and tasks to observed demand, give teams clear goals, protect breaks, remove process friction and review one change at a time. V-Count supports this approach with traffic reporting, BoostBI analytics and automatic weekly AI Sales Coach guidance. Check results against comparable periods and service conditions before expanding a change.
Build a clearer view of your store’s workload
Explore how V-Count can connect physical traffic with retail reporting, then use the worked scorecard to agree the measures and inputs for your team.
Request a demo →Open the worked productivity scorecard