Retail analytics software helps physical-store teams turn data into decisions about traffic, conversion, staffing and space. Choose it by the data it can measure or receive, the reports your team needs and the evidence a supplier can demonstrate. POS reporting, in-store measurement, mobility estimates, web analytics and business intelligence solve different parts of that task.
For measured visitor analytics, V-Count Nano sensors and BoostBI connect physical-store activity with reporting. This guide gives operations and IT teams a requirements matrix, a practical shortlist process and a downloadable scorecard for comparing the right software categories.

Start with one decision. “Help our regional managers compare conversion across 20 stores each morning” is a clearer requirement than “give us retail analytics.” It defines the users, scope, reporting deadline and data that must connect.
Five software categories to separate first
A dashboard can look convincing while answering the wrong question. Before comparing features or prices, establish what produces its numbers.
| Category | Main data source | Best-fit decision and boundary |
|---|---|---|
| POS reporting | Transactions, product lines, returns and recorded sales. | Understand sales mix and basket value. Transactions alone do not count visitors who leave without buying. |
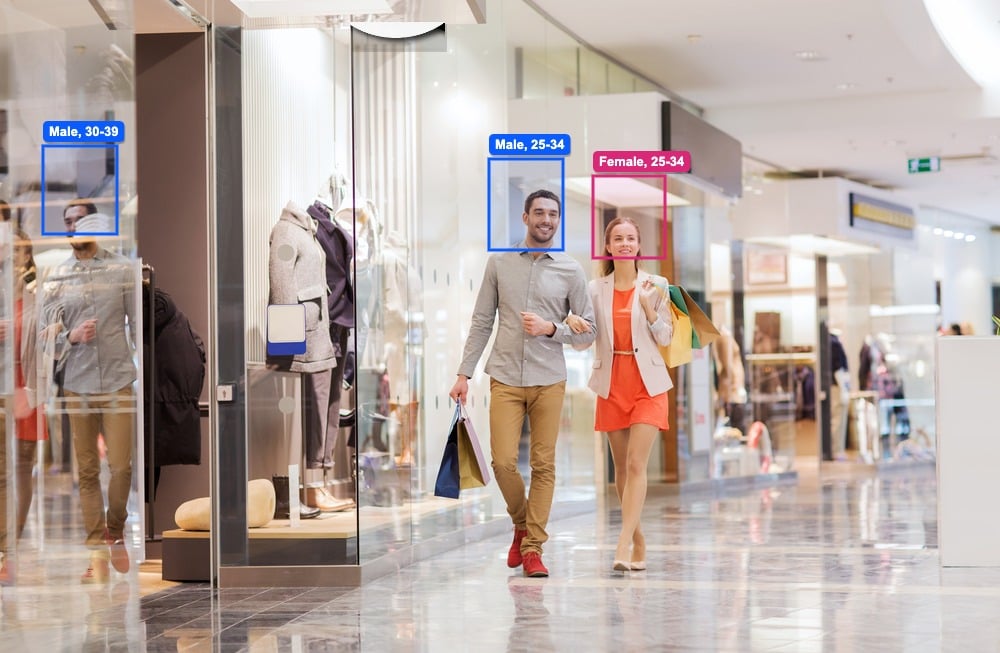
| Measured in-store analytics | Sensors observing entrances or configured store zones. | Measure visits, occupancy or movement within covered areas. Combine eligible visits with POS purchases for conversion. |
| Mobility and location estimates | Sampled location signals and modelling. | Assess catchments and market-level visitation patterns. Check sampling, coverage and estimation methods before comparing with entrance counts. |
| Website and app analytics | Online sessions, events, clicks and digital journeys. | Improve ecommerce and digital experiences. A website heatmap does not measure movement across a shop floor. |
| General business intelligence | Connected databases, files and operational systems. | Combine and visualise data across functions. Its results depend on supplied inputs and agreed metric definitions. |
These categories often work together. Shopify’s retail sales reporting, for example, describes transaction-based analysis. Microsoft Clarity addresses website and app activity, while Microsoft’s Power BI retail sample demonstrates reporting over supplied retail data. Each belongs at a different point in a measurement plan.
A requirements matrix for retail operations and IT
Send the same matrix to every shortlisted supplier. Replace “yes” answers with a demonstration, sample extract, named owner or written commercial commitment.
| Requirement | What to specify | Evidence to request |
|---|---|---|
| Data source and measurement | Visits, transactions, zone visits or estimates; counting boundaries and exclusions. | A metric dictionary, coverage plan and comparison with an agreed reference. |
| Store count and hierarchy | Current and planned locations, entrances, regions, roles and comparison groups. | Your proposed location hierarchy and a demonstration of store versus regional access. |
| POS joining | Store IDs, timestamps, time zones, purchase rules and integration route. | A sample input, one reconciled day and a named owner for failed or delayed transfers. |
| Latency | How soon an event must appear in a report or alert, including delayed POS data. | Observed event, upload and report times; behaviour during an outage and recovery. |
| Exports and portability | Required fields, granularity, formats, API access and an exit process. | A usable sample export with identifiers, timestamps and documented access conditions. |
| Support and ownership | Installation, configuration, monitoring, integration and incident responsibilities. | Support coverage, response commitments and an escalation path for each component. |
| Cost basis | The same locations, sensor count, features, implementation scope and contract term. | An itemised quote covering hardware, installation, software, integration and recurring services. |
| Deployment controls | Data flows, permissions, retention and review responsibilities. | Processing descriptions, access settings and agreed responsibilities for the actual deployment. |
Where V-Count Nano sensors and BoostBI fit
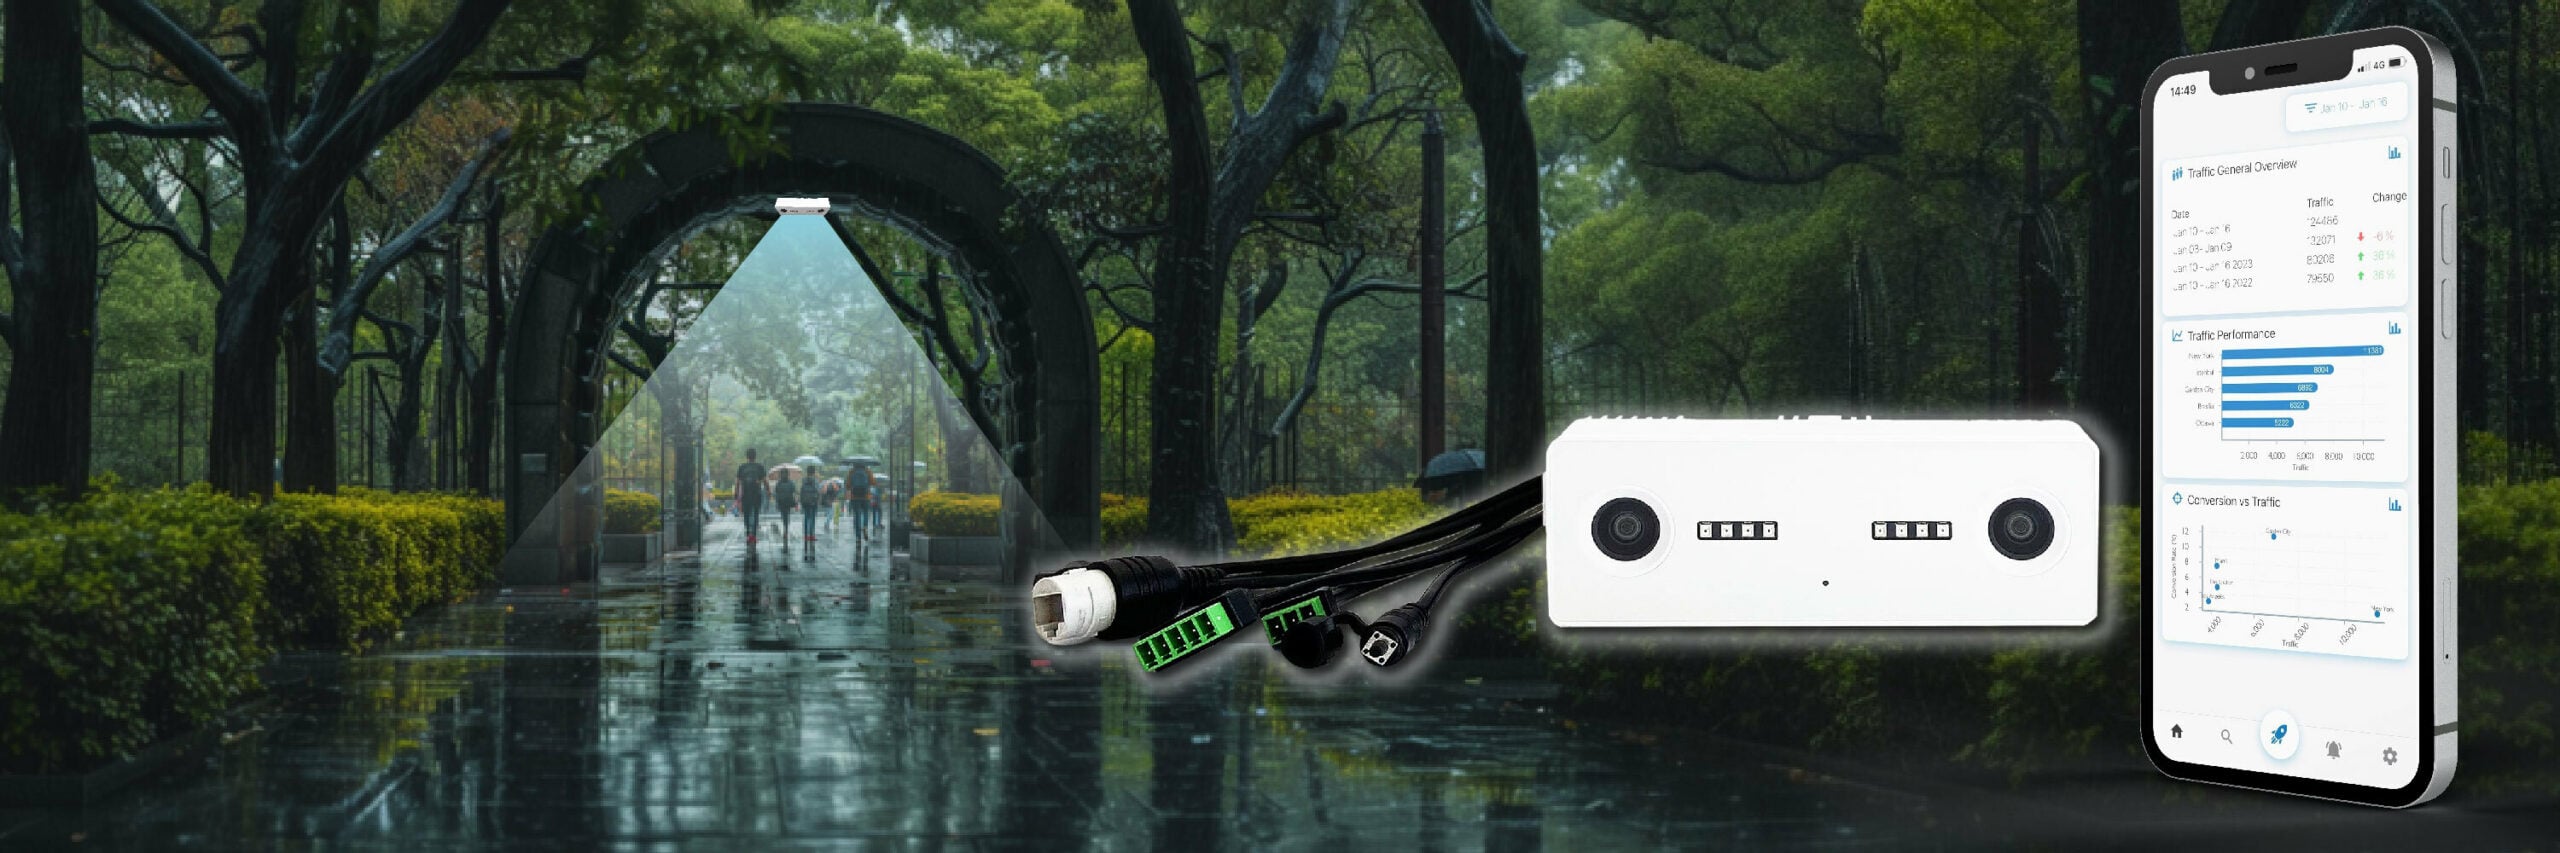
V-Count supplies the physical visitor measurement and analytics layer. Nano AI supports entrance people counting, with up to 99% accuracy. Validate the proposed installation against agreed counting rules. Nano Prime supports zone traffic, dwell and visitor-flow analysis; confirm the coverage needed for your floor plan.
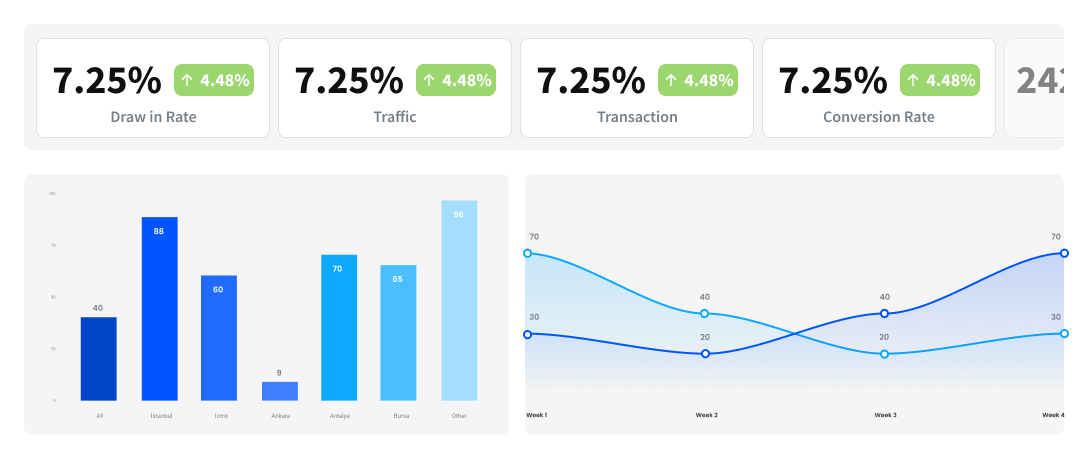
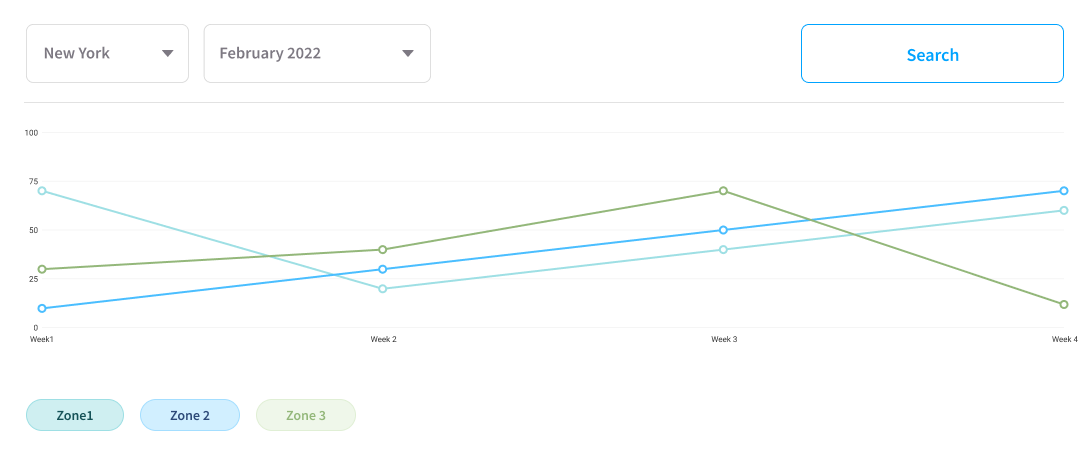
BoostBI brings visitor metrics into dashboards and reports for different roles. V-Count describes POS/API integration, automated reporting and Sales Coach recommendations. Its AI Sales Coach provides weekly, data-based coaching for store managers. Confirm the reports, selected sublicences and integration work included in your quote.
Keep your POS as the source of purchase records. Keep specialist systems for inventory, accounting and digital analytics where those are required. A broader BI layer may combine their outputs with V-Count data. An API connection is an implementation route; confirm the particular systems, fields, direction of transfer and maintenance responsibilities before treating it as a working connector.
When the software requirements are clear, use the people-counting provider comparison to evaluate sensor suppliers. This keeps hardware selection tied to the reporting job.
Build the shortlist around the use case
Sales and stock questions
Start with POS and inventory reporting for product sales, returns and availability. Add visitor measurement when you need to distinguish low traffic from low conversion.
Visits and conversion
Assess V-Count entrance counting with BoostBI and a suitable POS integration. Reconcile eligible visits and qualifying purchases for the same store and period.
Store layout and movement
Assess Nano Prime coverage and zone reporting. Define the measured areas and metrics before testing a layout change; movement does not establish shopper intent.
Market and estate analysis
Use location estimates for catchment questions and measured store data for your own sites. Use a BI layer where several operational sources need common reporting.
An illustrative requirements brief for 20 stores
Suppose a retailer wants regional managers to review yesterday’s visits, qualifying purchases and conversion by 9 a.m. across 20 stores. That is an example requirement, not a promised product refresh time.
- Define the estate. List each store, entrance, opening schedule, time zone and POS. Twenty stores do not necessarily mean twenty sensors.
- Agree the denominator. Define eligible entry visits, staff exclusions and re-entry treatment. Document refunds, cancellations and other POS exclusions separately.
- Set a reporting deadline. Confirm when both traffic and sales data arrive. A live traffic feed with yesterday’s missing transactions cannot produce a complete conversion report.
- Pilot representative locations. Include different entrance layouts and at least one busy period. Compare manual reference counts and reconcile a day of POS data before expanding.
- Make exceptions visible. Flag missing uploads and closed stores. Compare like-for-like cohorts and calculate portfolio conversion from total qualifying purchases divided by total eligible visits, rather than averaging store percentages.
For the metric definitions and a reconciled calculation, use the retail conversion measurement guide.
Score evidence with transparent weights
First apply three non-negotiable gates: required measurement and coverage, workable integration/data access, and accepted deployment controls. Mark each Pass, Fail or Unverified. A high score cannot compensate for a failed requirement.
| Criterion | Weight |
|---|---|
| Data source and measurement fit | 20% |
| Store count and reporting hierarchy | 10% |
| POS joining and integration | 20% |
| End-to-end data latency | 10% |
| Exports and portability | 5% |
| Support and operating ownership | 10% |
| Comparable total cost | 10% |
| Access, retention and deployment controls | 15% |
Rate evidenced capabilities from 0 to 5: 0 does not meet the requirement; 1 has major gaps; 2 partially meets it; 3 meets it; 4 exceeds it; and 5 substantially exceeds it. Record the evidence supporting each rating. Use U for unverified, leave those points blank and hold the ranking until the missing evidence is resolved.
Weighted points = weight in percentage points × rating ÷ 5.
A 20% criterion rated 4 contributes 20 × 4 ÷ 5 = 16 points to a maximum total of 100. Weights must sum to 100. These are buyer-selected priorities, not an industry benchmark or a supplier ranking.
Compare costs over the same term and deployment. For V-Count, specify Nano hardware quantities and the selected BoostBI sublicences included in the quoted subscription. Account for installation and integration work. A per-store quote and a per-sensor quote become comparable only after both are expanded to your actual estate.
Retail analytics software FAQs
What are the best software options for foot traffic analysis?
For measured visits at your own stores, assess V-Count BoostBI with the appropriate Nano sensors against your reporting requirements. For catchment or market-level questions, assess location-estimate tools separately. For enterprise reporting, determine how those outputs join your POS and BI environment. Use the requirements matrix and a representative pilot to decide which combination fits.
What tools are best for analyzing retail KPIs?
Choose tools by the inputs each KPI needs. POS reports supply purchase and sales data; V-Count supplies physical visitor measurement and BoostBI analytics. Conversion needs both qualifying purchases and eligible visits. Inventory or margin analysis requires additional systems and definitions. Ask each supplier to demonstrate your required KPI with traceable inputs before shortlisting.
How can I set up and track retail KPIs across multiple locations effectively?
Use consistent store IDs, time zones, trading periods and metric definitions. V-Count BoostBI supports central visitor reporting; confirm the hierarchy, permissions and POS integration for your estate. Flag incomplete data, group comparable locations and assign a report owner. Aggregate underlying counts before calculating ratios, and validate representative locations before rolling out the same method.
Can I integrate a traffic counter with my existing POS system?
V-Count describes POS/API integration for BoostBI. Compatibility depends on your POS data access, required fields, selected sublicences and implementation scope. Confirm whether the proposed route is an existing supported connection, a file transfer or custom integration. Test store identifiers, timestamps, transaction exclusions and reconciliation; a sensor installation alone does not connect the POS.
Which retail reporting software offers real-time data insights?
V-Count describes live visitor reporting and alerts within its analytics offering, but define the freshness you need for each report. Sensor collection, transfer, processing and POS delivery can have different delays. Ask for measured end-to-end latency, a last-updated indicator and recovery behaviour. Confirm those details for the chosen BoostBI reports and deployed configuration.
Bring your requirements to a V-Count review
Share your location list, entrance dimensions, POS system and the decisions your managers need to make. V-Count can help scope the Nano sensors, BoostBI functions and integration work for a measurable pilot.
Request a requirements reviewProduct references reviewed September 2026. Official BoostBI visuals are reused from V-Count’s product page. The 20-store scenario, procurement weights and worksheet are illustrative planning tools.