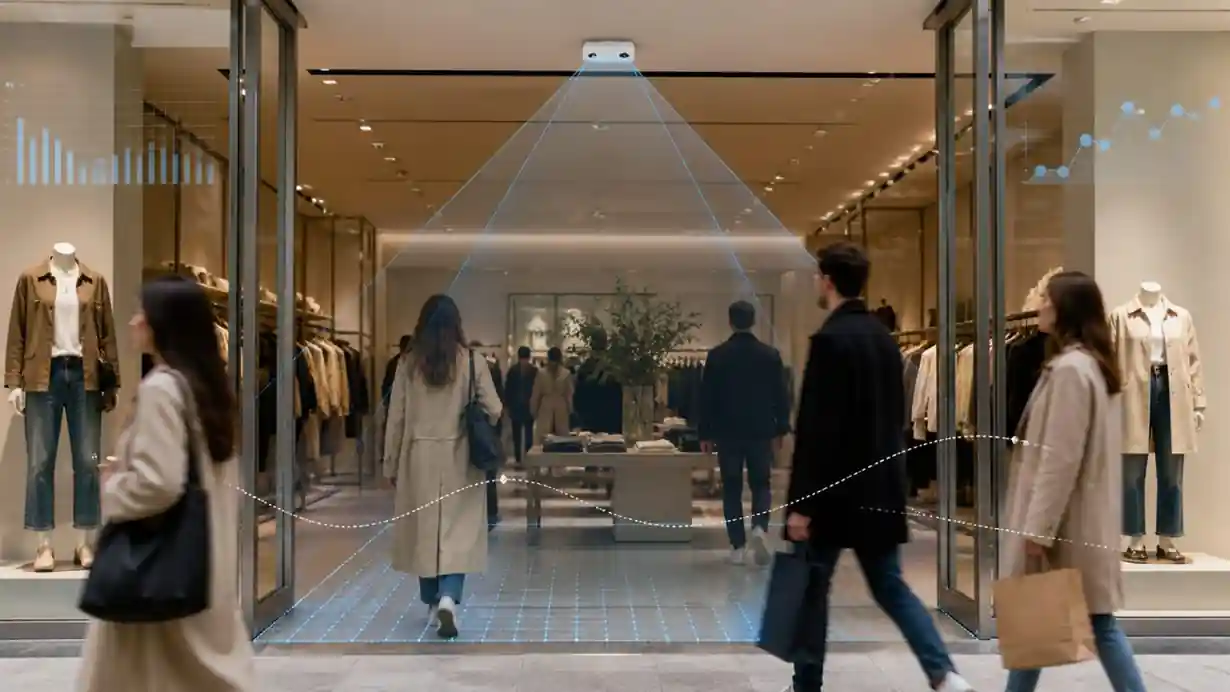
Storefront counting measures passing traffic outside a shop and the entries that follow. Capture rate is eligible store entries divided by eligible passing traffic, multiplied by 100. Measure both over the same frontage and trading period. V-Count combines sensor measurement with BoostBI reporting so retail teams can compare street opportunity with visits and test storefront changes.
This guide covers the core metrics, tools, sensor positions, counting rules and checks needed to make the comparison useful. Storefront performance starts before the door; purchase conversion measures what happens after entry.
Counting the people who do come in is the other half of the funnel: see our guide to choosing a store traffic counter for the entrance itself.
What Is Storefront Counting?
Storefront counting measures pedestrian passages across a defined area in front of your shop. A complete V-Count measurement plan can combine passing traffic, entry counts and configured window-interaction metrics with sales data. These measurements help locate changes in the street-to-store funnel; they do not reveal a person’s reason for walking past.
Keep the boundaries specific. A count at your own frontage answers a different question from a city-centre counter, a mall-wide total or a location estimate covering the surrounding district.
What Is Capture Rate?
Capture rate describes entry relative to the passing opportunity you measured. In a V-Count deployment, agree the qualifying passage and entry rules before comparing BoostBI reports.
Capture rate = eligible entries through the measured frontage ÷ eligible passing traffic at that frontage × 100.
Example: 1,325 eligible passages and 246 eligible entries during the same day give 246 ÷ 1,325 × 100 = 18.6% capture rate.
Two shops with the same entry count may face very different passing volumes. Capture rate adds that context, but comparisons still need similar formats, frontage coverage, opening hours and counting rules. A quiet destination store and a busy commuter location should not automatically share a benchmark.

How many passers-by does your window turn into visitors?
Count people passing and people entering, then test windows, displays and offers against real numbers.
- Capture rate
- Passers-by vs. entries
- Test your displays
The Storefront Funnel: Four Metrics That Matter
- Passing traffic: eligible passages through the agreed frontage area, including approaches that become entries.
- Window interaction: stops or dwell within a configured window zone. Define the minimum stop duration. Use “attention” or “gaze” only where the chosen configuration measures and validates that specific output.
- Entries and capture: qualifying inward crossings through the entrance or entrances associated with that frontage.
- Purchase conversion: qualifying POS purchases divided by eligible store visits for the same period.
Capture is not purchase conversion. If the 246 eligible entries also represent the store’s eligible visits and produce 49 qualifying purchases, purchase conversion is 49 ÷ 246 × 100 = 19.9%. The 18.6% capture rate still describes street-to-entry performance. Use the retail conversion measurement guide for transaction, refund and visit rules.
People can enter without stopping at the window. Aggregate stage totals are therefore not proof that the same identifiable people completed every stage.
Storefront Analytics Methods and Tools Compared
For physical storefronts, start with the measurement source and the area it covers. V-Count Nano sensors with BoostBI address physical visitor analytics; website analytics measure a different environment.
| Method or tool | Useful output | What to check |
|---|---|---|
| Manual observation and clickers | Reference counts of passages, stops and entries during sampled periods. | Use trained observers, separate tallies and synchronised intervals. Include busy and quiet periods; a short sample is not a full trading week. |
| V-Count Nano sensors + BoostBI | Measured passing and entrance traffic with capture reporting; configured additional metrics where supported. | Approve the sightlines, model, counting zones and selected sublicences. Use Nano Outdoor for an exposed exterior installation when suitable for the site. |
| Analytics on an existing camera system | Line-crossing or zone counts where the camera and software support them. | Verify camera angle, resolution, occlusion, processing, retention and permissions. A security camera alone does not provide a validated capture rate. |
| Wi-Fi, Bluetooth or mobility estimates | Estimated visitation or traffic trends from sampled device signals. | Understand sampling, device-to-person assumptions and spatial boundaries. An estimated district audience is not interchangeable with counted frontage passages. |
| Municipal counters or landlord reports | Context for location research and broader pedestrian trends. | Request the original source, dates, hours, method and exact counter location before comparing with your entrance data. |
| POS, BI and ecommerce analytics | Purchase records, joined business reports or online sessions and events. | POS supplies purchases, not passersby. BI depends on its inputs. Website sessions and digital heatmaps cannot replace physical traffic measurement. |

How Storefront Counting Technology Works
V-Count Nano AI supports people counting and street-traffic measurement. Configured counting boundaries separate the passing stream from inward and outward entrance movements. For exposed outdoor positions, assess Nano Outdoor against the actual environment. Choose the installation from a coverage plan, rather than assuming one device can see every pavement and doorway.
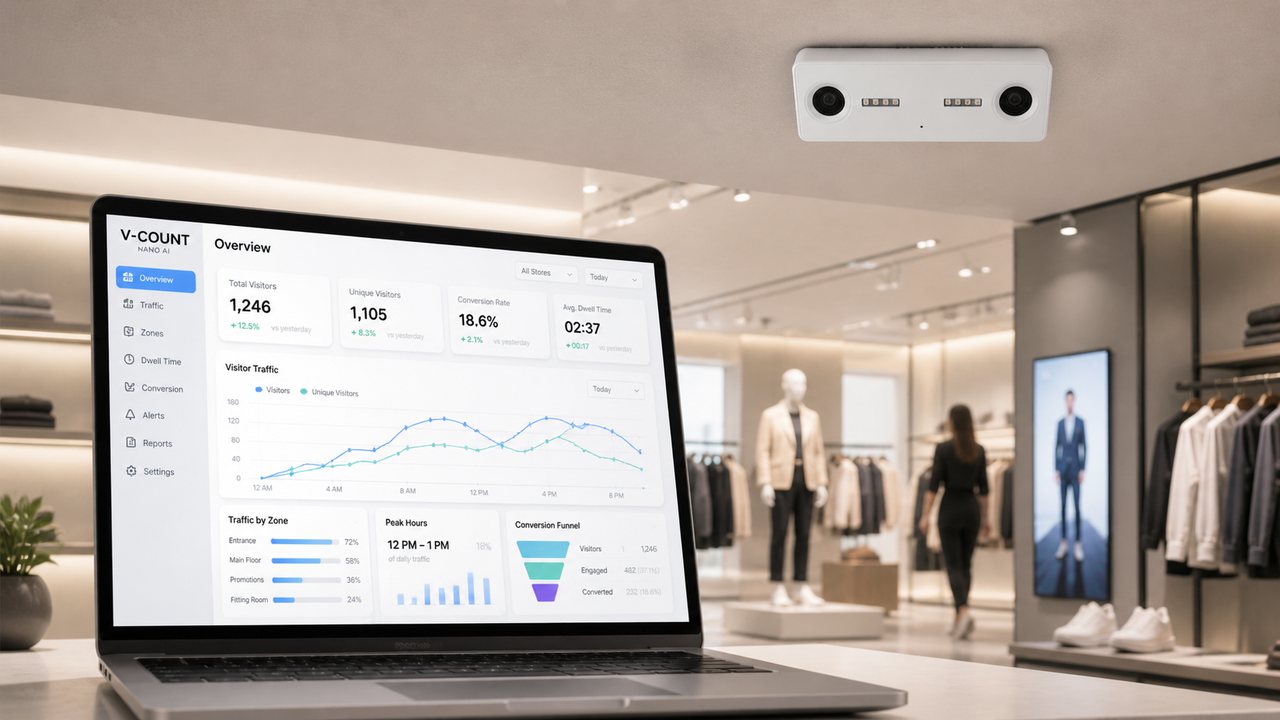
BoostBI brings the resulting visitor metrics into reports. Confirm which capture, window-interaction, demographic and POS functions are enabled for the selected model, placement and subscription. Optional metrics can have different viewing and validation requirements from a simple passage count.
What does it cost?
Sensors from US$299, paid once. BoostBI from US$9 per sensor per month.
Required Sensor Positions and Coverage
| Measurement position | Required coverage | Installation check |
|---|---|---|
| Frontage / passing zone | The agreed pedestrian approach paths and frontage area, including people who turn into the store. | Keep the view clear of signs, trees and temporary displays. Exclude roads, neighbouring entrances and the opposite pavement unless they are explicitly part of the study. |
| Entrance threshold | The full usable entrance width, with inward and outward movements separated. | Check swinging doors, recessed entrances, people walking abreast and groups. Cover every included entrance; do not add back-door entries to a front-window denominator. |
| Window interaction zone, if required | The defined stopping or viewing area near the display. | Keep queues and café seating separate where possible. Validate the stop threshold and any impression output; confirm whether an additional view or sensor is needed. |
Record mounting height, angle, covered width and the counting boundaries on a site plan. Nano AI’s supported mounting range is 2.2–7 m; that range alone does not establish coverage or the operating range of every optional metric. Validate the actual configuration before treating its two counts as a capture-rate pair.
Numerator and Denominator Rules
- Use the same place and time. Pair entries at the measured frontage with its passing traffic during identical open-store intervals, using one time zone. Exclude closed hours from both when reporting trading-hours capture.
- Include the opportunity to enter. Position the passing zone so approaches that turn into the shop are included. A line that counts only people who walk beyond the door would leave entrants out of the denominator.
- Choose a consistent unit. Count individuals on both sides of the ratio, or explicitly use groups on both. Do not divide individual entries by passing groups.
- Document repeat and exclusion rules. Agree how return passages, re-entry, children, staff, deliveries and outward movements are treated. Passage counts are not automatically unique people. Do not count both edges of one traversal as two opportunities.
- Match data availability. If either feed is missing, flag the interval and exclude the same interval from both totals. A missing denominator is not zero traffic; a zero denominator has no defined capture rate.
- Aggregate the counts first. For a week, divide total eligible entries by total eligible passing traffic. Do not average daily percentages with different traffic volumes.
An unexpectedly high ratio should trigger a boundary and timing check before a performance conclusion. Aggregate capture is an operational comparison, not proof that a particular passerby later purchased.

Daylight and Traffic Validation
V-Count’s official people-counting specification is up to 99% accuracy. Establish how the selected installation performs against an agreed reference; the headline specification is not a guarantee for every frontage, traffic pattern or optional analytic.
- Check changing light. Sample morning and afternoon sun, shade, reflections from glass, dusk and the store’s lowest operating light level. Validate through-glass placement specifically if proposed.
- Check traffic conditions. Include quiet intervals, peaks, simultaneous entry and exit, groups, children, prams and temporary obstructions. For exposed sites, include representative weather conditions.
- Use matching reference counts. Observe the same virtual boundaries and exclusions for the same timestamps. Tally the passing stream and inward entry stream separately.
- Report errors separately. Retain sensor and reference totals, signed differences and absolute error for each stream and condition. Opposing errors must not cancel out. For a non-zero reference, absolute percentage count error is |sensor count − reference count| ÷ reference count × 100.
- Agree acceptance before testing. Record the model, configuration, sample periods and acceptable error. Recheck after changes to mounting, doors, displays, lighting or counting zones.
Also test missing-data alerts and timestamp alignment. A reliable counter paired with an incomplete feed can still produce a misleading ratio.

Turn foot traffic into sales
BoostBI joins visitor counts with your sales to show conversion rate, busy hours and staffing gaps.
- Conversion rate
- Staffing by hour
- AI Sales Coach
5 Places Storefront Counting Pays Off
1. High-Street Stores: Test the Window
Compare window concepts, signage, lighting or promotion messages using capture rate and qualifying purchases. Keep a record of what changed; decide whether to repeat or expand a concept from observed results.
2. Multi-Store Chains: Compare Similar Locations
Capture rate gives entry counts the context of passing opportunity. Compare stores with similar formats and catchments, and inspect traffic volume, sales and reporting completeness alongside the ratio.
3. Pop-Up Stores: Treat the Site as a Test
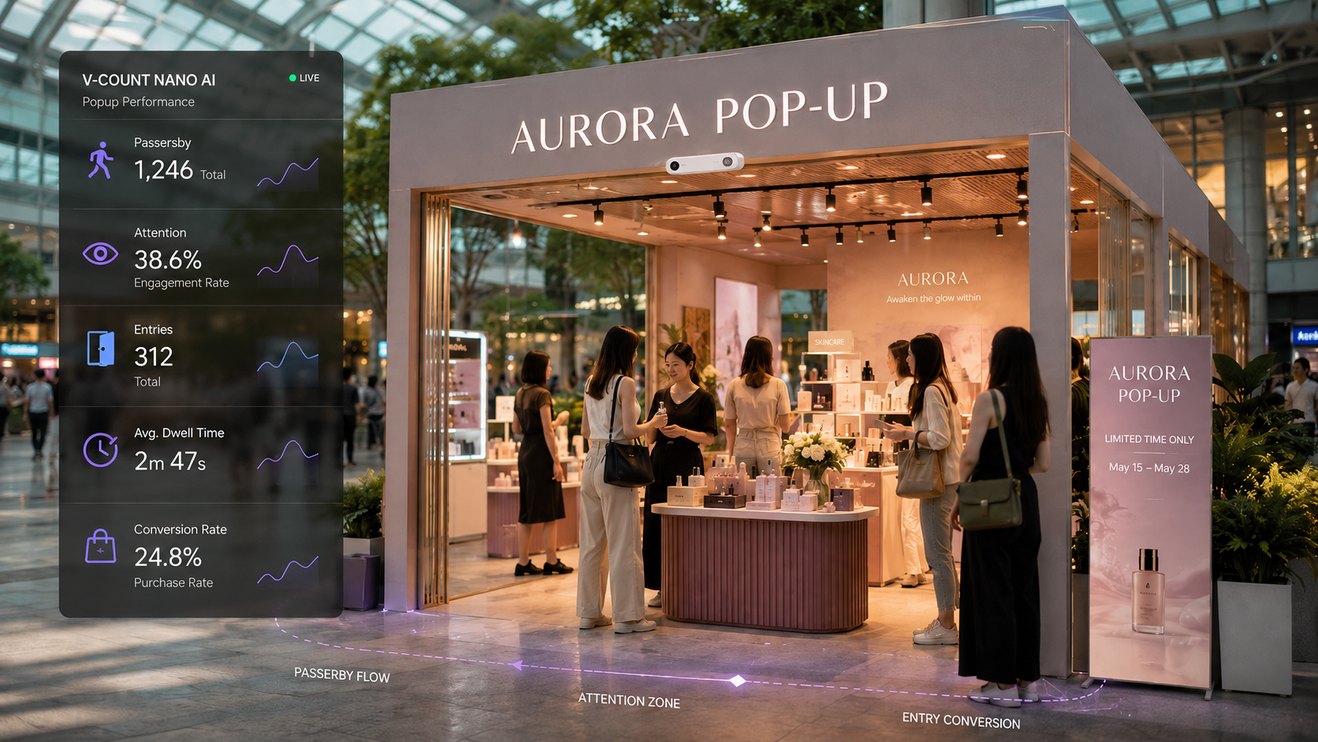
Measure the actual frontage, the operating period and entries. A short campaign can inform a scale, repeat or move decision, but seasonal and event traffic may not represent a permanent store.
4. Mall Stores and Activations: Measure the Relevant Corridor
Use the corridor stream serving the unit. Separate shoppers approaching the store from queues, seating areas and traffic associated with a nearby activation.
5. Rent and Leasing Decisions: Bring Comparable Evidence
Ask where, when and how supplied footfall was measured. Your own frontage observations can add useful context, but rent decisions also depend on trading economics, lease terms and location suitability.
How to Run Your First Storefront Test: 5 Steps
- Record a baseline. Collect validated passing traffic, entries and qualifying purchases. Two to four weeks can be a practical planning window, but duration should follow traffic volume, variability and the change you need to detect.
- Specify one intervention. Photograph and date the display, sign or lighting change. Keep the counting configuration fixed and log stock, pricing, staffing and concurrent promotions.
- Plan a fair comparison. Compare equivalent weekdays and trading hours. Where practical, alternate variants across comparable periods or use a suitable control store. Log weather, local events and closures; a simple before/after difference does not isolate cause.
- Read the whole result. Report raw counts, capture, purchase conversion and sales separately. State percentage-point and relative changes clearly. More stops alone do not demonstrate more purchases.
- Choose the next action. Repeat promising results at representative stores before a wider rollout. Keep inconclusive tests marked inconclusive instead of declaring a winner from a small difference.
Keep one auditable test record: store/frontage ID; dates and hours; variant photographs; sensor model and boundary plan; validation counts; exclusion rules; data gaps; traffic and entry totals; qualifying POS purchases; context changes; calculations; and the decision owner.
A Documented Entrance Test: More Stops Did Not Guarantee More Purchases
A January 2026 research preprint by Song and colleagues reports a 12-day experiment at a Japanese bedding store. The team alternated normal operation, a robot at the entrance, and the robot with a display fixture, with four days per condition. Researchers used video annotation and observation logs.
Reported stopping rates rose from 0.73% to 1.50% and 2.48%, but purchases per passerby did not differ significantly. The paper reports entry among people who stopped, so its entry percentage is not the all-passerby capture rate defined above.
This was a single-store research deployment, not a V-Count customer result or an uplift benchmark. Its useful lesson is to document the setup and denominator at every stage, then check whether additional attention progresses to entry and purchase.
Not sure where the sensors go?
Send a floor plan and a few photos taken by your store manager. We recommend sensor placement within 24 hours.
Stack It: Storefront + Door + In-Store Analytics
V-Count storefront measurement describes passing opportunity and entry. Entrance counting with configured staff exclusion supports eligible-visit reporting. Nano Prime zone analytics adds movement and dwell within covered store areas, while POS supplies purchase records. Confirm coverage and the selected BoostBI sublicences for each part of the plan.
These layers help teams choose what to investigate. They do not guarantee a fixed revenue increase or establish why an individual shopper acted. Start with the measurement needed for your next decision.
What Does Storefront Counting Cost?
For V-Count, price the actual sensor quantity, installation, BoostBI subscription with selected sublicences, and any integration work. A frontage and several entrances may need a different configuration from one sheltered doorway. Use the current pricing page and request a scope that identifies the included metrics, billing term, support and deployment work.
Accuracy, Processing and Deployment Responsibilities
V-Count describes on-device processing for Nano people counting and non-identifying analytics outputs. The operator should review site permissions, applicable notice requirements and processing responsibilities before deployment. A product description alone does not determine whether a particular installation meets local requirements.
Why Do People Walk Past My Shop Without Coming In?
V-Count measurements can show whether passing volume, measured stops or capture changed. Low capture might prompt a test of visibility, the offer, access or opening hours, but counts do not identify the cause. Combine observed patterns with staff feedback, customer research and a controlled change before drawing that conclusion.
How Do I Know How Many People Walk Past My Shop?
Start with timed manual observations of a clearly defined frontage, covering different days and busy periods. A V-Count installation can then provide continuous reporting over its validated coverage. Use the manual reference to check the configured counter, and keep unobserved periods clearly separate from measured totals.
How Do I Check Foot Traffic Before Renting a Shop?
Request dated, location-specific source data and compare it with observations at the proposed frontage. With the necessary site permissions, V-Count can help scope a temporary measurement plan. Include weekdays, weekends and relevant trading hours, and record seasonality and nearby events. A short sample should not be presented as a year-round forecast.
Do Window Displays Actually Increase Sales?
A display may affect passing-to-entry capture, purchase conversion or basket value. Use V-Count traffic measurement alongside qualifying POS transactions and sales to test those outcomes separately. More entries are not required for every possible sales improvement, and more entries alone do not prove one. Keep any reported uplift tied to the store, dates, comparison and metric that produced it.
Storefront Metrics Glossary
Passing traffic: eligible passage events in the defined frontage area. Stop rate: qualifying stops divided by eligible passages. Dwell time: time spent within a defined zone. Capture rate: eligible frontage entries divided by its eligible passing traffic. Purchase conversion: qualifying purchases divided by eligible store visits. Multiply ratios by 100 for percentages. Longer dwell describes time in the zone; it does not by itself demonstrate interest or intent.
Frequently Asked Questions
What are the latest tools used for storefront analytics?
For physical shops, current options include dedicated people-counting sensors, analytics on compatible cameras, manual reference counts and location or device-based estimates. V-Count Nano AI or Nano Outdoor, selected for the installation, provides physical traffic measurement with BoostBI reporting. Compare coverage, counting rules, validation and enabled metrics. Ecommerce analytics and website heatmaps answer online-store questions rather than measuring pavement traffic.
What tools can help me analyze the performance of my target storefronts?
For physical locations, use V-Count passing and entry counts to assess capture, POS data for purchase outcomes, and manual checks to validate the installation. Use municipal or location-estimate data as additional context after checking its geographic coverage. Compare equivalent trading periods and store formats. For a digital storefront, use website or ecommerce analytics instead of substituting physical footfall measures.
Plan Your Storefront Measurement with V-Count
Share your frontage layout, entrance positions, operating hours and the decision you want to test. V-Count can scope sensor coverage, BoostBI reporting and a validation plan for your locations.
Request a demo