
The best retail opening hours are the hours that create worthwhile additional business. To find them, combine hourly customer counts with sales, contribution margin and the costs that change when you open longer. Then test a specific schedule change and compare the result across the whole day or week. Extra sales at 8 pm can look attractive while adding little if shoppers simply moved their purchases from 6 pm.
This guide shows how to identify promising hours, calculate a break-even threshold and decide whether to extend, shorten or shift your schedule. It includes four charts, a worked example and a practical trial framework.

Additional sales contribution − additional operating costs = the contribution from changing your hours.
Measure the change across comparable periods. Keep customer experience, staff practicality and existing trading obligations in the decision.
A busy extra hour is only part of the answer
Imagine two stores that both take £600 between 7 pm and 9 pm. At the first, most purchases are additional and the team can cover the period efficiently. At the second, many customers would have bought earlier, and the extension creates extra staffing and closing costs. The same sales figure can lead to different decisions.
The question is therefore bigger than “Did we sell anything?” Ask what would probably have happened without the extra hours. The same logic applies to closing earlier: a quiet hour may still serve valuable appointments, collections or customers who cannot visit at another time.
Start with one decision for one location or a comparable store group. A city-centre branch, a suburban store and a shopping-centre unit should not automatically inherit the same timetable.

Turn foot traffic into sales
BoostBI joins visitor counts with your sales to show conversion rate, busy hours and staffing gaps.
- Conversion rate
- Staffing by hour
- AI Sales Coach
Bring five inputs into one view
A people counter supplies the demand signal. Your POS and operating records supply the commercial context. Align them by location, local time and reporting period before comparing results.
| Input | What to record | Why it matters |
|---|---|---|
| Customer entries | Hourly entries using a consistent definition and staff filtering where configured. | Shows when people actually visit, including those who do not buy. |
| Transactions and sales | Hourly transaction counts and sales, with consistent treatment of returns and tax. | Separates visitor opportunity from realised sales. |
| Contribution margin | Sales less product cost and relevant variable selling costs. | Shows how much sales contribute towards the extra operating cost. |
| Incremental operating cost | Additional paid hours, employer costs, closing time, energy and any extra security. | Captures costs caused by the schedule change. |
| Trading context | Promotions, weather, events, appointments, stock availability and actual opening times. | Helps explain differences between the trial and its comparison period. |
Count definitions matter. Entry events are not necessarily unique people, and transactions are not always individual buyers. For operational conversion, divide the agreed transaction count by the matching customer-entry count and retain that definition throughout the trial.
Find the hours worth testing
Begin with an hourly demand profile. Look for traffic that builds near closing, a strong first hour after opening, or quiet periods that recur on the same weekdays. These patterns identify questions to investigate; they do not establish the best schedule by themselves.
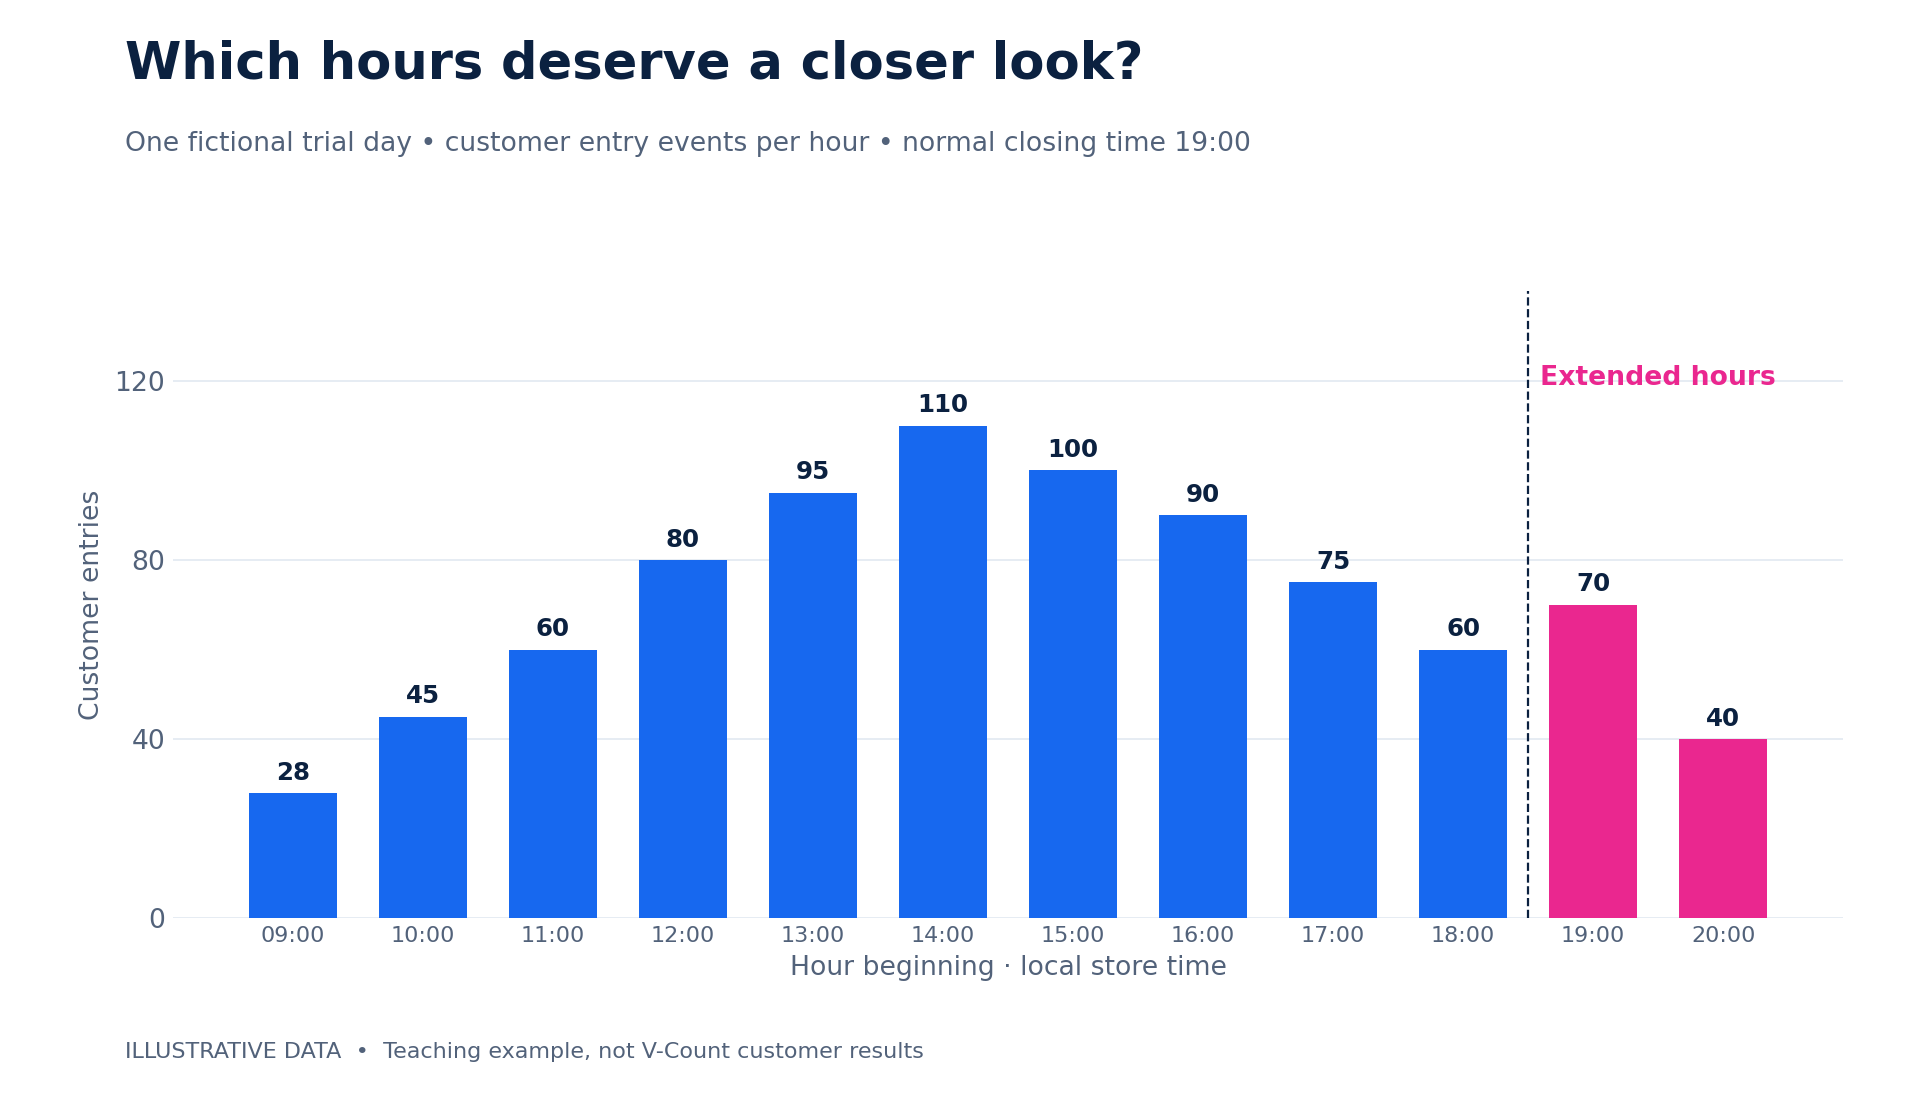
Examine service alongside traffic. If customers arrive but transactions remain weak, investigate product availability, staffing coverage and the shopping experience before assuming the hour is unprofitable. Conversely, a smaller number of purposeful visits can be commercially valuable.
What happens when the doors are closed?
An entrance counter inside a closed shop cannot tell you how many people wanted to enter. Suitable storefront traffic measurement can reveal passing pedestrian activity outside current trading hours. Treat it as opportunity, not a count of guaranteed customers or lost purchases.
Pair outside patterns with a controlled opening-hours trial or relevant customer feedback. Check the installation and outdoor conditions with the provider.

What does it cost?
Sensors from US$299, paid once. BoostBI from US$9 per sensor per month.
Calculate the sales the extra hours must earn
Use contribution margin rather than revenue alone. In this article, contribution margin means the share of sales left after product cost and other variable selling costs, before the additional operating cost of the trial.
Additional operating cost ÷ contribution margin
For a £180 extension cost and a 55% contribution margin, break-even additional sales are £180 ÷ 0.55 = £327.27. At a £50 average transaction value, that means at least seven additional transactions under these assumptions.
“Additional” is the critical word. Seven transactions during the extension are insufficient if some would have happened earlier. Average transaction value and margin can also change by hour, particularly during promotions. Use a representative product mix or actual item-level margins when available.
Include only costs that genuinely change. Existing rent usually does not increase because you trade for two extra hours. Wages may increase because of overtime, extra coverage or a later close-down, but an already-paid shift may require a different assessment. Include opportunity costs where keeping staff on the floor displaces necessary work. Avoid counting a variable cost twice.
Worked example: £600 in late sales, £40 in added contribution
A retailer tests opening from 7 pm to 9 pm. The extra period records 12 transactions at £50 each, or £600 in sales. Gross margin is 60%, and other variable selling costs 5%, leaving a 55% contribution margin.
Comparison of whole-day results suggests that £200 of those sales shifted from earlier hours. That leaves £400 of estimated additional sales.
| Calculation | Amount |
|---|---|
| Sales recorded during the two extra hours | £600 |
| Less estimated sales shifted from other hours | −£200 |
| Estimated additional sales | £400 |
| Additional contribution at 55% | £220 |
| Extra wages and employer costs | −£120 |
| Additional paid close-down time | −£30 |
| Additional energy and security | −£30 |
| Net incremental contribution from the session | +£40 |
Staffing is three colleagues working two extra paid hours at a loaded cost of £20 per hour. Close-down, energy and security costs are separate additions. Replace every input with the costs your proposed change would actually create.
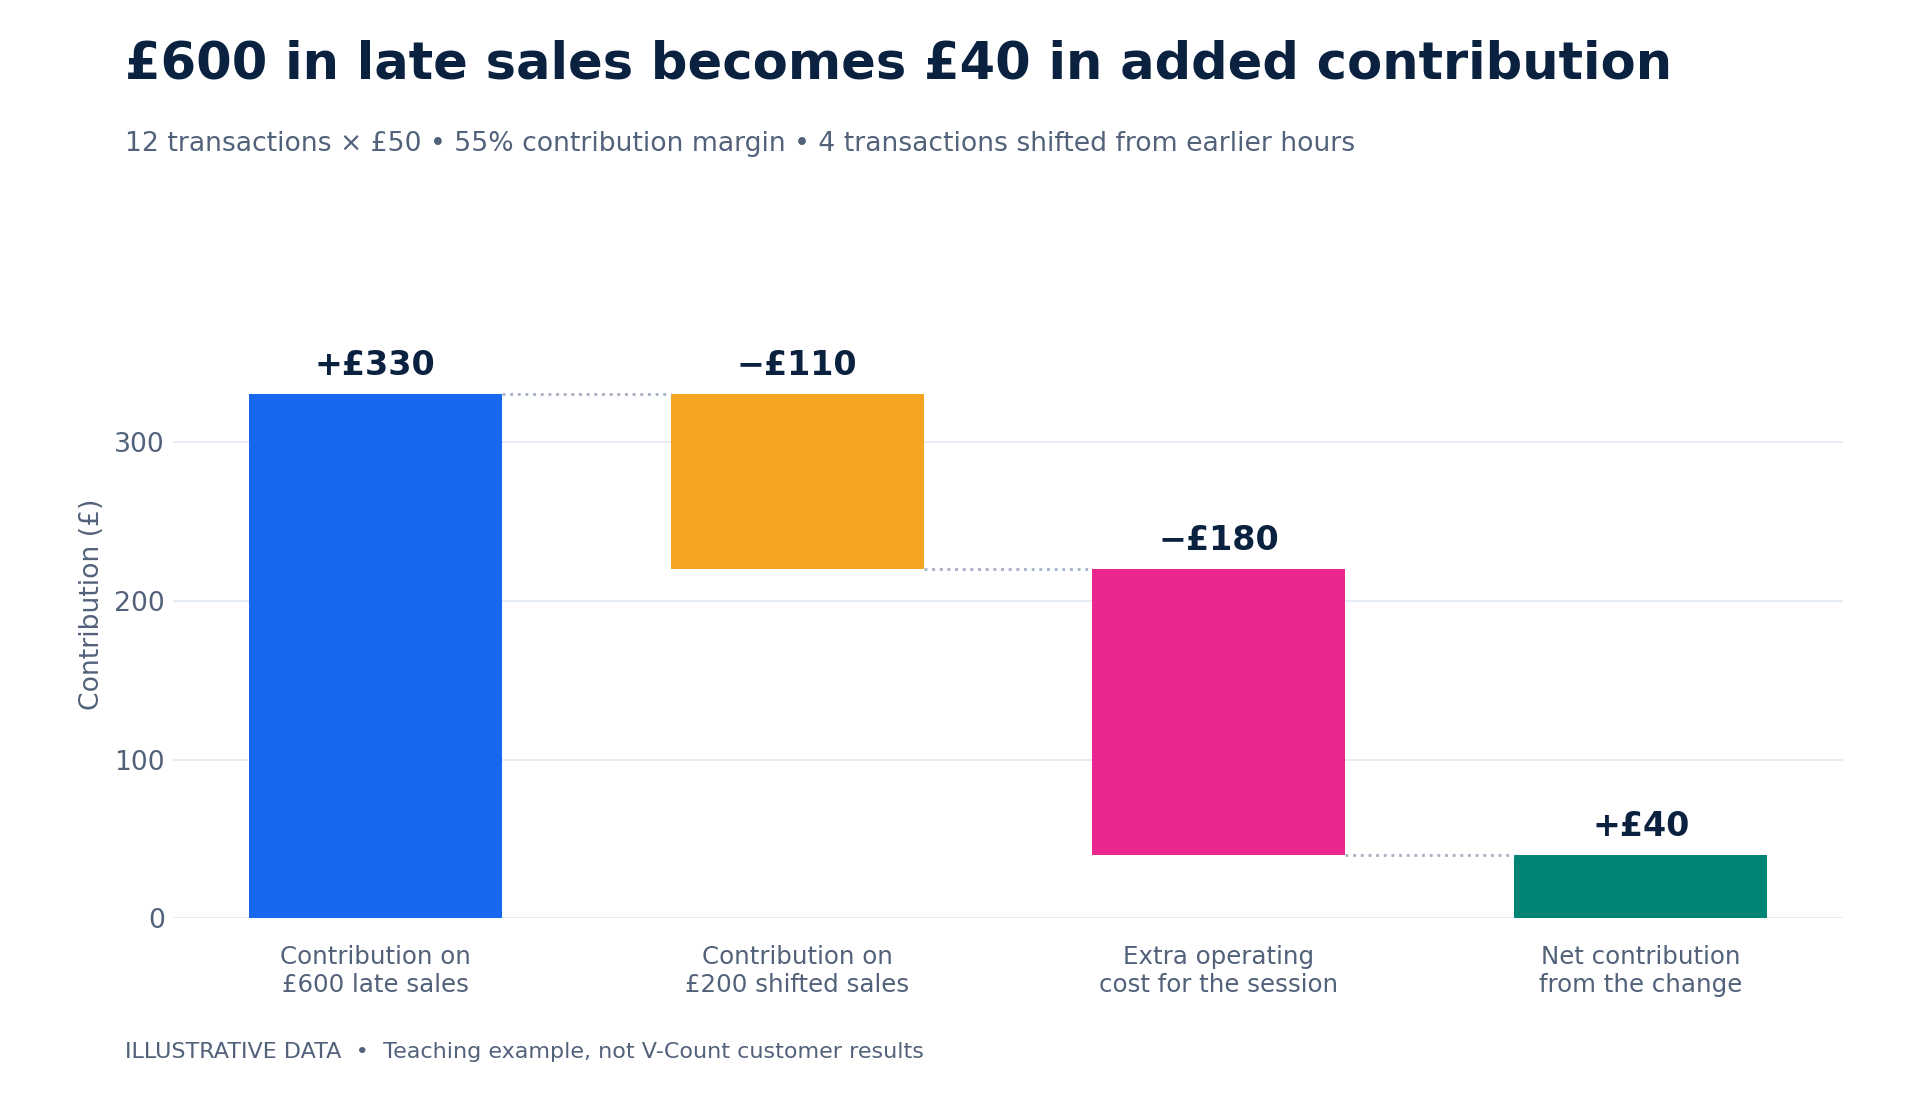
The £40 is contribution from the change, not the store’s total accounting profit. It does not prove that longer hours should become permanent. Check whether the result persists on comparable days and whether the team can deliver the service consistently.
Look for shifted purchases across the whole day
Review full-day and full-week sales and contribution, not just the new time slot. A rise in late sales accompanied by a fall in earlier sales may indicate displacement, but other factors can also explain it.
Where practical, compare a trial store with similar stores that retain their hours, accounting for their baseline differences. For a single store, compare equivalent weekdays across several weeks and record promotions, events and weather. Avoid changing prices, windows and staffing policy simultaneously if you want to isolate the opening-hours decision.
Test how easily the result could change
A single estimate can create false confidence. Calculate a conservative, central and optimistic case for additional transactions, margin and operating cost. A schedule that only works with unusually strong conversion deserves more evidence.
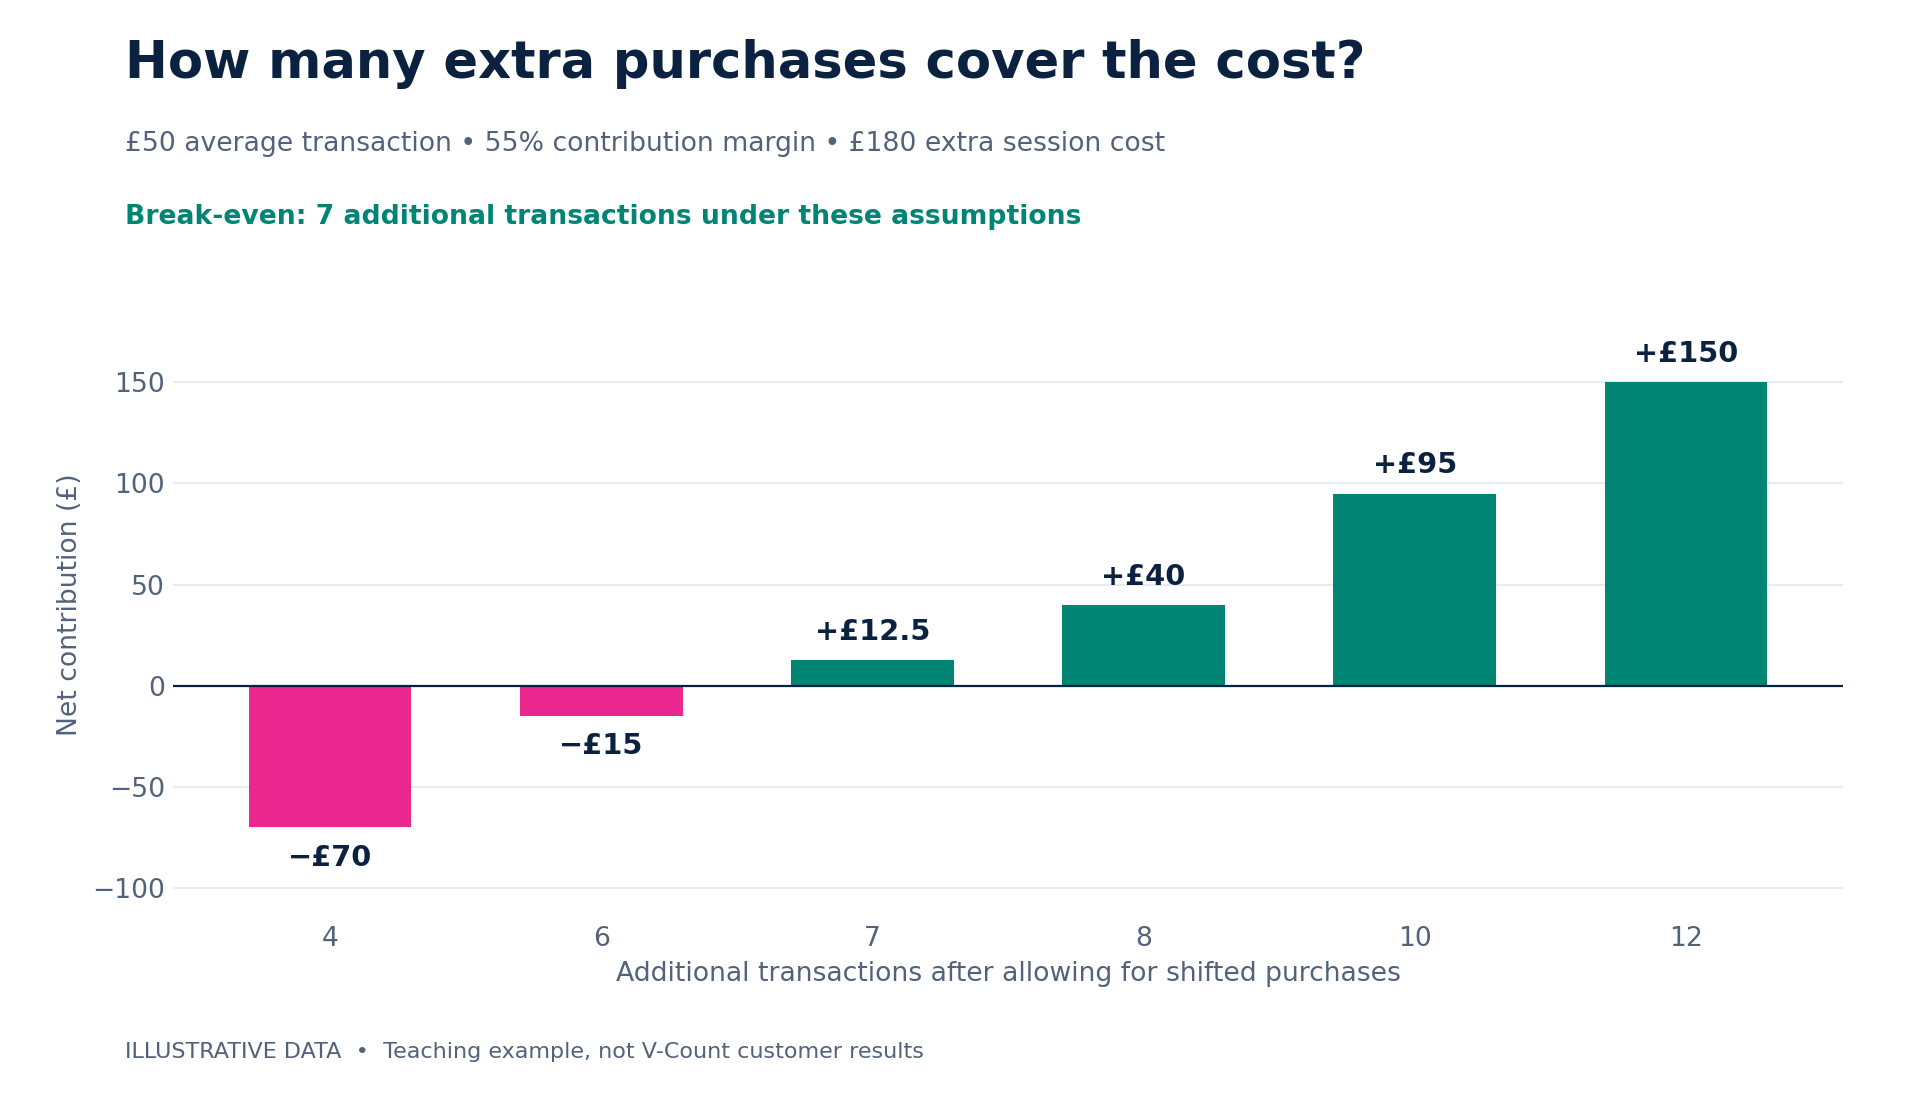
The arithmetic is only as good as the inputs. If the evening product mix has lower margin, the break-even threshold rises. If additional paid time is lower, it falls. Review transaction counts alongside sales value so a single large purchase does not drive the entire conclusion.
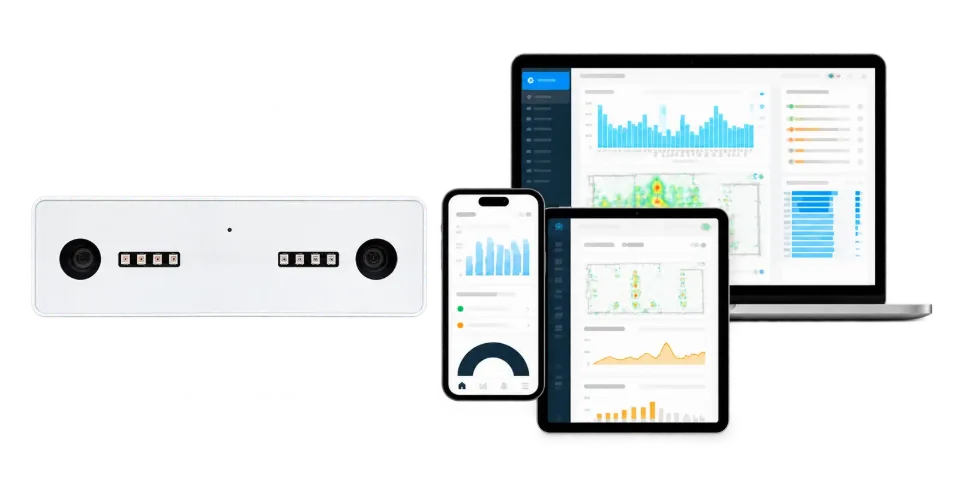
Count every visitor with up to 99% accuracy
Nano AI is a 3D people counting sensor. It counts entries and exits, can exclude staff and works in total darkness.
- Up to 99% accurate
- Staff exclusion
- Works at 0 lux
Choose hours by day and location
Build a weekday-by-hour view before choosing one schedule for the whole week. Compare Thursdays with Thursdays and weekends with comparable weekends. Mark unusual events and missing data instead of allowing them to define the normal pattern.
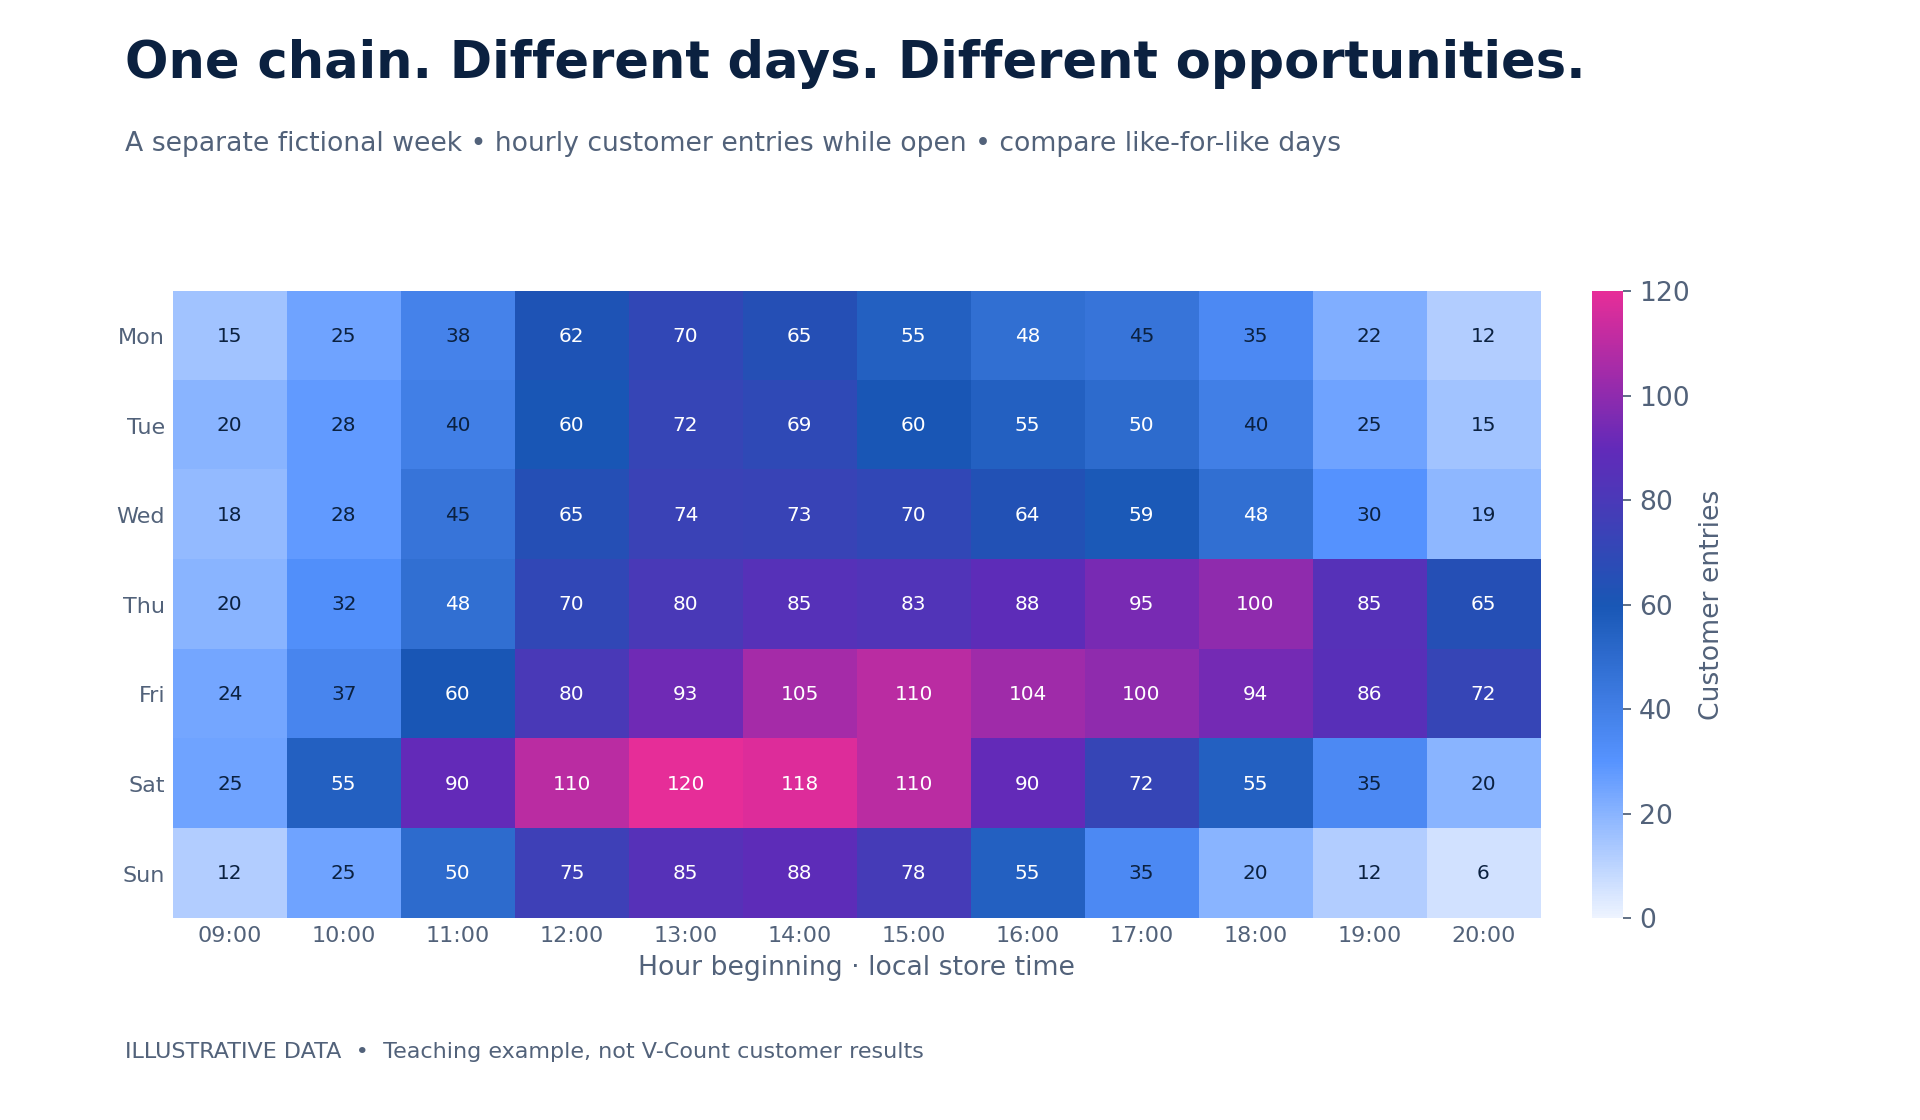
Evaluate store groups with similar formats, local demand and operating conditions. A chain may discover that selected late-trading days make sense in one group while shifting hours works better elsewhere. Use a stable published schedule that customers can understand, then reassess it when conditions materially change.
Run a focused opening-hours trial
A useful trial produces an operational decision, not just another dashboard. Assign an owner and write down the proposed change, comparison method, cost assumptions and criteria for keeping or reversing it.
- Establish the baseline. Validate counting coverage and collect several comparable weekdays. Align POS and visitor timestamps, record existing paid work before opening and after closing, and note unusual trading conditions.
- Change one part of the schedule. Test a limited extension, later opening or earlier close at suitable locations. Confirm staffing, access, safety and applicable trading obligations. Communicate the temporary hours consistently.
- Measure the complete effect. Record customer entries, transactions, sales, contribution and actual additional costs. Review the whole day or week, plus service, complaints, collections and the practical effect on colleagues.
- Review and decide. Compare equivalent periods and suitable controls. Continue if the commercial and service evidence supports it. Refine or reverse if it does not; extend the measurement period if results are too variable.
For a practical starting point, you might plan two to four weeks of baseline collection followed by a similar trial period. This is planning guidance, not a statistically sufficient sample for every store. Low traffic, promotions and irregular demand can require longer. Look for a repeatable result and report uncertainty.

Four useful outcomes from the evidence
Extend selected hours
Additional demand produces worthwhile contribution, and service remains practical. Keep the extension only for the days and locations supported by the evidence.
Shorten carefully
Quiet periods contribute little and costs are genuinely avoidable. Test the change while checking customer access, collections and sales across other hours.
Shift the schedule
Demand is stronger at a different time. Test moving hours rather than simply adding them, accounting for any differences in cost and customer behaviour.
Keep and improve
The current schedule works, or evidence is inconclusive. Improve service within existing hours or collect more representative data before changing them.
Not sure where the sensors go?
Send a floor plan and a few photos taken by your store manager. We recommend sensor placement within 24 hours.
How V-Count supports the decision
Nano AI people counting provides the entry and exit data that starts the analysis. With the appropriate configuration, staff exclusion helps keep customer traffic separate from employee movements. Cover the relevant entrances and validate the installed setup before relying on comparisons.
BoostBI visitor analytics brings hourly traffic and location comparisons into the operating review, with reporting and integration options for business data. Combine these measurements with POS sales and your own cost and margin inputs to build the opening-hours evaluation.
Where the question extends beyond the doorway, discuss Nano Outdoor and suitable external coverage. The storefront counting guide explains the distinction between passing traffic and the share entering a store.
The result is a clearer basis for deciding when to trade, where to test and how to judge the outcome. It is a decision process supported by visitor data, not a promise that a sensor alone calculates profit or makes every extra hour worthwhile.
Frequently asked questions
What are the best opening hours for a retail store?
There is no universal timetable. Compare customer demand, additional contribution, operating costs and service needs by location and weekday. Test changes against comparable periods before committing to a permanent schedule. V-Count BoostBI shows hourly demand next to sales to guide the decision.
Can I make this decision using sales data alone?
Sales show completed purchases. Customer counts add the visitor opportunity behind them, helping distinguish low demand from weak conversion. Neither tells you the full cost of opening longer, so include operating and margin data. V-Count Nano AI adds the visitor count and BoostBI puts it next to sales.
How do I calculate whether an extra hour is profitable?
Estimate genuinely additional sales, multiply by contribution margin and subtract the costs created by that hour. Check the whole-day or whole-week effect. This estimates incremental contribution; full accounting profit includes other costs. V-Count BoostBI provides the hourly traffic and sales inputs for this calculation.
How can I measure demand while the store is closed?
Appropriate external counting can show passing traffic. It does not establish purchase intent. Combine it with a limited hours trial, relevant feedback and site context to test whether the opportunity becomes additional business. V-Count storefront analytics measures passing traffic outside the store.
Will shorter hours automatically reduce labour costs?
No. Savings depend on whether paid hours or other expenses actually fall. The team may still need time for deliveries, replenishment or closing tasks. Measure the real cost change and the effect on service. V-Count BoostBI shows hourly traffic, so you can test whether an hour is worth staffing.
Should every store in a chain use the same schedule?
A consistent customer experience matters, but demand can differ by format and location. Use comparable store groups, test exceptions and make approved opening hours easy for customers to find.
Find the hours that work for your stores.
Bring your current schedule and the locations you want to evaluate. See how V-Count can help you measure customer demand and build a stronger opening-hours decision.
Request a demoThey are not measured V-Count customer outcomes.