
Foot Traffic Counter for Retail:
Sensors, Accuracy and Cost
A foot traffic counter is a sensor mounted at an entrance that measures how many people walk in and out of a shop, and turns that movement into footfall data you can act on. This guide covers the sensor types, how to choose one for your entrance, and how the pricing is normally structured.
A foot traffic counter is a sensor mounted at an entrance that measures how many people walk in and out of a physical space, and turns that movement into footfall data you can act on. In a shop, the foot traffic counter counts every visitor in both directions, timestamps each count, and sends the totals to an analytics platform where they become hourly, daily and weekly reports. Without one, a store knows what it sold but not how many people it had the chance to sell to. It is the same device class a retailer would call a people counter, described here in footfall terms.
This page is a buyer’s guide to retail traffic counters: what they measure, how the main sensor technologies differ, how to choose the right one for your entrance, how installation and data flow work, and how the pricing is normally structured. V-Count builds three sensor families for this job — Nano AI (AI camera), Nano Prime (3D stereo vision) and Nano Outdoor — all feeding the BoostBI analytics platform. If you want the wider category first, start with our people counting hub.


What a foot traffic counter is and what it measures
Modern footfall counting systems are not simple tally machines. A single retail people counter at the door produces several distinct metrics, and each one answers a different commercial question.
Entries and exits
The base measurement is directional: how many people crossed the counting line inward, and how many crossed it outward. Directional counting matters because entries alone tell you demand, while the pair of entries and exits lets the system validate itself — over a full trading day the two figures should converge. Directional counting is also what makes a store traffic counter usable at a door that serves as both entrance and exit, which is the norm in high-street retail.
Live occupancy
Entries minus exits, calculated continuously, gives live occupancy: how many people are inside right now. Occupancy drives capacity management, safety compliance, and practical decisions such as when to open a second till. V-Count’s VCare module turns the same sensor feed into a real-time occupancy display.
Capture rate
If you add a second sensor that measures passers-by in front of the window, the system can calculate capture rate: the share of people walking past who actually come in. Capture rate separates a location problem from a storefront problem. We cover the method in depth in our storefront counting and capture rate guide.
Conversion rate
Conversion is transactions divided by visitors. It is the reason most retailers buy a counter in the first place: it converts footfall data into a performance metric that is comparable between stores, staff shifts and weeks. It requires the counter to be joined to POS data, which is covered below.
Peaks, patterns and staffing hours
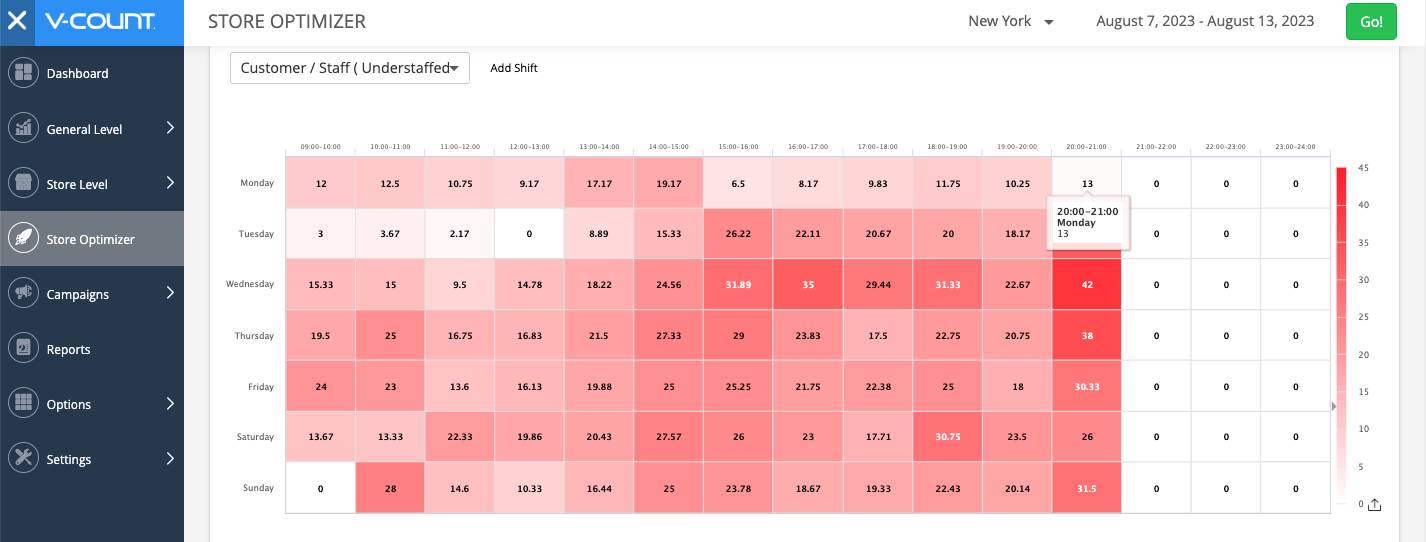
Because every count is timestamped, footfall analytics reveal the shape of the day and the week: the 11:00 build-up, the lunchtime spike, the dead Tuesday afternoon. That shape is what staff rosters should follow, and it is invisible in sales data alone.
For a deeper treatment of what to do with these numbers once you have them, see our retail people counting and foot traffic analytics guide and our article on customer counting and analysing retail store traffic.
If your market uses British English, the same technology is sold as footfall counting — see our guide to footfall counting, footfall counters and footfall data for the UK and European view of the same measurement.
Types of retail traffic counters compared
“Which technology?” is the first real decision. The sensor types below all count people, but they differ in what they can see, where they can be mounted and what else they can measure. The table is the short version; the notes after it explain the trade-offs that matter when you are shortlisting the best retail traffic counters for your estate.
| Counter type | How it works | Best for | Limitations |
|---|---|---|---|
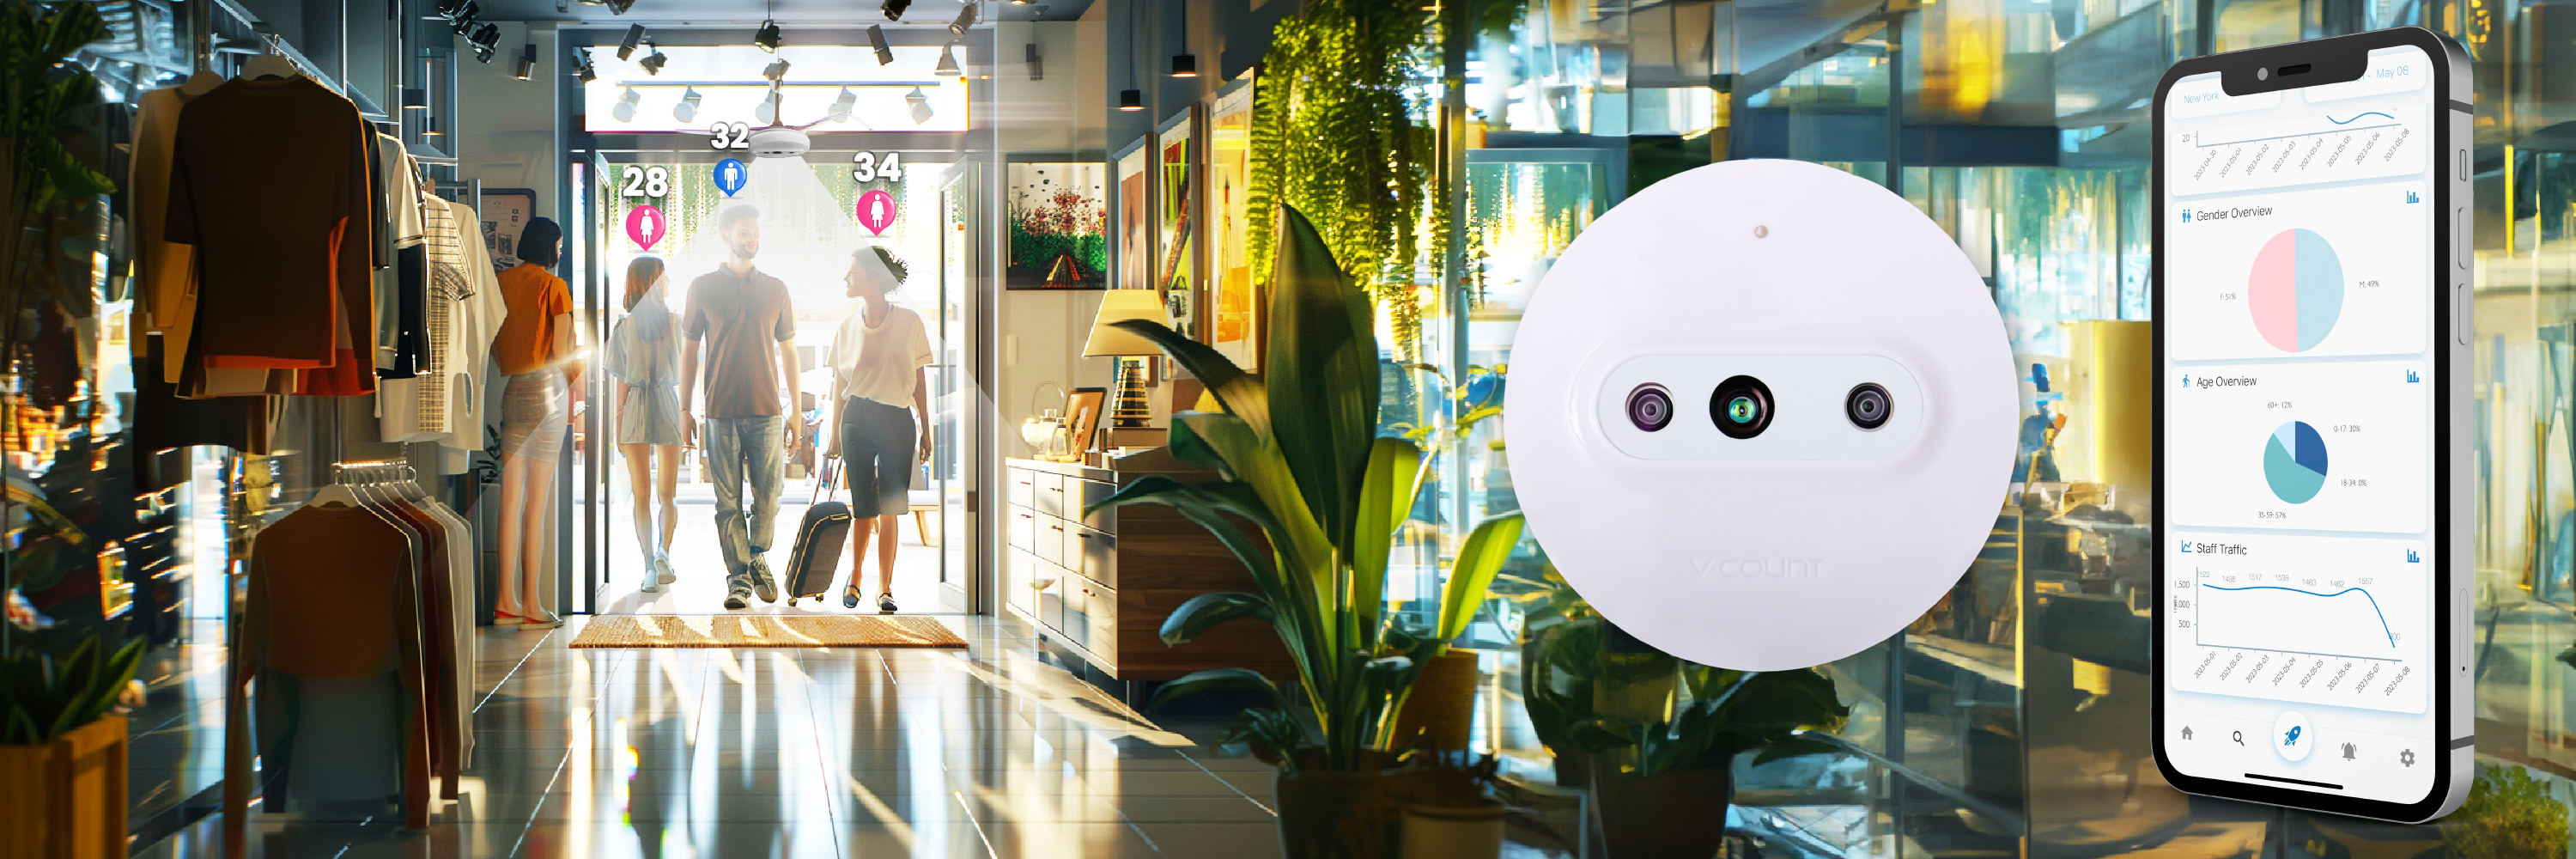
| AI camera counter (V-Count Nano AI) | An overhead camera with an on-board AI model detects and tracks people as individuals across the counting line. | Stores that want more than a number: staff exclusion, group and child detection, zone analytics and demographic insight from one device. | Needs a power and network path to the ceiling; requires a considered privacy position because it is a camera-based device, even when no images are stored. |
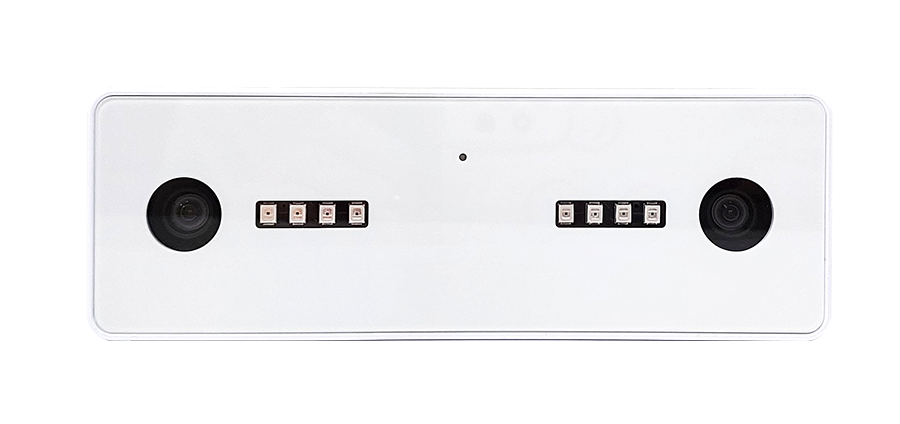
| 3D stereo vision counter (V-Count Nano Prime) | Two lenses build a depth map of the doorway, so people are separated by height and shape rather than by appearance. | Wide or busy entrances, shopping-centre doors, and anywhere with strong or changing daylight; the classic high-accuracy retail door counter. | Mounting height and lens spacing define the coverage width, so very wide openings may need more than one unit. |
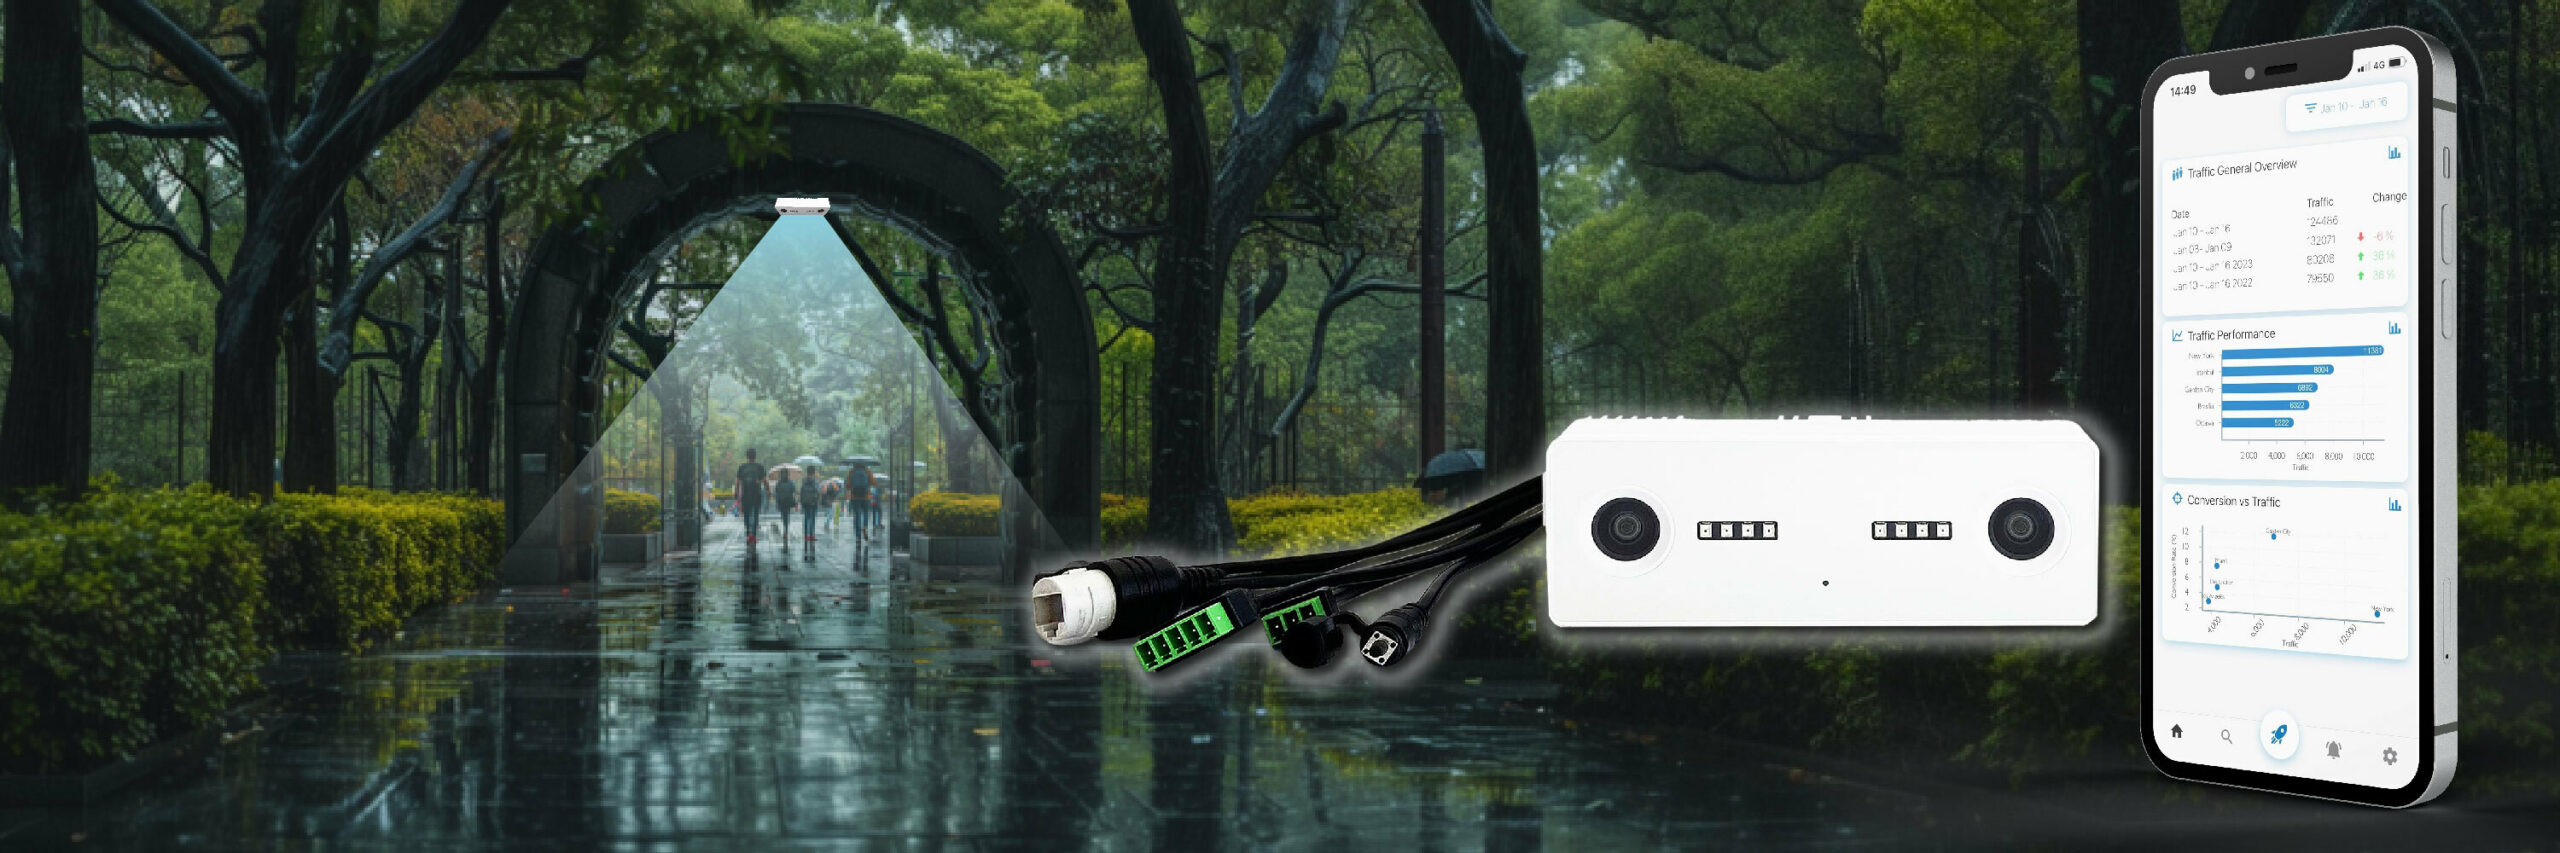
| Outdoor counter (V-Count Nano Outdoor) | A weather-sealed sensor designed to count in open air: storefront pavements, mall corridors, entrances without a ceiling. | Pavement traffic for capture rate, outlet parks, seasonal and pop-up locations, campus and event entrances. | Needs a suitable mounting structure and an outdoor power feed; open areas have no fixed doorway to constrain the counting line, so placement has to be planned. |
| Thermal counter | Detects body heat signatures crossing the line rather than visible shapes. | Very dark environments, and sites where the buyer wants an explicitly image-free sensor. | Low resolution by nature: limited ability to separate people standing close together, and no zone, staff-exclusion or demographic layer. Heat sources near the door can interfere. |
| Break-beam / infrared door counter | An infrared beam across the doorway counts each interruption of the beam. | The cheapest possible entry point: a single narrow door, a stockroom, a back entrance that just needs a rough tally. | Cannot tell direction reliably, counts two people side by side as one, and counts a trolley or a delivery as a visitor. Not a basis for conversion reporting. |
| WiFi / Bluetooth tracking | Listens for probe requests from phones and estimates visitor numbers from device counts. | Very rough trend data over large open areas where no sensor can be mounted. | Only counts people who carry a discoverable device with the radio on; modern phones randomise their addresses, so the sample is unstable. Not suitable as a primary traffic counter sensor for a store. |
Two practical notes. First, the break-beam door counters retail chains installed decades ago still exist in plenty of small shops, and they are usually the reason a manager distrusts their own footfall counting data — the technology cannot support the conclusions people draw from it. Second, “AI camera” and “3D stereo” are not competing generations: Nano AI is chosen when you want behavioural and demographic depth, Nano Prime when you want the most robust possible line count in a difficult doorway. Our overview of the best technologies to analyse foot traffic in retail stores puts these products in the context of the wider V-Count stack.
Not sure which counter fits your entrance?
Send us your door width, ceiling height and lighting, and we will tell you which V-Count sensor the entrance needs — and which one it does not.
How to choose the best retail traffic counter for your store
Technology choice follows the building, not the brochure. Walk the entrance with this checklist before you request a quote.
Door width and entrance layout
Measure the clear opening. A single 900 mm door is comfortable for any sensor; a 4 m sliding front or an open mall frontage is not. Coverage width scales with mounting height, so a wide opening either needs a taller mount or a second unit with the counting lines stitched together. Revolving doors, airlocks and lobbies add a second decision: do you count at the outer door, the inner door, or both.
Ceiling height and mounting
Overhead sensors need a fixed point directly above the counting line and a clear view straight down. Very low ceilings shrink the field of view; very high atrium ceilings push people out of the optimal range and usually call for a drop pole or a bracket at a defined height. Check for obstructions you stop noticing: security gates, signage, seasonal displays, sprinkler heads and air curtains all sit in the sensor’s line of sight.
Lighting and glass storefronts
A glazed shopfront facing the afternoon sun is the hardest condition in retail. Direct sunlight, hard shadows moving across the threshold and reflections off polished floors all degrade appearance-based counting. Depth-based 3D stereo counting is far less sensitive to this, which is why Nano Prime is the default recommendation for a bright glass entrance and Nano AI is the default where lighting is controlled and you want the extra analytics layer.
Staff exclusion
In a small shop, staff walking in and out can be a meaningful share of the total, and every one of those counts pushes measured conversion down. Ask specifically how a system separates employees from customers — V-Count handles this through the sensor’s ability to recognise a staff tag or excluded path, so the retail traffic counting figures in your reports reflect customers only.
Multiple entrances and multiple sites
Every usable public entrance needs its own traffic counter sensor, including the mall-side door, the car-park door and the door people only use in summer. The platform then sums them into one store total rather than reporting them as separate shops. Multi-site retailers normally roll out a traffic counter store by store, starting with a pilot group that covers their best and worst performers so the comparison is meaningful from day one.
POS integration for conversion
A counter that is not joined to sales data can only ever tell you about volume. Confirm at the shortlisting stage that the platform can ingest transaction counts from your POS or ERP, that the timestamps align, and that it can reconcile transaction times with counting intervals. This single integration is what turns a shop traffic counter into a conversion measurement tool.
Privacy and data handling
Ask where processing happens and what leaves the device. V-Count sensors process on board and transmit counts and anonymous attributes, not identifiable images of shoppers — the answer you need in writing before a GDPR-conscious procurement team will sign.
Installation and data flow: from sensor to dashboard
A retail store traffic counter deployment is a short project, not a construction job, but it has a fixed sequence.
- Site survey. Entrance widths, ceiling heights, lighting conditions, existing cabling and the number of doors to cover are recorded, and a mounting position and counting line are agreed for each entrance.
- Mounting and power. The sensor is fixed above the counting line and connected over Ethernet, typically with Power over Ethernet so one cable carries both data and power. Outdoor positions use the weather-sealed Nano Outdoor housing and an appropriate bracket.
- Calibration. The counting line, entry direction and exclusion zones are set, then validated against a manual count over a live trading period. Calibration is the step that separates a trustworthy counter from a disputed one, and it is worth attending.
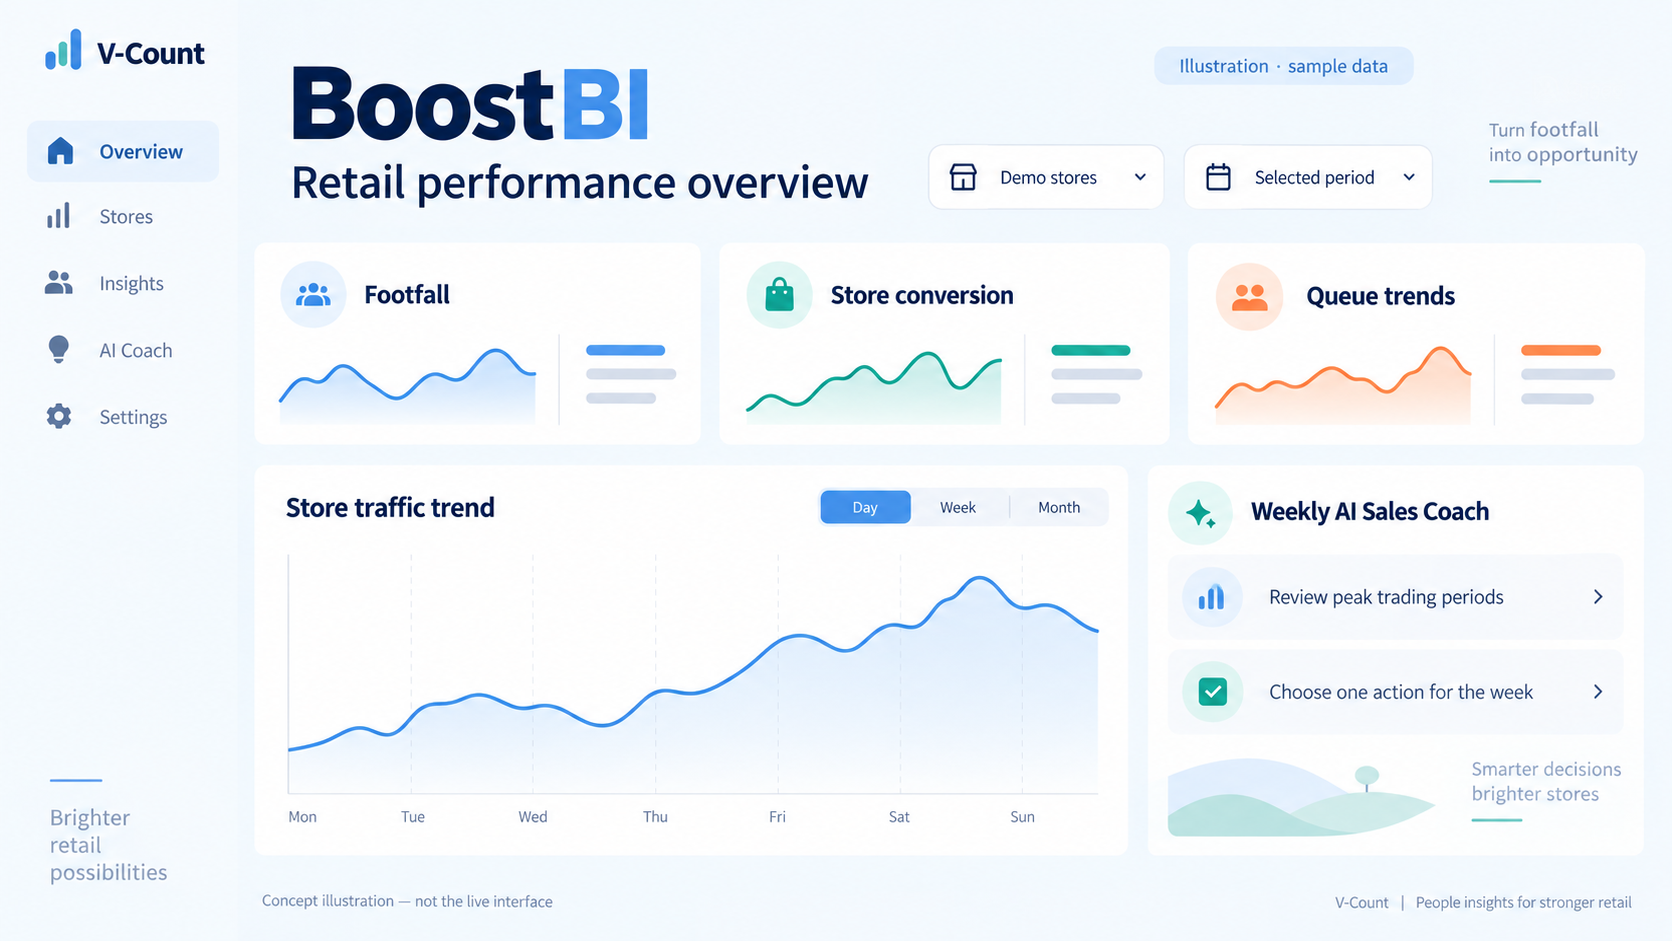
- Data flow. The sensor processes video or depth on board and sends only count events upstream. Those events arrive in BoostBI, where they are aggregated into hourly, daily and weekly footfall data per entrance, per store and per region.
- Reporting and integration. BoostBI provides dashboards, scheduled reports and alerts, plus an API so footfall analytics can be pushed into your own BI tool, workforce management system or POS reporting alongside sales.
Practically, a standard single-entrance store is surveyed, installed and calibrated within a day, and the first useful week-on-week comparison exists after a fortnight of clean data.
How retailers use foot traffic counter data
Staffing that follows demand
The most immediate return comes from rostering. Hourly footfall counting shows where the real peaks are, which is rarely where the rota assumes they are. Aligning shift starts, breaks and till coverage to the traffic curve raises service levels at peak without adding hours, and stops paying for coverage during genuinely quiet periods.
Conversion as a managed metric
Once visitors and transactions sit side by side, conversion becomes a metric a store manager can be held to and can actually influence. It exposes the difference between a store that is quiet and a store that is busy and losing people, and it makes two branches with different catchments fairly comparable. A run of low conversion during a specific hour is a coaching or staffing signal, not a market signal.
Marketing and campaign attribution
Footfall data gives offline campaigns a response curve. Compare traffic in the campaign window against a baseline period and against non-campaign stores, and you can see whether a promotion, a window change or a local ad brought people to the door — separately from whether the shop then converted them. The same comparison values a new fascia, a relocation or a landlord’s mall event.
Merchandising and layout decisions
With an AI camera counter the door count extends into the shop floor: which zones people reach, which displays they stop at, and which corner nobody enters. That turns a layout debate into an evidence-based decision, and it makes a window test measurable within days.
Estate, rent and expansion decisions
Normalised traffic per site is the fairest way to rank a portfolio, review a rent against the footfall a location actually delivers, and set realistic targets for a new store. It is also the evidence a tenant brings to a lease renewal.
What does a foot traffic counter cost? How pricing works
Nobody can quote a store traffic counter from a web page, because the number of entrances and the conditions at each one decide the specification. What you can know in advance is the shape of the quote, which has four components:
- Hardware, per counting point. One sensor per entrance is the base unit, with wide or complex openings needing more than one. The sensor family chosen — Nano AI, Nano Prime or Nano Outdoor — is the main hardware price driver.
- Software subscription. BoostBI is licensed per site on a recurring basis, usually with tiers that reflect which analytics modules you enable: core footfall analytics, occupancy, zone analytics, queue or demographics.
- Installation and calibration. A one-off cost per site, driven by cabling runs, mounting difficulty and how many entrances are covered. Some chains use their own contractors for mounting and buy calibration only.
- Support and warranty. An ongoing element covering firmware, hardware cover and technical support — the part that decides whether a failed sensor at your best branch is fixed this week or this quarter.
Per-store cost falls sharply with estate size, and single-door stores sit at the bottom of the range. For an indicative structure see our pricing page, and for an exact figure request a demo — a short call covering your entrance count and layouts is enough to produce a firm quote.
Choosing your first retail foot traffic counter: a short summary
If you take one thing from this guide, make it this: the retail foot traffic counter you buy should be chosen from the doorway outward. Bright glazed frontage or a wide, busy entrance points to 3D stereo counting with Nano Prime. A controlled-lighting store where you also want zone behaviour, staff exclusion and demographics points to Nano AI. Pavement and open-air counting points to Nano Outdoor. Whichever sensor you start with, insist on directional counting, a documented calibration, POS integration and one analytics platform across the estate — those four things are what separate footfall and people counting systems that get used from foot traffic counters that end up ignored.
Ready to scope your own site? Request a demo and we will walk through your entrances, or read the wider people counting hub for the full product and technology picture.
Talk to us about your entrances
Walk us through your stores and we will map sensors to doors, show the BoostBI reporting your managers would use, and explain the pricing structure for your estate.
Foot traffic counter FAQ
Which tools or analytics platforms help track foot traffic effectively?
Effective footfall tracking needs two layers: a counting sensor at each entrance and an analytics platform behind it. The sensor layer is an overhead AI camera, 3D stereo or thermal device; the platform layer aggregates, validates and reports the counts. Platforms that only estimate traffic from mobile location panels are useful for market-level benchmarking but cannot measure your own door. V-Count supplies both layers: Nano AI, Nano Prime and Nano Outdoor sensors feeding BoostBI, which handles hourly reporting, occupancy, conversion against POS data and multi-site comparison.
What are the top 5 digital tools to track foot traffic and sales for a central market?
For a market or a multi-tenant hall, five tool categories matter. First, entrance counters at every public gate to get a true visitor total. Second, an occupancy module so capacity and crowding are visible live. Third, zone analytics to see which aisles and halls people actually reach. Fourth, a POS or tenant sales feed so traffic can be compared with turnover. Fifth, a reporting platform that combines all of it into one dashboard. V-Count covers all five: Nano sensors on the gates, VCare for occupancy, zone analytics in BoostBI, and API integration for tenant sales.
Which tools or platforms can measure store traffic in France and Belgium?
Quels outils ou plateformes permettent de mesurer le trafic magasin en France et en Belgique ?
Any sensor-based counting system works in France and Belgium; the deciding factors are GDPR compliance and local installation and support. Choose a system that processes video on the device and transmits only anonymous counts, never identifiable images, and document that in your processing register. V-Count sensors are designed on that principle and BoostBI is used across European retail estates, with multi-country reporting in one account so a French and a Belgian store sit in the same comparison, in local currency and local trading hours.
What are the best software options for foot traffic analysis?
The best footfall analytics software does four things: it validates raw counts before reporting them, it aligns traffic with sales so conversion is trustworthy, it compares like-for-like across stores and periods, and it exports cleanly into the tools you already use. Dashboards alone are not enough — scheduled reports and alerts are what get the data in front of store managers. BoostBI is built around that set: entrance, zone and occupancy data in one place, POS integration for conversion, and an API for your own BI stack.
What are the best tools to count footfall and compare it to sales?
You need a directional entrance counter plus an integration to your transaction source. The counter gives the visitor denominator; the POS gives the transaction numerator; conversion is the result. The important details are staff exclusion, so employees do not inflate visitors, and timestamp alignment, so a 14:05 sale lands in the 14:00 traffic interval. V-Count sensors handle staff exclusion at the sensor, and BoostBI ingests POS data to produce conversion per hour, per day, per store and per region without manual spreadsheet work.
Can you recommend the top 5 reliable people counting solutions for retail foot traffic analytics?
Rather than a vendor league table, judge any shortlist against five requirements. One: directional counting, so entries and exits are separate. Two: proven performance in your lighting, especially a glazed shopfront. Three: staff exclusion. Four: an open API and POS integration, so the data leaves the vendor’s dashboard. Five: a support and calibration commitment, because an uncalibrated sensor quietly ruins a year of reporting. V-Count meets all five with Nano AI for behavioural depth, Nano Prime for difficult doorways, Nano Outdoor for open areas, and BoostBI as the reporting layer.
What tools are commonly used to track and analyze footfall?
In practice retailers use four things. Overhead sensors at the entrance, which do the counting. An analytics platform, which stores, validates and reports. A POS or ERP integration, which supplies transactions for conversion. And often a workforce management system that consumes the traffic curve to build rotas. Older estates still rely on break-beam door counters or manual clicker counts; both underreport and neither supports conversion reporting. Replacing them with an overhead sensor and a proper platform is usually the first step in a footfall programme.
Can I integrate a traffic counter with my existing POS system?
Yes — and you should, because POS integration is what produces conversion rate. BoostBI ingests transaction data from common POS and ERP systems through its API or a scheduled data feed, matches it to the counting intervals from your sensors, and reports visitors, transactions and conversion together. The only real requirements are that your POS can export transaction counts per store with timestamps, and that store clocks are synchronised. Where a direct connector does not exist, a flat-file or database feed is the standard fallback.
Can you recommend tools to monitor local search rankings and foot traffic for my store?
These are two different toolsets and they are best kept separate. Local visibility — map pack rankings, profile views, direction requests — comes from your business profile analytics and a local SEO rank tracker. Actual visits come from a sensor at your door. The value is in joining them: export weekly footfall data from BoostBI, line it up against local search impressions and direction requests for the same weeks, and you can see whether online visibility is translating into people in the shop, and whether the shop then converts them.